As we wind up our charting of CV-19 data from Minnesota, here is a final look at deaths among long-term care residents versus the general population. The virus was particularly deadly for very ill and frail nursing home residents. A major failure of the epidemic response was to panic about these deaths and lockdown the entire population. Please note that so many vulnerable LTC residents died early in the epidemic, that there were fewer available to be infected by 2021, but as Dave points out, over the last year the proportion has risen again.
 Dave’s notes:
- The Minnesota Department of Health (MDH) provides relatively limited data on the number of cases and deaths occurring for residents of Long Term Care (LTC) facilities. Since 6/30/2022 MDH publishes a cumulative total of LTC deaths attributed to Covid every Thursday. In addition MDH publishes the cumulative number of deaths among jail inmates and among “High-Risk Congregate Care Facilities”, which includes group homes, homeless shelters, etc. The remaining deaths, which typically make up a large proportion of the deaths, occur for residents of private homes. For purposes of these charts we are grouping all non-LTC deaths together.
- We last published charts on LTC death here on 2/11/2023: https://healthy-skeptic.com/2023/02/11/long-term-care-deaths-update/.
- The cumulative death totals for LTC residents, and non-LTC residents, can be found on the Setting Specific Data page on the MDH Situation Update for COVID-19 web page, here: https://www.health.state.mn.us/diseases/coronavirus/stats/setting.html. Cumulative long term care resident deaths are found in the notes under the “Assisted Living and Skilled Nursing Facilities” graphic. Note that MDH does not report actual LTC deaths by date of death, but only reported cumulative deaths every Thursday. We therefore do not know when the reported LTC deaths actually occurred. By using 4 week rolling averages in Fig. 2 we hope that any errors in the proportions due to mismatched timing of LTC and non-LTC death reports may be minimized.
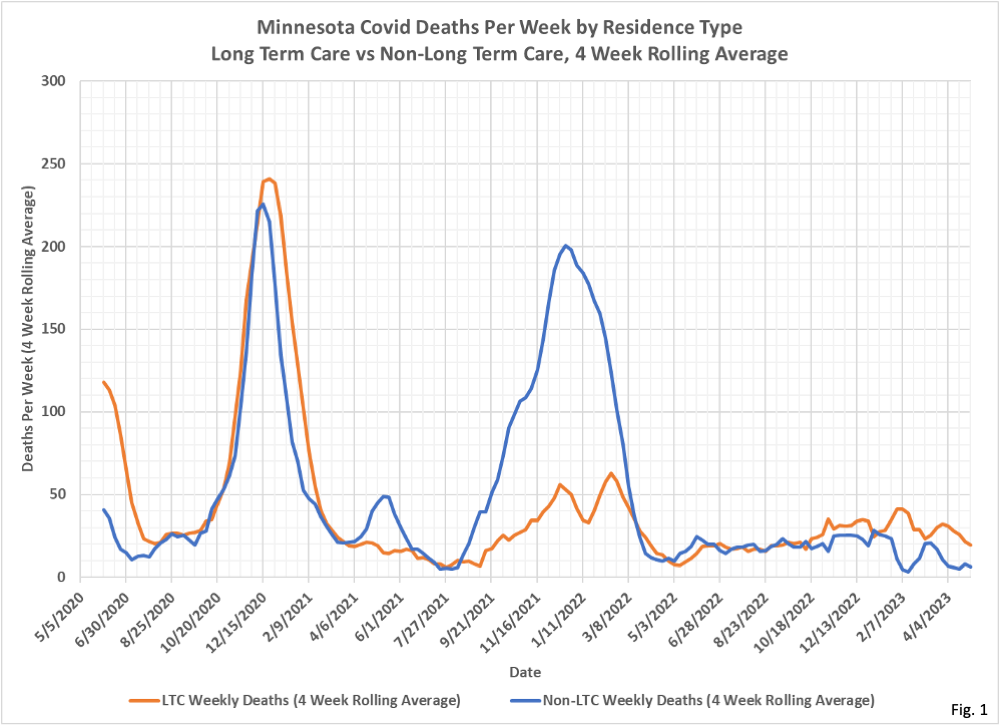
- Fig. 1: This chart displays the average deaths per week of the 4 week period ending on the date on the horizontal axis. The relatively low number of LTC deaths during the Covid wave of late 2021/early 2022 really stands out. Throughout most of 2022 LTC deaths had been gradually increasing, peaking in February 2023. Since then deaths among LTC and also non-LTC residents have been decreasing sharply.
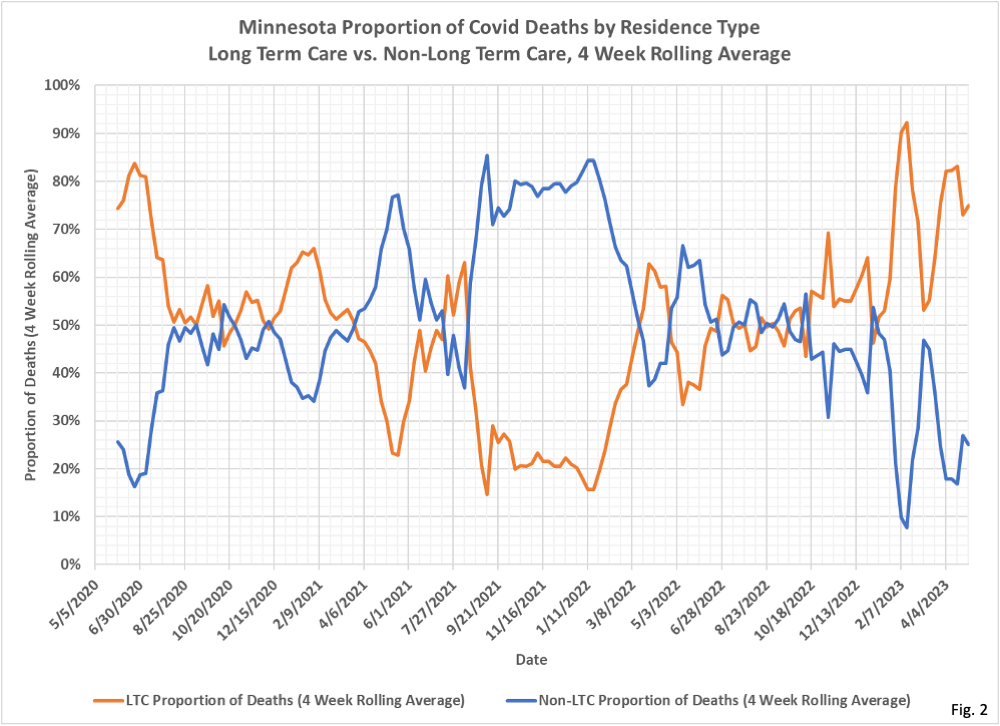
- Fig. 2: The data in Fig. 1 is displayed as simple proportions of the residence type for rolling 4 week periods. The low proportion of LTC deaths in late 2021 is very obvious in this chart. Since late 2021 the proportion of LTC deaths has been steadily rising, exceeding 90% of all deaths in February 2023.
