Here is the last set of tables on CV-19 data by vax status. I would like to point out that until Dave and I made a big issue of it, our idiot Governor and Health Commissioner were lying to the public and claiming that vaxed people were not getting infected, hospitalized or dying. The data Dave and I forced to get released resulted in these tables and charts showing that in fact vaxed people quickly accounted for most events and that the vax after a short time had almost no effectiveness against infection, and a greatly lessened effectiveness against serious disease and death. The most recent data, through the beginning of April, shows the exact same thing.
 Dave’s notes:
- With the data release on 5/04/2023, the Minnesota Department of Health (MDH) changed the vaccination categories used to report breakthrough Covid cases, hospital admissions, and deaths. Prior to 5/04, the categories were Not Fully Vaccinated (those who are unvaccinated or only received one shot of the two shot vaccination series), Fully Vaccinated (received both primary series vaccination shots), and Boosted (those who had one or more booster shots, either the original booster or the new bivalent booster). The new categories published on 5/04 are Unvaccinated (not having received any vaccination shots), Vaccinated Without Bivalent Booster (those who received the two original vaccination shots and may have also received one or more of the original monovalent booster shots, Bivalent Boosted (received at least one bivalent booster).
- Note that those who received only one of the 2 original booster shots are not included in the new reporting categories. After an email exchange with MDH, we can confirm that the cases, hospital admissions, and deaths that occurred in the population who had only received 1 or 2 primary Covid vaccinations are not reported in the new version of the breakthrough data.
- The old category of “Not Fully Vaccinated” also included those with a single vaccination shot. Assuming that the single vaccination provided some protection, we would expect the new category of “Unvaccinated” to have higher rates of cases, admissions, and deaths per 100k since the new category excludes partially vaccinated individuals.
- As always, natural immunity from prior infections in not considered in this analysis. Despite repeated requests, MDH has not provided (and claims they do not possess) data on the vaccination status and reinfection status of Covid cases.
- By comparing the weekly data published on 4/27 using the old categories, and on 5/04 using the new categories, we are able to generate data for a total of 5 vaccination categories, 1). Unvaccinated (directly from the new data file), 2). Partially Vaccinated (the “Not Fully Vaccinated” category minus the new “Unvaccinated” category), 3). Fully Vaccinated (from the old data file), 4). Monovalent Boosted (from the old data file), and 5). Bivalent Boosted (from the new data file). The 4/27/23 data file ends 4/2/23. In subsequent weeks there are typically a small number of changes to the prior reported data. By combining the data from 2 weeks as we did we are potentially missing these minor changes, but we expect them to be of a relatively small magnitude.
- Note that this will be the only time we can generate these tables with all 5 vaccination categories. Since MDH will only publish the 3 new vaccination categories going forward we won’t be able generate the partially vaccinated category in the future, and the categories we have taken from the old reporting (fully vaccinated and monovalent boosted) will be obsolete in future weeks.
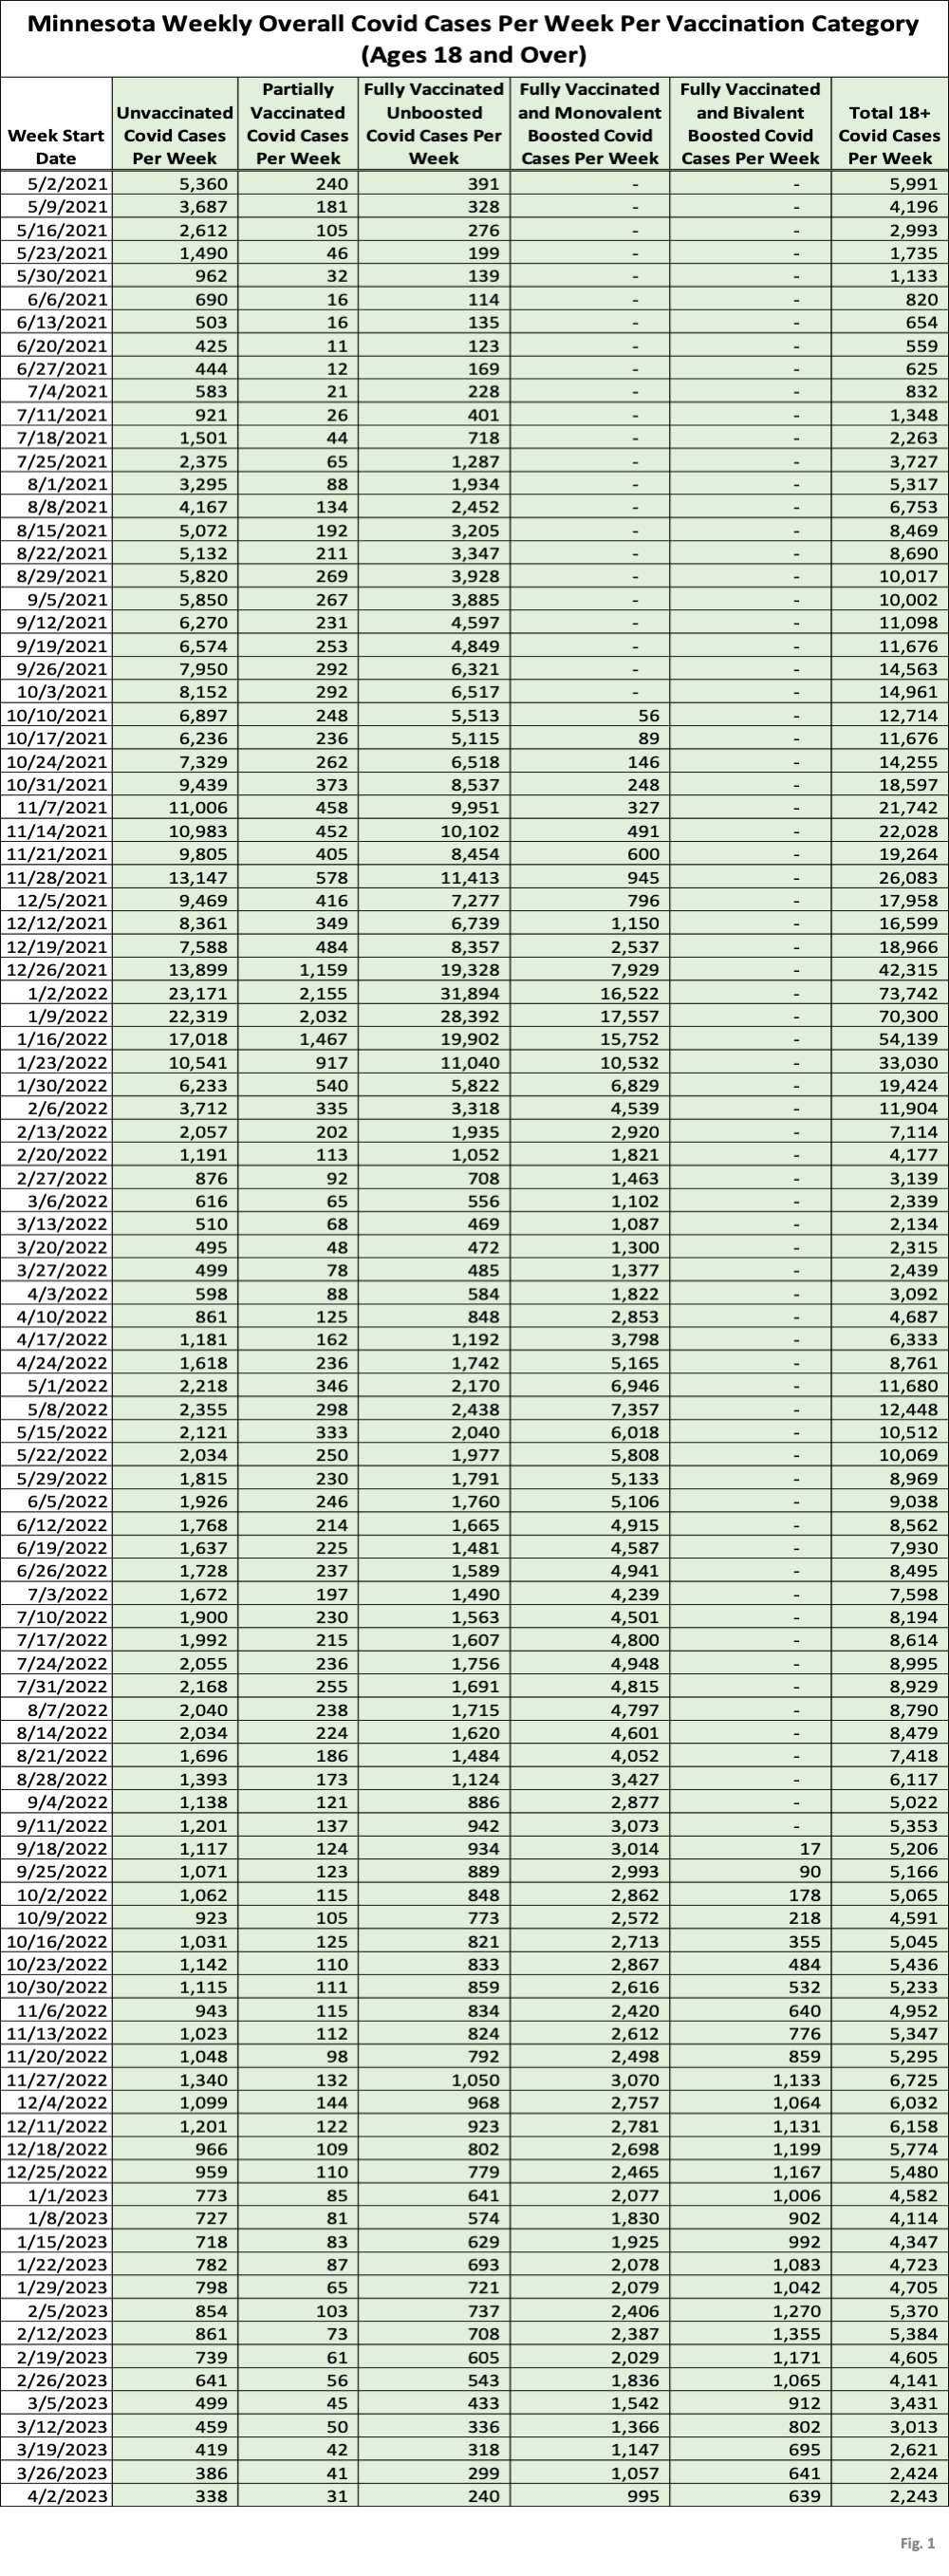
- Fig.1, Minnesota Covid Cases Per Week by Vaccination Status, 18 and Over: The raw number of cases each week for the 5 vaccination categories derived from the change in breakthrough reporting that occurred on 5/04/2023. The unvaccinated and partially vaccinated make up a small percentage of the number of cases in the 18+ population in recent months. Of course, a great majority of the population is vaccinated and boosted so seeing a majority of cases among the vaccinated and boosted should not be a surprise.
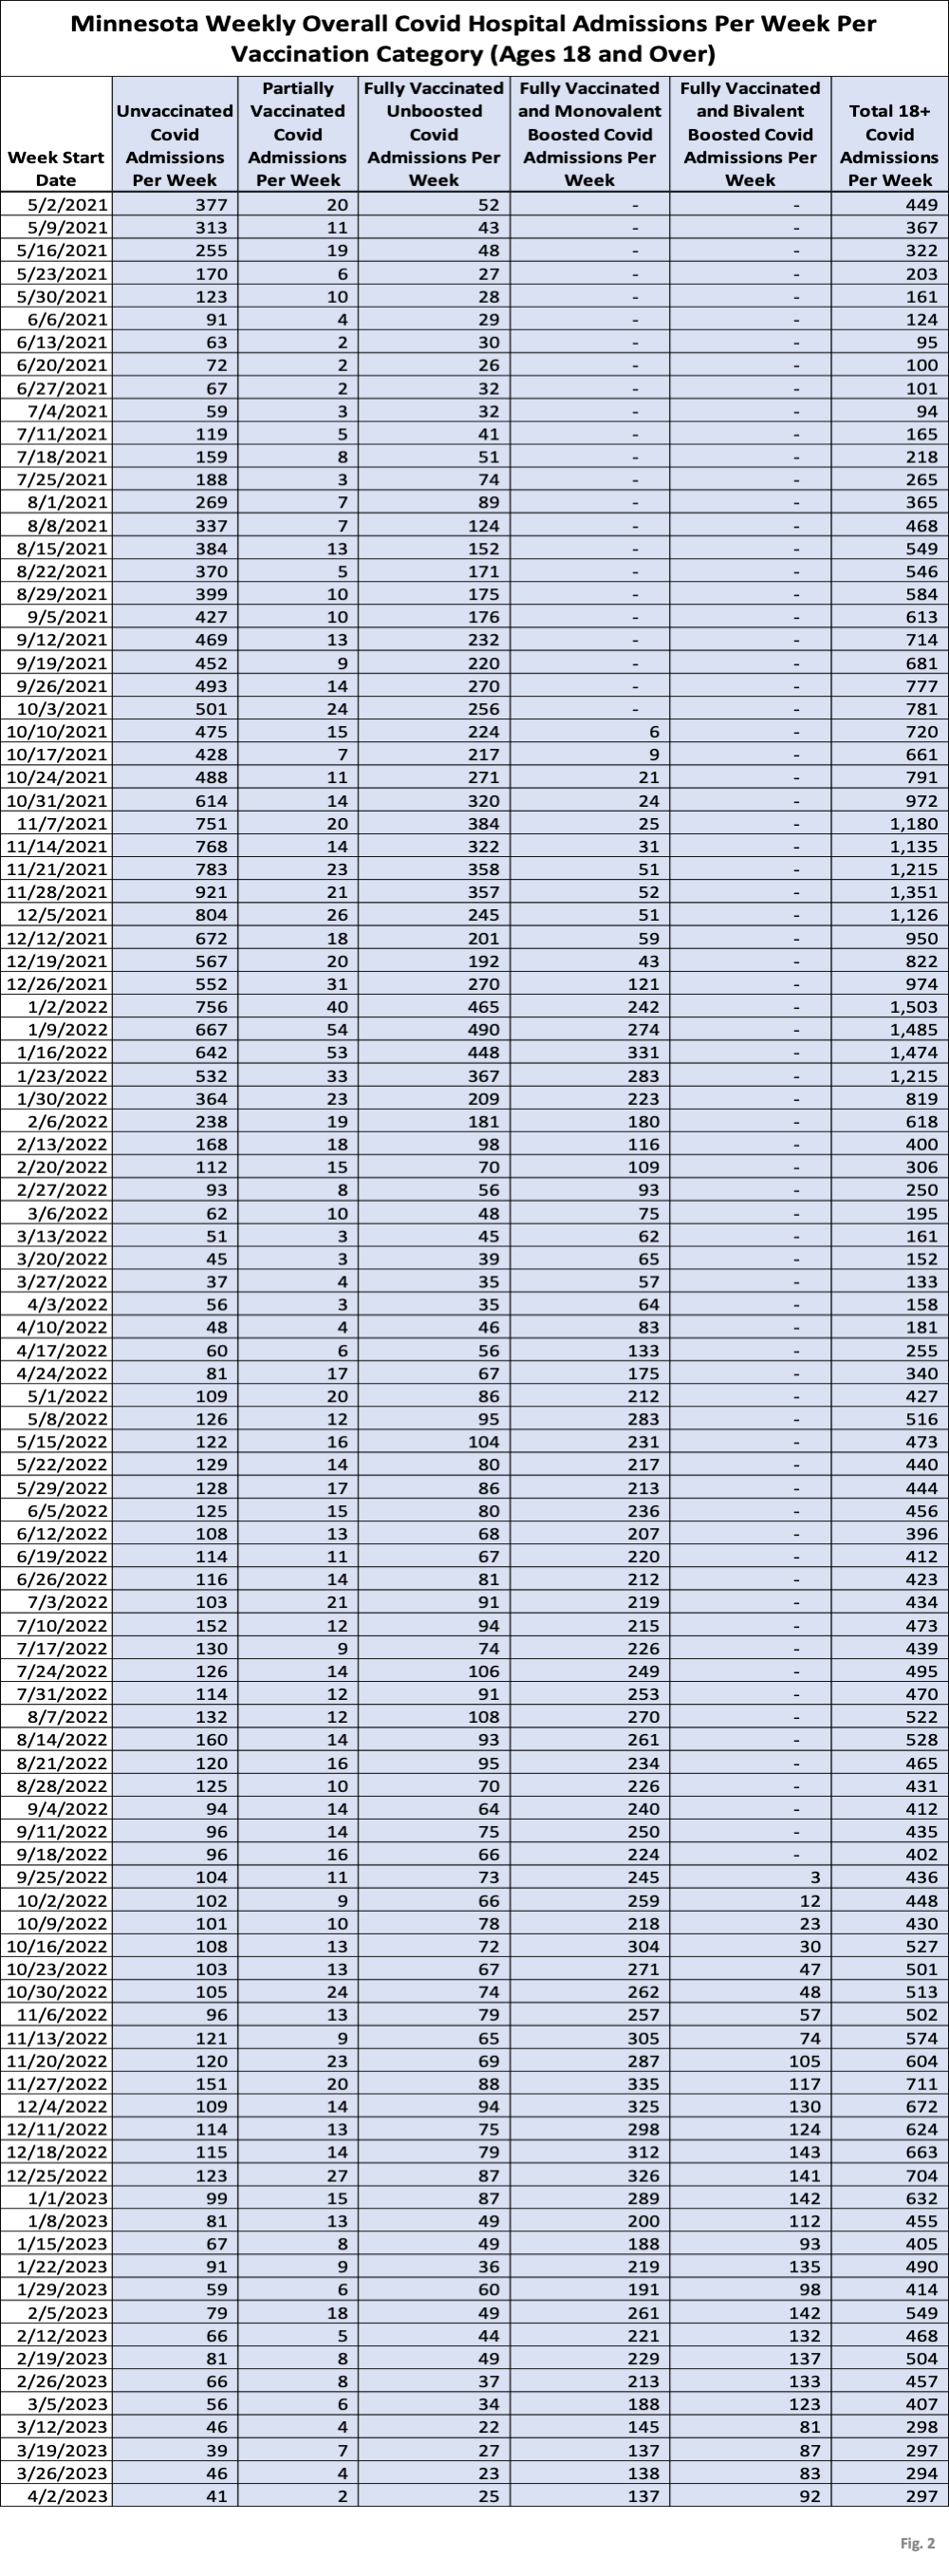
- Fig. 2, Minnesota Covid Hospital Admissions Per Week by Vaccination Status, 18 and Over: As with cases in Fig. 1, a majority of hospital admissions occurred among the vaccinated and boosted in recent months.
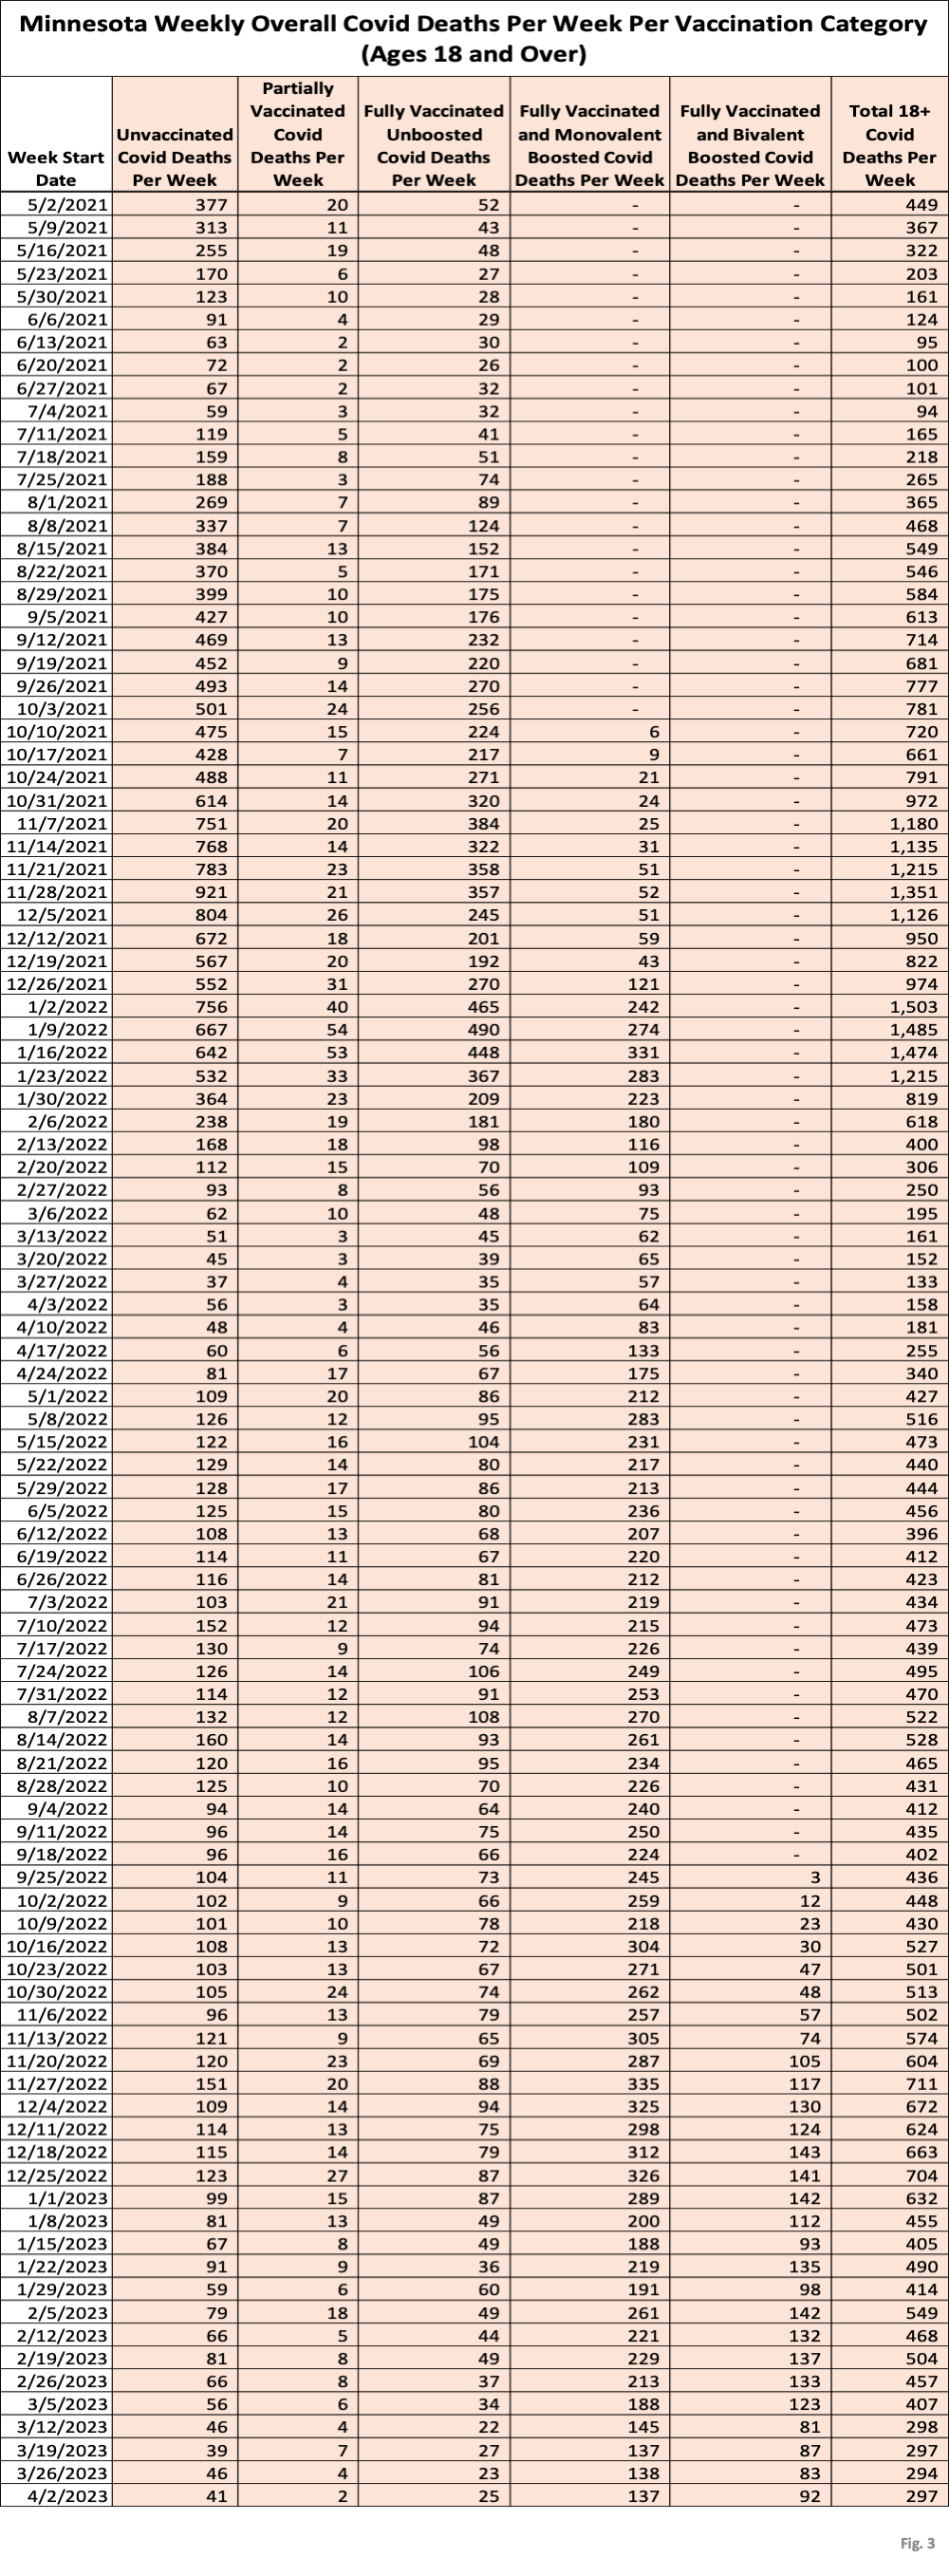
- Fig. 3, Minnesota Covid Deaths Per Week by Vaccination Status, 18 and Over: Finally, a majority of the deaths also occur among the vaccinated and boosted in recent months.
