 Dave’s notes:
- With the data release on 5/04/2023, the Minnesota Department of Health (MDH) changed the vaccination categories used to report breakthrough Covid cases, hospital admissions, and deaths. Prior to 5/04, the categories were Not Fully Vaccinated (those who are unvaccinated or only received one shot of the two shot vaccination series), Fully Vaccinated (received both primary series vaccination shots), and Boosted (those who had one or more booster shots, either the original booster or the new bivalent booster). The new categories published on 5/04 are Unvaccinated (not having received any vaccination shots), Vaccinated Without Bivalent Booster (those who received the two original vaccination shots and may have also received one or more of the original monovalent booster shots, Bivalent Boosted (received at least one bivalent booster).
- Note that those who received only one of the 2 original booster shots are not included in the new reporting categories. After an email exchange with MDH, we can confirm that the cases, hospital admissions, and deaths that occurred in the population who had only received 1 or 2 primary Covid vaccinations are not reported in the new version of the breakthrough data.
- The old category of “Not Fully Vaccinated” also included those with a single vaccination shot. Assuming that the single vaccination provided some protection, we would expect the new category of “Unvaccinated” to have higher rates of cases, admissions, and deaths per 100k since the new category excludes partially vaccinated individuals.
- As always, natural immunity from prior infections in not considered in this analysis. Despite repeated requests, MDH has not provided (and claims they do not possess) data on the vaccination status and reinfection status of Covid cases.
- By comparing the weekly data published on 4/27 using the old categories, and on 5/04 using the new categories, we are able to generate data for a total of 5 vaccination categories, 1). Unvaccinated (directly from the new data file), 2). Partially Vaccinated (the “Not Fully Vaccinated” category minus the new “Unvaccinated” category), 3). Fully Vaccinated (from the old data file), 4). Monovalent Boosted (from the old data file), and 5). Bivalent Boosted (from the new data file). The 4/27/23 data file ends 4/2/23. In subsequent weeks there is typically a small number of changes to the prior reported data. By combining the data from 2 weeks as we did we are potentially missing these minor changes, but we expect them to be of a relatively small magnitude.
- Note that this will be the only time we can generate these types of charts with all 5 vaccination categories. Since MDH will only publish the 3 new vaccination categories going forward we won’t be able generate the partially vaccinated category in the future, and the categories we have taken from the old reporting (fully vaccinated and monovalent boosted) will be obsolete in future weeks.
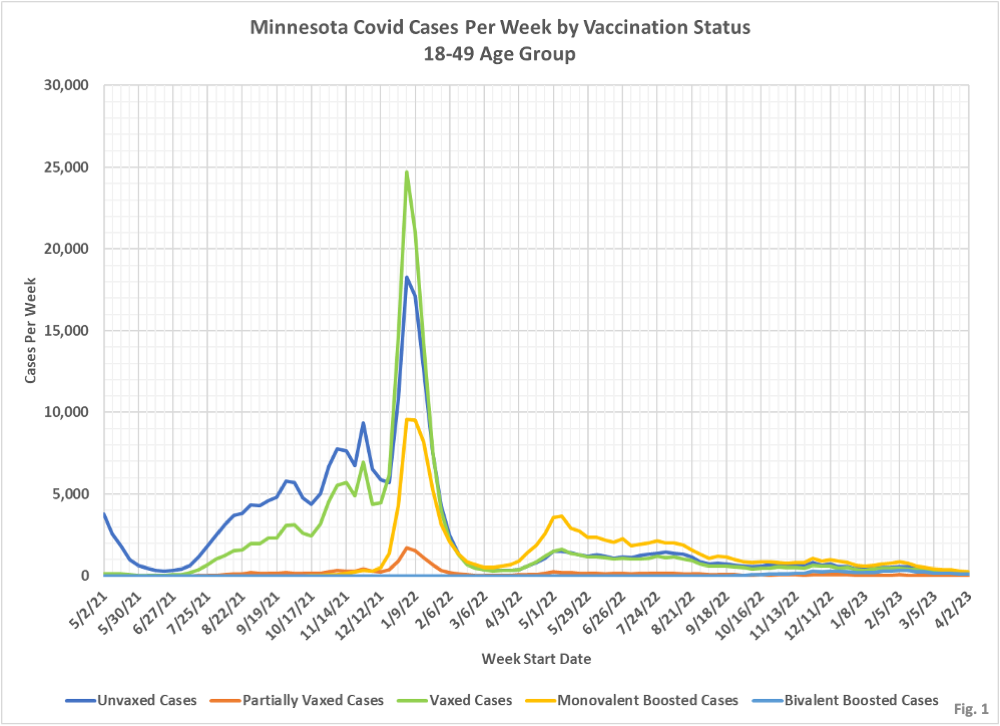
- Fig.1, Minnesota Covid Cases Per Week by Vaccination Status, 18-49 Age Group: Similar to the other age groups, the 18049 age group has the highest number of cases among the unvaccinated until the end of 2021. Since then the vaccinated and then the monovalent boosted have the highest number of Covid cases. In the last month the number of cases has dropped sharply in this age group, regardless of vaccination status.
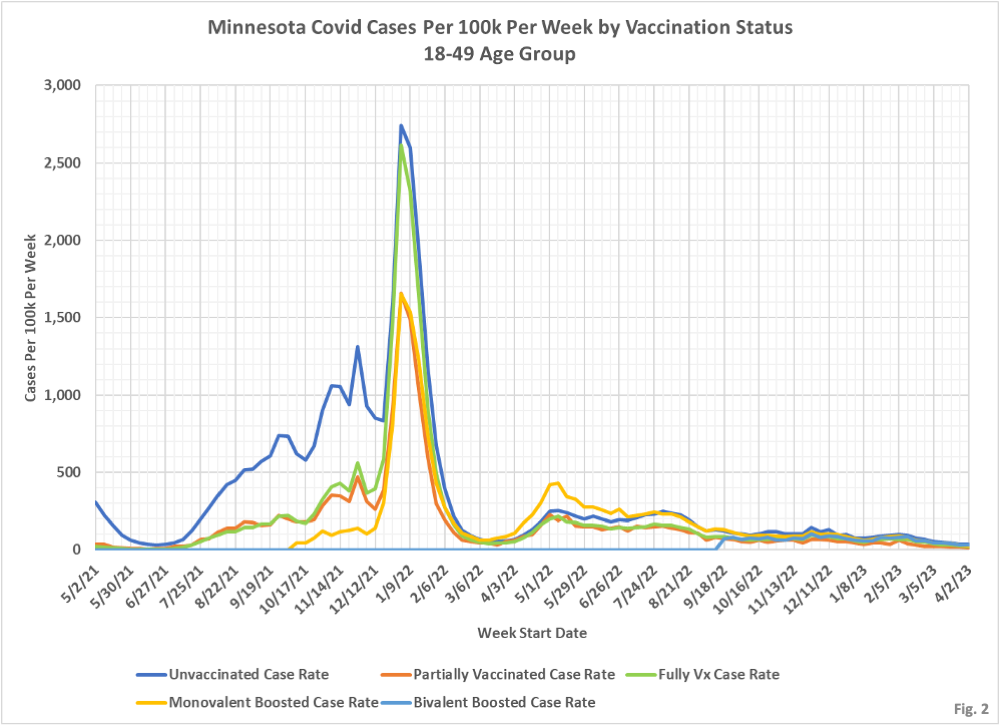
- Fig. 2, Minnesota Covid Cases Per Week Per 100k by Vaccination Status, 18-49 Age Group: On a per capita basis, during the winter of 2021/2022 the unvaccinated and fully vaccinated had fairly similar case rates, meaning that being fully vaccinated did not seem to decrease a person’s risk of testing positive. Note however, that the partially vaccinated during this time frame had a much lower case rate, similar to the monovalent booster case rate. Since the fall of 2022 the case rates are fairly equal regardless of vaccination status.
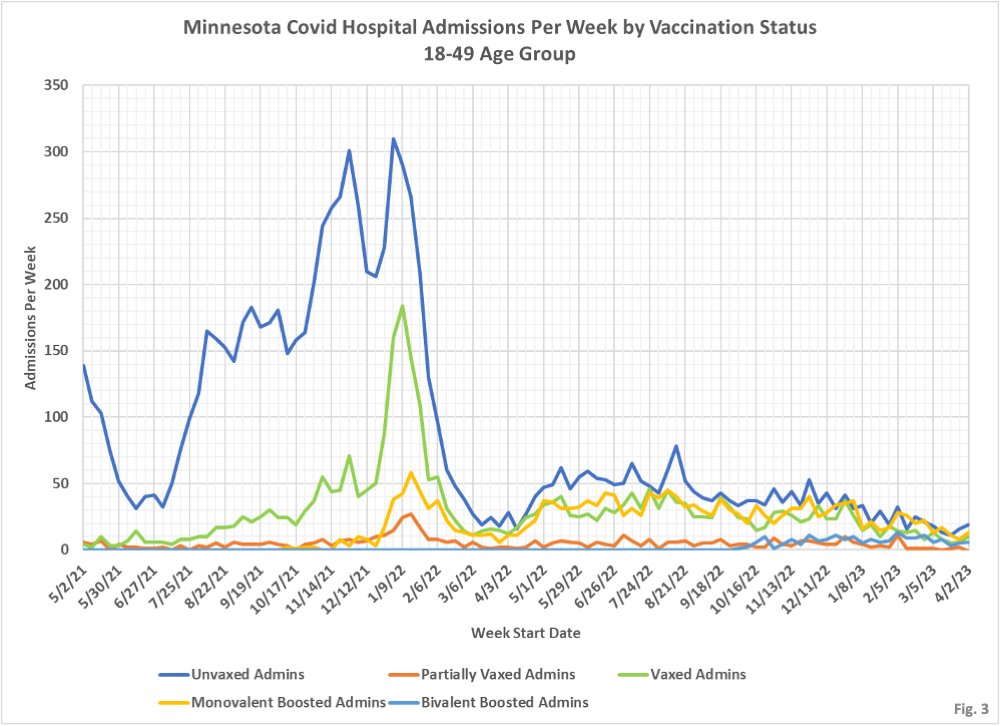
- Fig. 3, Minnesota Covid Hospital Admissions Per Week by Vaccination Status, 18-49 Age Group: The unvaccinated have had the highest numbers of admissions of any of the vaccination groups, even until fairly recently. This group is less highly vaccinated than the older age groups, so there is a larger unvaccinated population at risk of hospitalization.
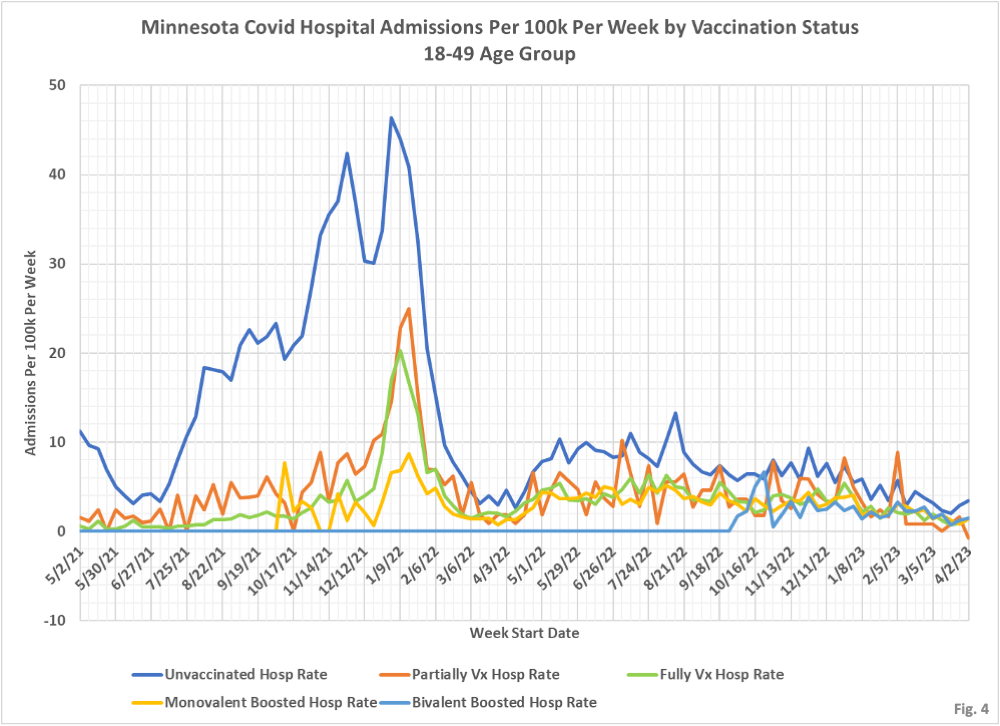
- Fig. 4, Minnesota Covid Hospital Admissions Per 100k Per Week by Vaccination Status, 18-49 Age Group: Even on a per capita basis, the unvaccinated subset of this age group seem to consistently have a higher rate of hospitalization than the other vaccination groups.
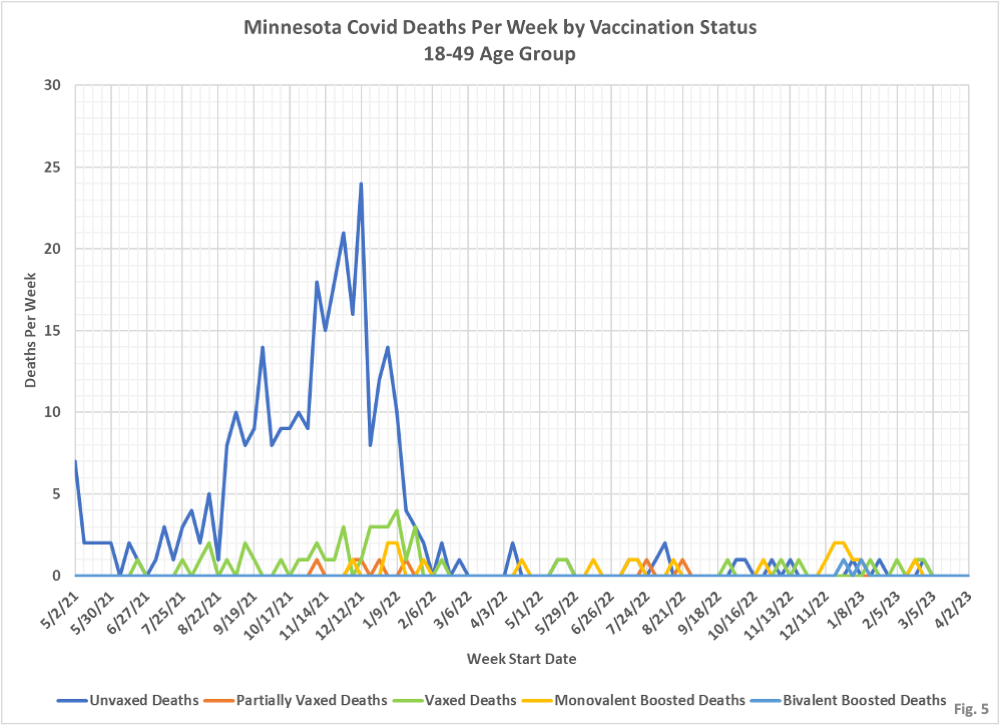
- Fig. 5, Minnesota Covid Deaths Per Week by Vaccination Status, 18-49 Age Group: The unvaccinated had a fairly high number of deaths early in the pandemic, but thankfully since early 2022 there have been very few deaths in this age category.
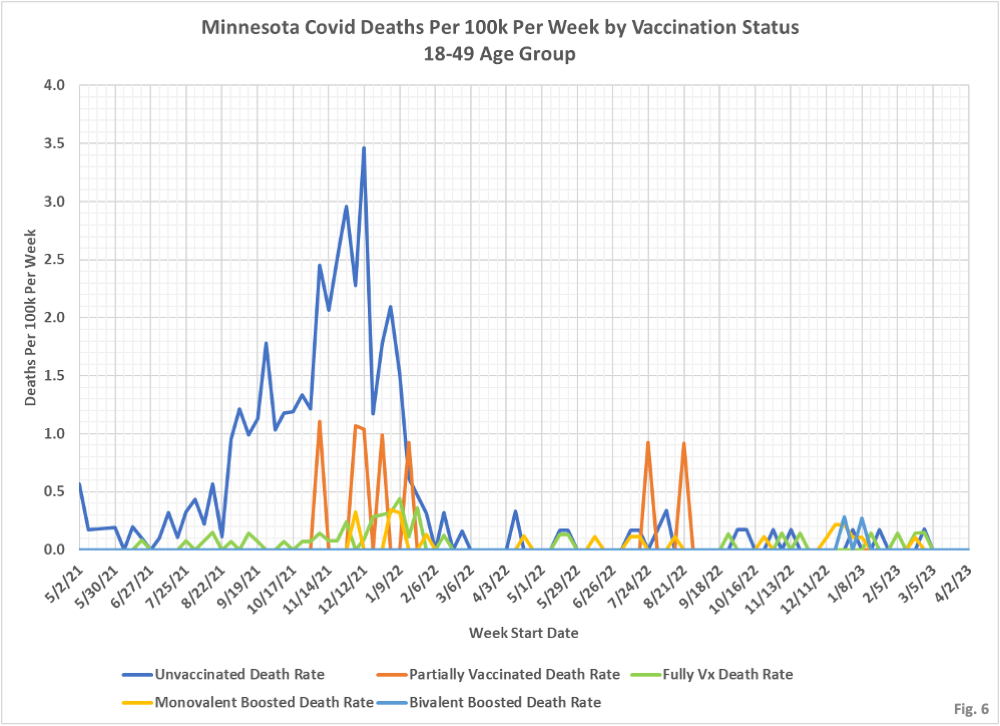
- Fig. 6, Minnesota Covid Deaths Per 100k Per Week by Vaccination Status, 18-49 Age Group: There are very low deaths rates regardless of vaccination status since February 2022.
