As with the other charts, these will be the last set, unless there is some unlikely substantial return of the epidemic. As Dave notes in more detail below, the DOH has once more completely screwed up the data provision, making continuity in analysis close to impossible. But as usual, Dave has managed to work around the issues. Please note that the changes were designed to hide how poorly the vaccines work after a few months.
 Dave’s notes:
- With the data release on 5/04/2023, the Minnesota Department of Health (MDH) changed the vaccination categories used to report breakthrough Covid cases, hospital admissions, and deaths. Prior to 5/04, the categories were Not Fully Vaccinated (those who are unvaccinated or only received one shot of the two shot vaccination series), Fully Vaccinated (received both primary series vaccination shots), and Boosted (those who had one or more booster shots, either the original booster or the new bivalent booster). The new categories published on 5/04 are Unvaccinated (not having received any vaccination shots), Vaccinated Without Bivalent Booster (those who received the two original vaccination shots and may have also received one or more of the original monovalent booster shots, Bivalent Boosted (received at least one bivalent booster).
- Note that those who received only one of the 2 original booster shots are not included in the new reporting categories. After an email exchange with MDH, we can confirm that the cases, hospital admissions, and deaths that occurred in the population who had only received 1 or 2 primary Covid vaccinations are not reported in the new version of the breakthrough data.
- The old category of “Not Fully Vaccinated” also included those with a single vaccination shot. Assuming that the single vaccination provided some protection, we would expect the new category of “Unvaccinated” to have higher rates of cases, admissions, and deaths per 100k since the new category excludes partially vaccinated individuals.
- As always, natural immunity from prior infections in not considered in this analysis. Despite repeated requests, MDH has not provided (and claims they do not possess) data on the vaccination status and reinfection status of Covid cases.
- By comparing the weekly data published on 4/27 using the old categories, and on 5/04 using the new categories, we are able to generate data for a total of 5 vaccination categories, 1). Unvaccinated (directly from the new data file), 2). Partially Vaccinated (the “Not Fully Vaccinated” category minus the new “Unvaccinated” category), 3). Fully Vaccinated (from the old data file), 4). Monovalent Boosted (from the old data file), and 5). Bivalent Boosted (from the new data file). The 4/27/23 data file ends 4/2/23. In subsequent weeks there are typically a small number of changes to the prior reported data. By combining the data from 2 weeks as we did we are potentially missing these minor changes, but we expect them to be of a relatively small magnitude.
- Note that this will be the only time we can generate these types of charts with all 5 vaccination categories. Since MDH will only publish the 3 new vaccination categories going forward we won’t be able generate the partially vaccinated category in the future, and the categories we have taken from the old reporting (fully vaccinated and monovalent boosted) will be obsolete in future weeks.
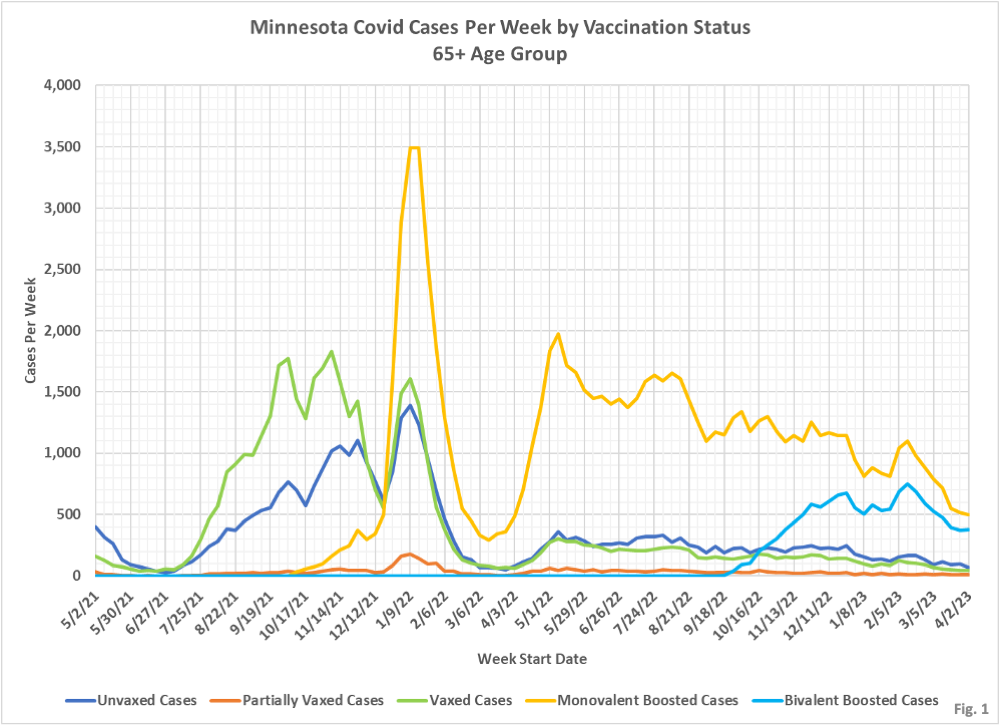
- Fig.1, Minnesota Covid Cases Per Week by Vaccination Status, 65+ Age Group: In raw numbers of cases, the unvaccinated have not had the highest number of weekly cases since the summer of 2021. Since then either the vaccinated or the boosted have had the highest number of cases, driven by the high proportion of the 65+ age group which is vaccinated or boosted.
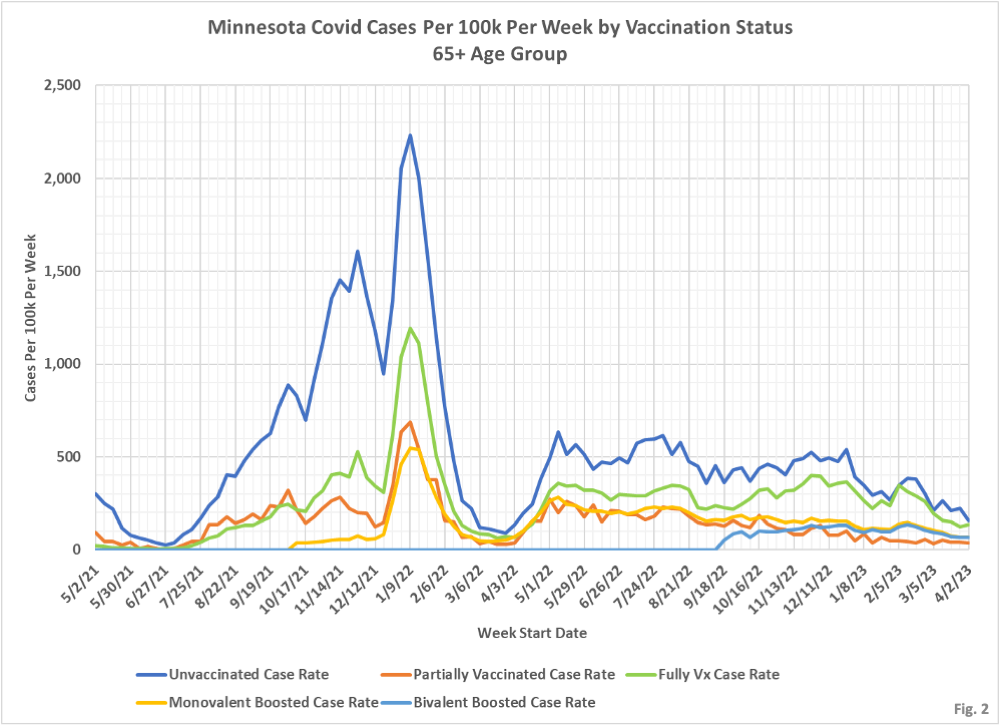
- Fig. 2, Minnesota Covid Cases Per Week Per 100k by Vaccination Status, 65+ Age Group: In this chart we convert the raw number of cases in Fig. 1 to cases per 100k. Generally, the unvaccinated have had the highest rate of cases per 100k throughout the entire pandemic. It is interesting that the partially vaccinated, those with only 1 of the 2 original vaccinations, seem to have performed the best of all throughout most of the pandemic.
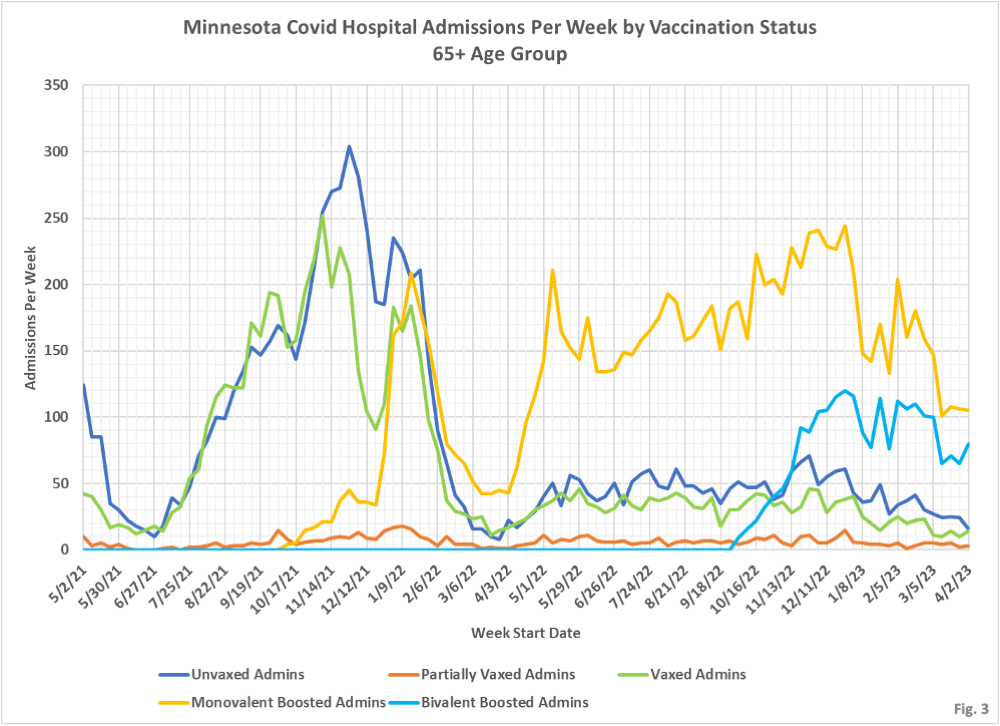
- Fig. 3, Minnesota Covid Hospital Admissions Per Week by Vaccination Status, 65+ Age Group: Since this age group is very highly vaccinated, we should not be surprised that the vaccinated and boosted have had the highest numbers of hospital admissions. Hardly an epidemic of the unvaccinated as we were told for a long period of time.
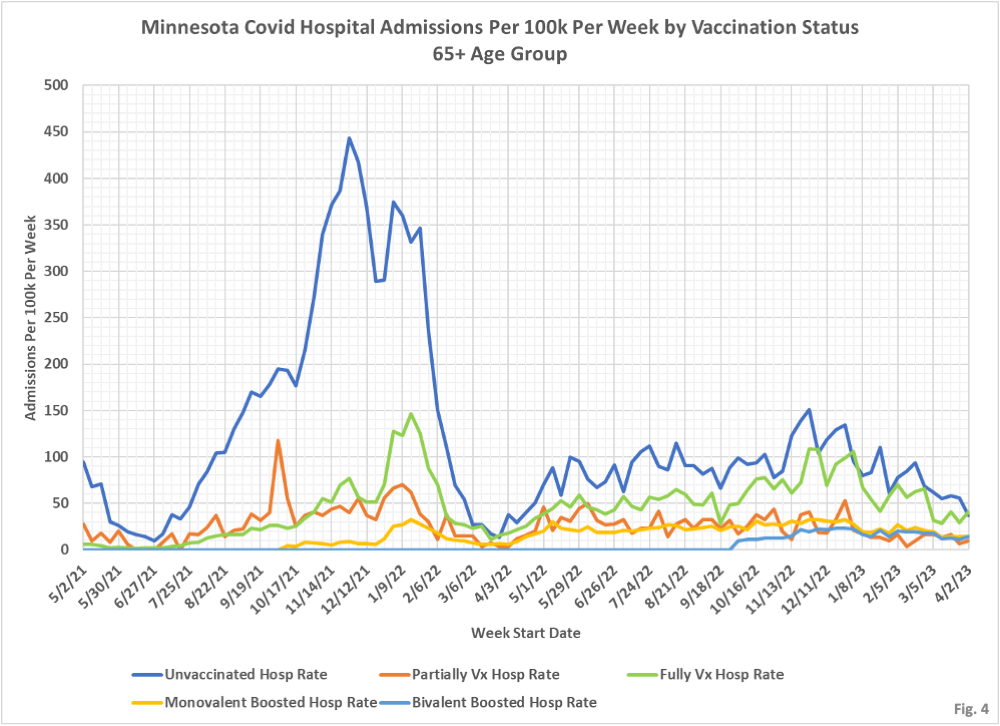
- Fig. 4, Minnesota Covid Hospital Admissions Per 100k Per Week by Vaccination Status, 65+ Age Group: This chart shows that the unvaccinated have had the highest hospital admission rates throughout the pandemic, closely followed recently by the fully vaccinated. Note how low the hospital admission rate is for the partially vaccinated. It would be interesting to get actual data from MDH on this category, to eliminate the uncertainty from calculating this data from successive weeks’ data.
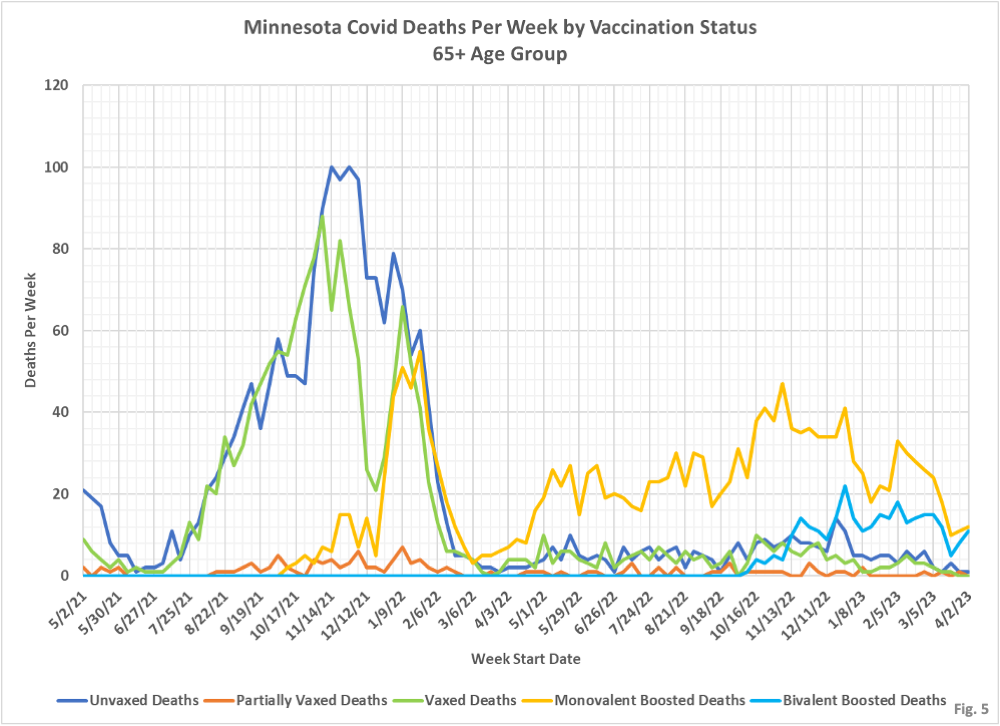
- Fig. 5, Minnesota Covid Deaths Per Week by Vaccination Status, 65+ Age Group: As we have seen for cases and hospital admissions, the high vaccination rates for this age group causes the boosted categories to have the highest number of deaths.
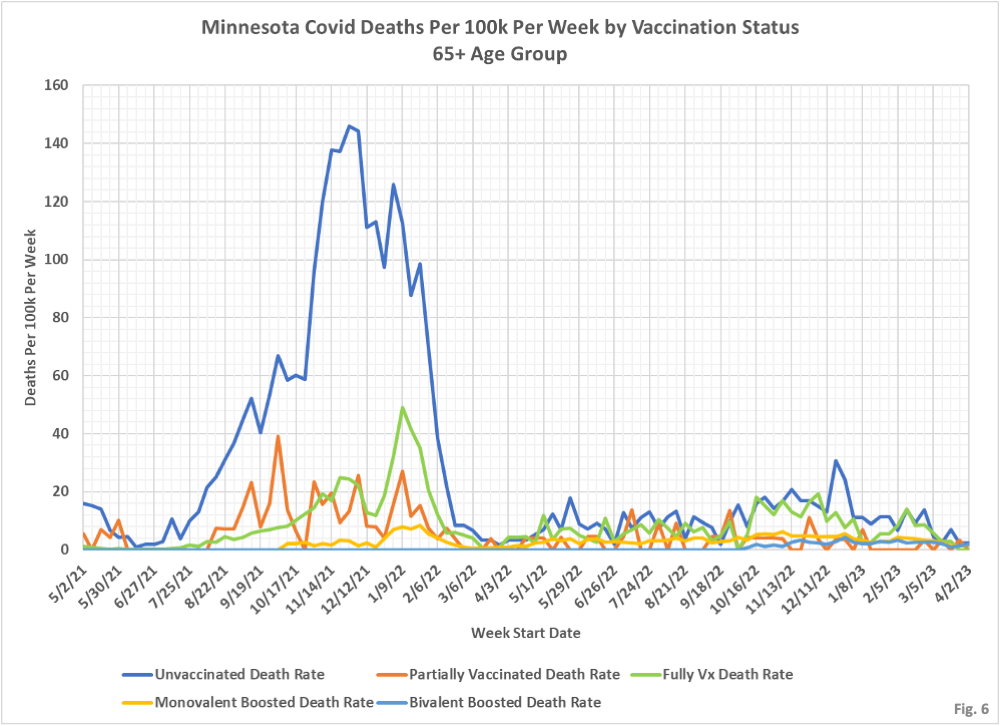
- Fig. 6, Minnesota Covid Deaths Per 100k Per Week by Vaccination Status, 65+ Age Group: On a per capita rate basis, the unvaccinated had the highest death rate by far until early 2022. After that, the death rates are fairly equal across the different categories, although the unvaccinated have tended to have slightly higher death rates.
