I know most Minnesotans are paying no attention to this garbage bill. I know most of them just swallow the global climate crisis emergency headlines without even thinking about it. I know most of them have no idea how much renewables cost, how unreliable they are and how bad for the environment. But when their electricity bills double and triple and when they simply don’t have any electricity, they will care a lot more. Here is the latest installment of Dave’s analysis of this nonsense. Please note the complete mismatch between the generating capability being shut down in the next few years and the planned renewable replacements, most of which have not even begun construction. These facilities are going to run into material cost increases, regulatory delays, transmission issues, etc. Maybe the Incompetent Blowhard can use his blizzard of words to generate electricity.
 Dave’s notes:
1. Motivated by the recent passage of legislation mandating carbon free electricity in Minnesota by 2040, we have been exploring the current state on electrical generation in Minnesota starting with Minnesota’s New Energy Insanity, Part 1 (https://healthy-skeptic.com/2023/02/12/minnesotas-new-energy-insanity-part-1/), and continuing on through Part 5 (https://healthy-skeptic.com/2023/03/06/minnesotas-new-energy-insanity-part-5/). Today in Part 6 we will look at the short-term implications of Minnesota’s changing energy mix.
2. My conclusion, after examining Minnesota’s current electrical generating capacity along with planned retirements and planned additional capacity, is that in the next two years Minnesota’s net electrical generating capacity will be reduced while at the same time becoming more dependent on intermittent wind and solar power. We do not have the data to know at what point demand will exceed generating capacity on a momentary basis. It seems likely that at some point in the next few years we will reach those limits during parts of the certain days during high-demand parts of the year, and rolling blackouts will be the likely result, unless additional power can be imported from other states.
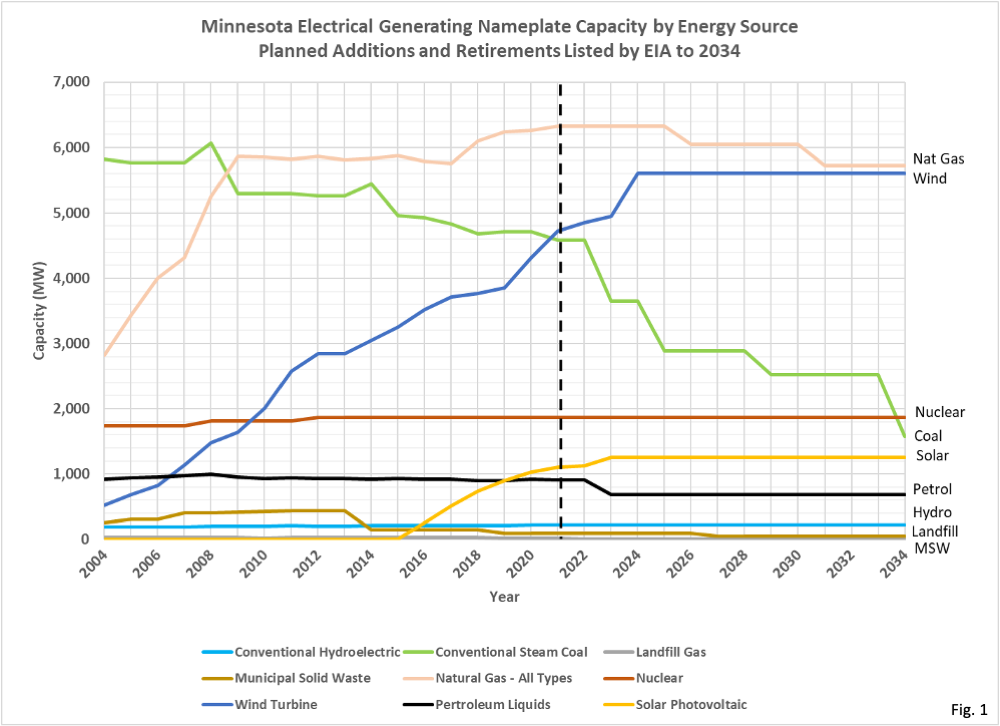
3. Fig. 1, Minnesota Electrical Generating Nameplate Capacity by Energy Source: The US Energy Information Agency (EIA) Form 860 lists data on individual electrical facilities, including nameplate rated capacity of operational plants as well as planned retirements and additions (https://www.eia.gov/electricity/data/eia860M/). This chart summarizes all Minnesota electrical generating facilities that are classified as public utilities or independent power producers. Industrial power generating plants are excluded. Planned retirements as listed in Form 860 data are displayed out to 2034. Planned additions are only included in Form 860 data through 2024. It is unknown how complete the list of either planned retirements or additions is. Capacity is listed in Megawatts, which is the nominal rated power output.
4. In Fig. 1 we note that coal fired generating plants are shown as operational through 2034, although press reports indicate that all coal plants are intended to be retired by 2030. Large increases in wind capacity are planned, especially in 2024, while the listed additions in solar capacity are much smaller. On the current trajectory the nameplate rating of wind power in Minnesota will exceed natural gas in 2025 or 2026. We note several planned retirements of natural gas and petroleum facilities as well. The big tests will be at the end of 2023 and at the end of 2025, when two Sherco 765.3 MW coal-fired generators will be retired. It appears unlikely that the equivalent wind and solar replacement nameplate capacity will be built by these dates, even ignoring the intermittent nature of wind and solar power.
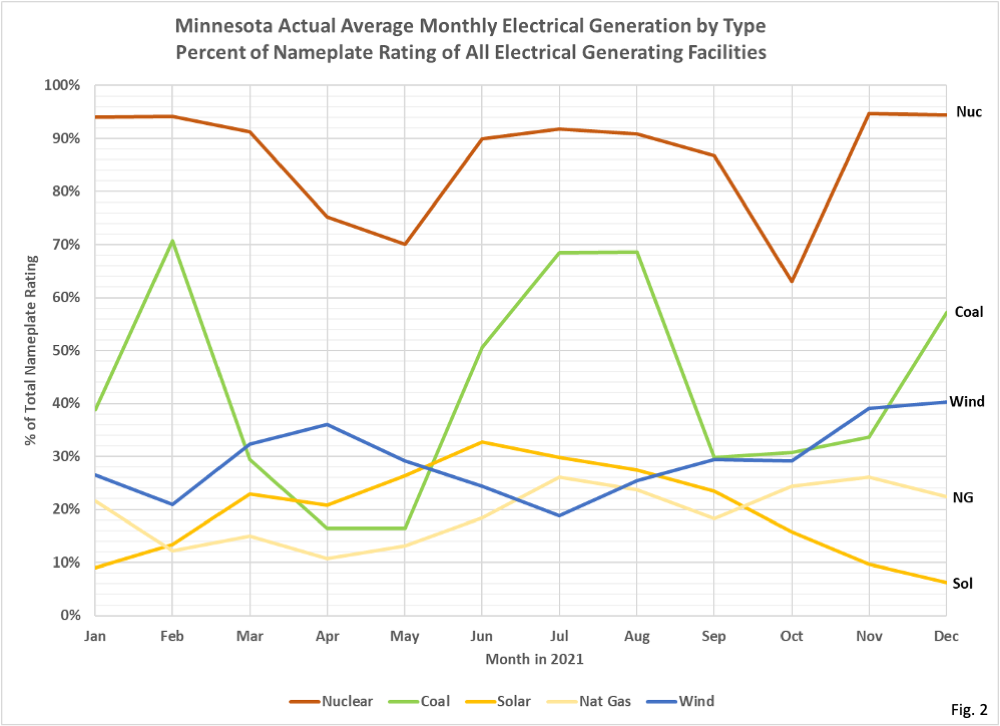
5. Fig. 2, Minnesota Actual Average Monthly Electrical Generation by Type: Data from EIA Form 923 provides data on monthly electrical output from each generating plant, available here: https://www.eia.gov/electricity/data/eia923/. Monthly power generation is provided as the total Megawatt-hours of power output each month. We summed the monthly total electrical generation by source. We then took the rated capacity in Fig. 1 and multiplied by the number of hours in each month to calculate the total MW-hours capacity for each plant. We then summed all of the nameplate monthly capacities. Dividing total generation by total nameplate capacity gives us the percent of capacity generated each month. Note that these percentages are monthly totals. Generating percentages on a daily or hourly basis would be much different, and much more variable.
6. We note that wind and solar are basically not generating to the extent of their capacities at any time. Nuclear power is generally operated at constant power at or very near its design capacity, except for maintenance or refueling shutdowns. This leaves coal and natural gas facilities to be ramped up and down as needed to maintain a stable electrical grid. Coal output shows surprising month to month variations. The Allen King plant is idled several months every year, and the Sherco plant output also varied greatly each month.
7. It seems surprising that the overall utilization of natural gas is as low as it is. However, it is important to remember that these are monthly averages, and there are surely many time periods when total natural gas output is a large percentage of capacity. We don’t have the data to calculate what these peak outputs are, but as coal plants are retired these periods of high natural gas power demand are when the risk of rolling blackouts will occur.
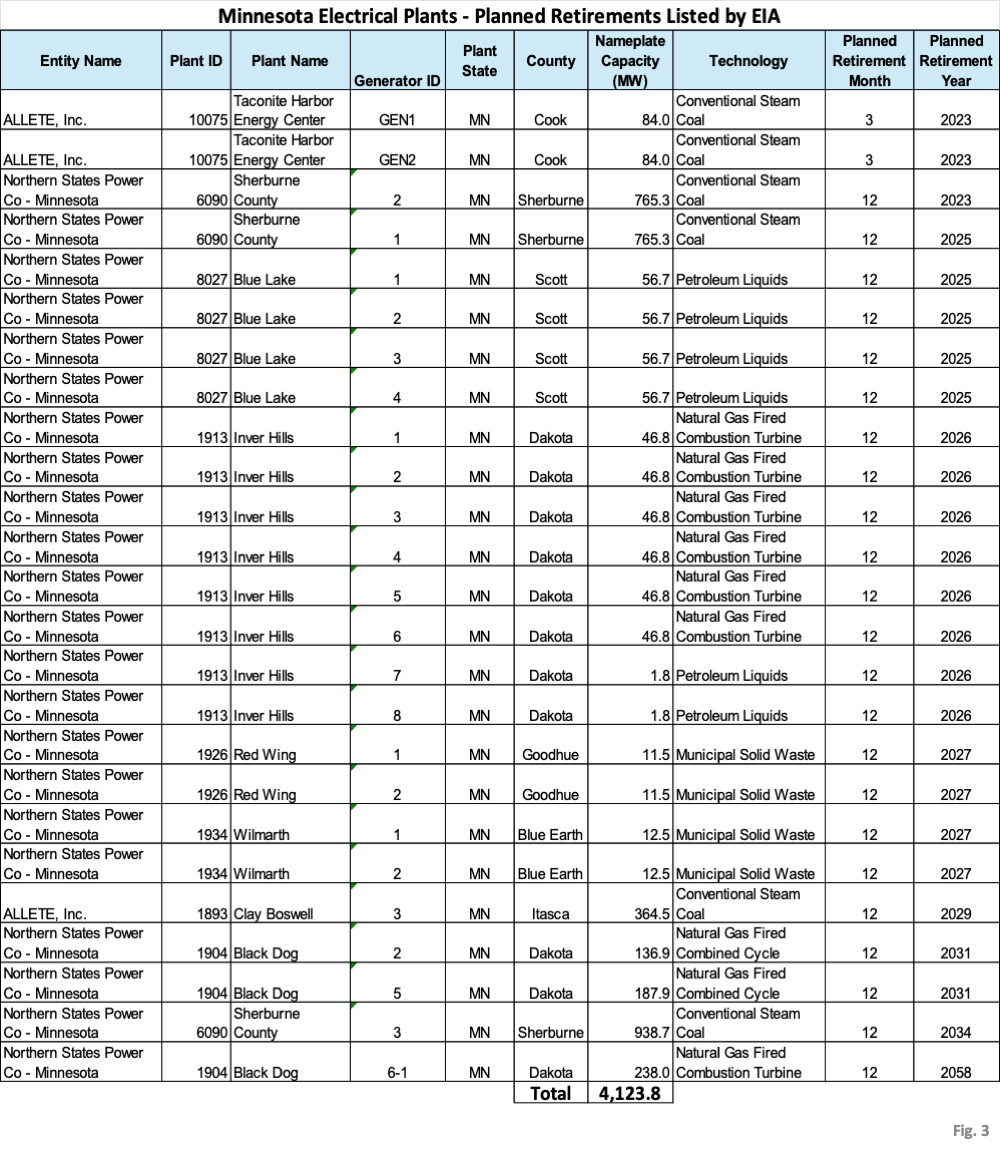
8. Fig. 3, Planned Retirements of Minnesota Electrical Plants: This table summarizes the electrical plant retirements listed in the data table for EIA Form 860. A total of 933.3 MW of generating capacity is listed as scheduled for retirement in 2023, notably the Sherco Generator No. 2 in December 2023. Another 992.1 MW of generating capacity is scheduled for retirement in 2025.
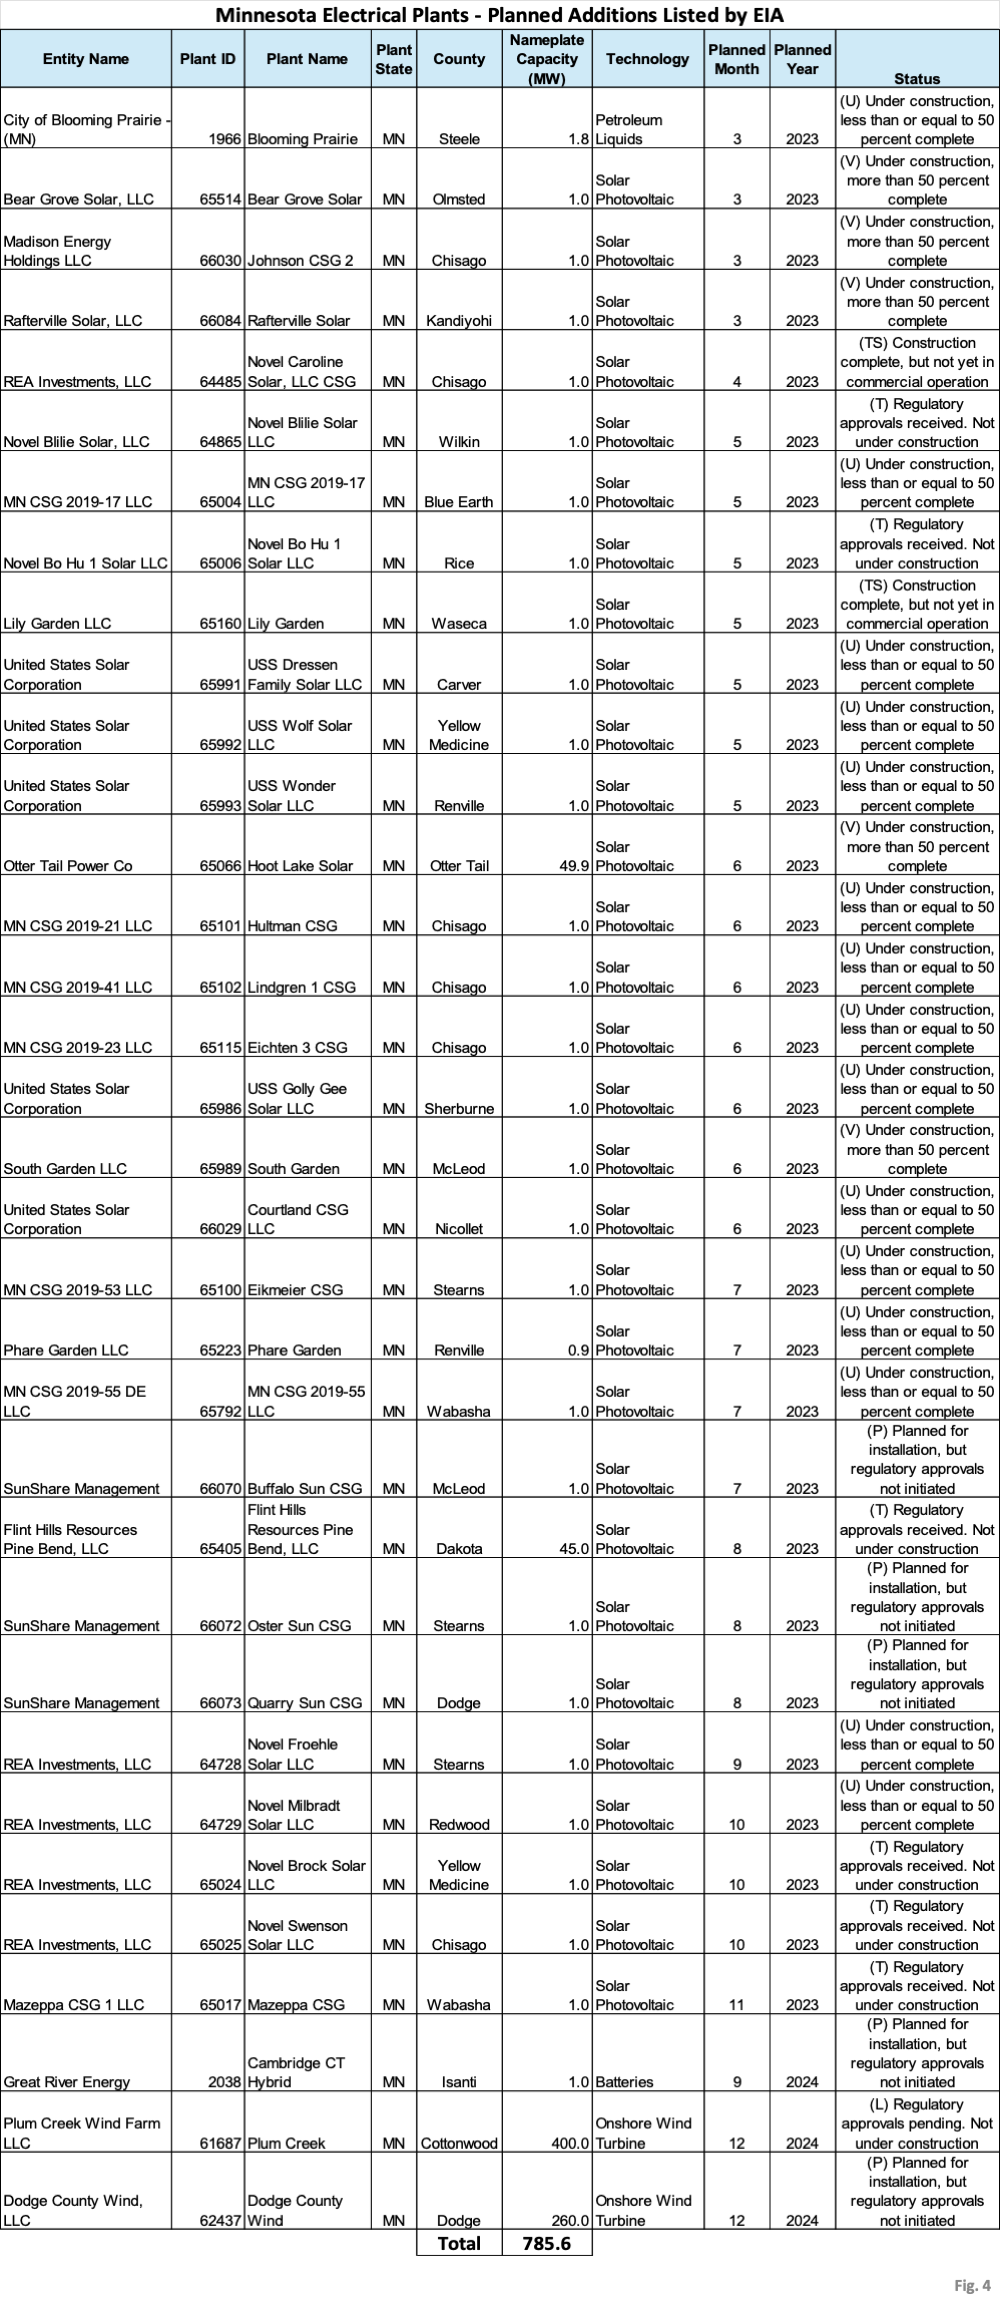
9. Fig. 4, Minnesota Electrical Plants, Planned Additions: The data table from EIA Form 860 includes a list of planned generating plants. As of January 2023, a total of 122.8 MW of solar power and 1.8 MW of petroleum power are planned for installation in 2023, compared to planned retirements of 933.3 MW in 2023. This results in a net reduction of 808.7 MW of generating capacity in 2023. Minnesota is not only losing total generating capacity, but we are also trading dispatchable energy sources for intermittent energy sources. Rather than adding backup capacity as we become reliant on intermittent energy sources, we are reducing backup capacity.

The state of South Australia is attempting to achieve 100% renewable energy and is encountering tremendous issues with reliability. The state of South Australia is approx 379k square miles with a population of 1.8million which is slightly below the population density of Wyoming. Minnesota has 5.7m people with 87k square miles – Minnesota’s population density is 13x of South Australia. South Australia is also at 34S latitude and has a very mild climate. Minnesota has very cold winters which corresponds to the time of year that wind and solar produce less than 20% of capacity.
South australia is probably the most favorable environment to achieve 100% from wind and solar – yet they cant achieve it – not reliably. Minnesota due to the higher population density and much harsher winter is going to require a minimum of 50x more than SA.
During the Texas freeze fiasco of Feb 2021, the electric production from wind dropped 90%+ for 4 days – Across the entire North American continent . Not a single proponent will admit to the failure of wind Across the entire North American Continent for those 4 days. An additional wind drought of approx 60%-70% lasted a total of 11 days during that Feb 2021 freeze.
I downloaded the American Experiment paper some time ago. Interesting and scary stuff. How do “they” expect to create the needed energy with these green things?
climate Etc @ Judith curry dot com has been running a very good series of articles on the engineering hurdles that have to be overcome in order for renewables to power a grid. Renewables suffer from 3 major defects/deficiencies in maintaining a functional electric grid
1) the very well known problem of hours and days without wind or sunshine (including snow covering the solar panels)
2) The well known short term fluctuations in wind and solar – volatility of the wind/ gustiness, etc , for solar clouds coming and going.
3) the need to maintain a very constant frequency as close as possible to 60.00 mhz. + or – .2 – greater fluctuation can short circuit the grid. needing some for of inertia in the electric generation to maintain that frequency.
The series of articles delve deeply into 2&3.
The climate activists pretend issue number 1 can be easily overcome with “backup storage” though conveniently ignoring storage requirements greater the 4-6 hours – as if the wind is always blowing somewhere.
Climate activists completely ignore issues 2 & 3
“The climate activists pretend issue number 1 can be easily overcome with “backup storage” though conveniently ignoring storage requirements greater the 4-6 hours – as if the wind is always blowing somewhere.
Climate activists completely ignore issues 2 & 3”
The truth of the matter is climate activist want you to die. To them a shortage power is a plus not a negative.
Two ideas I have read in the pass come to mind when reading your recent postings on the recent bank failure and green energy. One by Roubini who stated in the housing crisis in 2008 – recessions happen when too much capital goes to non – productive things, the economy needs a reset.
One recent by Victor Davis Hanson in an article titled Are We The Byzantines?
“America prints rather than makes money, as its banks totter near bankruptcy.”