The point of this series is to elucidate the ludicrous nonsense promulgated by Minnesota’s lunatic DFL in the bill requiring that Minnesota get all electricity from renewables in a few short years. This insanity is heightened by a push to force everything to be electrified. This bill should be called the Unaffordable Energy Blackout Bill, because it will cause the price of electricity to be multiples of its current price, if it is available at all. By the time most Minnesotans figure out what has happened, it will too late and will take years to move back to reliable and less expensive energy sources.
 Dave’s notes:
1. A recent post by the Center of the American Experiment (https://www.americanexperiment.org/the-natural-gas-ban-bill-gets-a-hearing-in-the-house-next-week/) discusses a new bill working its way through the Minnesota legislature. House File 772 (https://www.revisor.mn.gov/bills/text.php?number=HF772&version=2&session=ls93&session_year=2023&session_number=0) states the Commissioner of the Department of Labor and Industry “shall consider amendments to the model energy codes that mitigate the impact of climate change and reduce greenhouse gas emissions by increasing and optimizing energy efficiency and improving resiliency of new buildings and existing buildings undergoing additions, alterations, and changes of use.” We do not know how this new law would be implemented, but with the general hostility the Walz administration has toward carbon-based fuels we speculate that a moratorium on new natural gas hookups for residential and commercial properties might be the first step in implementing this policy. This legislation, taken to extremes, would allow the forced removal of natural gas furnaces and appliances for any property that is given a building permit for additions or alterations. For today’s analysis, we will assume that there will be a moratorium on new natural gas hookups for new residential and commercial properties starting in 2026. New properties would then be forced to use electric appliances, and presumably heat pumps and electric resistance for heating.
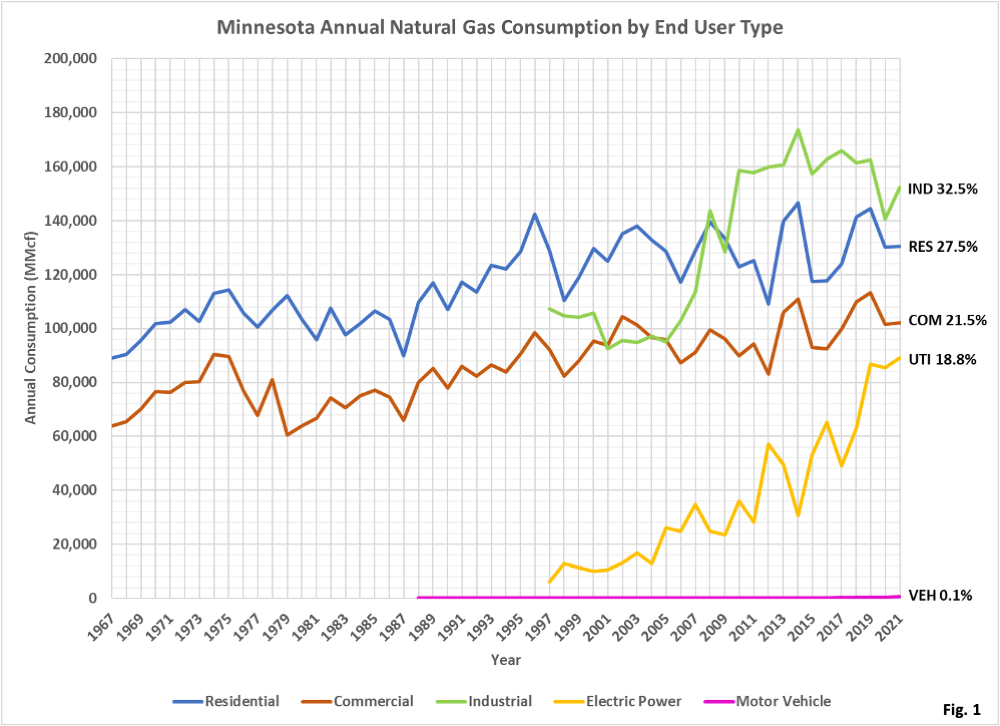
2. Fig. 1, Minnesota Annual Natural Gas Consumption by End User Type: This chart includes total natural gas use for residential and commercial users since 1967, and industrial and power utility users since 1997. Residential is defined as private dwellings, including apartments. Commercial is defined as non-manufacturing businesses including retail stores, service enterprises, hotels, restaurants, and government agencies. Our premise, that new natural hookups will be banned starting in 2026, works well for residential and commercial end users because we have well-defined trends in new users for these groups. However, the trend in new industrial users is more poorly defined, making it problematic for us to predict how many new natural gas hookups might be banned in the future. For this reason, we are restricting this analysis to residential and commercial users only.
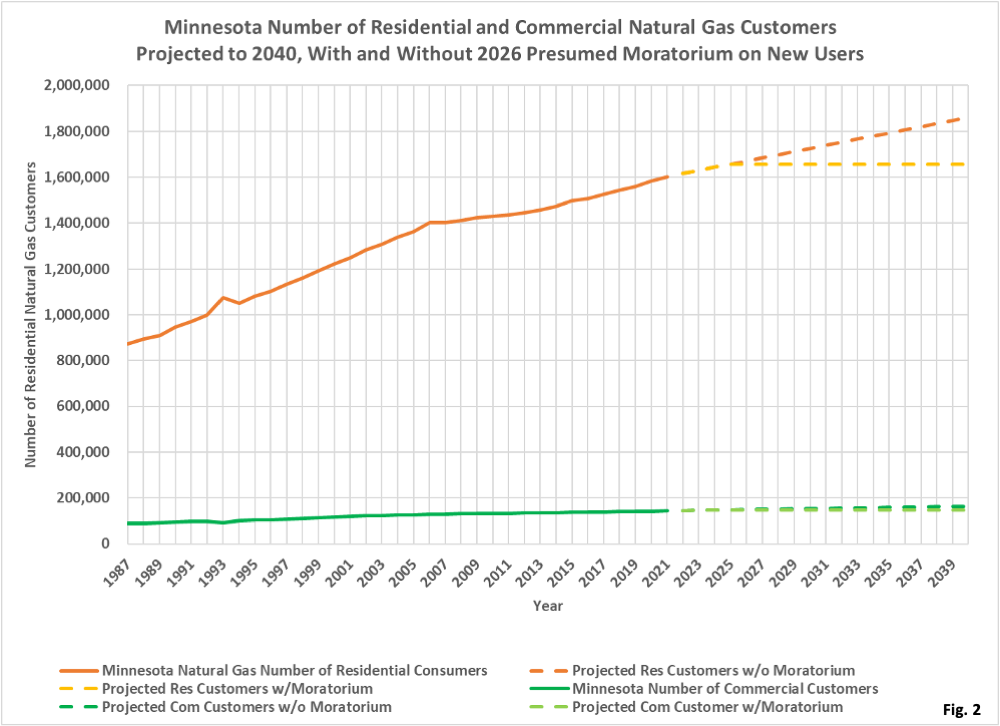
3. Fig. 2, Number of Minnesota Residential and Commercial Natural Gas Users, Projected to 2040 With and Without a 2026 Moratorium on New Users: The US Energy Information Agency (EIA) provides data on the number of natural gas users by sector and by state (https://www.eia.gov/dnav/ng/ng_cons_num_a_EPG0_VN3_Count_a.htm). We downloaded historical data on the number of natural gas consumers for Minnesota from 1987 to 2021. We then performed a linear regression on the number of users from 2006-2021, and projected these trends to 2040, shown as the dashed orange and dark green lines. Our analysis assumes a moratorium on new gas users in enacted in 2026, shown as god and light green dashed lines. In 2040, this model predicts that 203,825 residential users that might have used natural gas would be forced to use electric appliances and heat pumps, and 15,640 commercial users would be forced to use electric rather than natural gas.
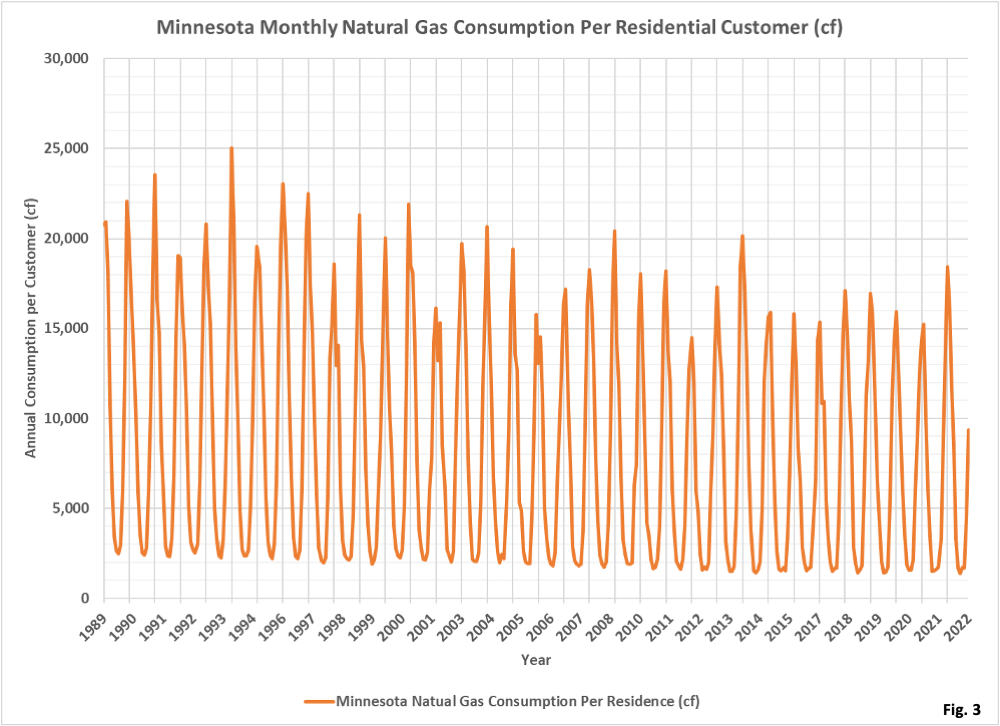
4. Fig. 3, Minnesota Monthly Natural Gas Consumption per Residential User (cubic feet): Data on the consumption of natural gas is available from the EIA (https://www.eia.gov/dnav/ng/ng_cons_sum_a_EPG0_vgt_mmcf_m.htm). This data is total consumption statewide for each end user type, in million cubic feet (MMcf). We divided the total gas consumption by the number of users each year from Fig. 2 to obtain the average monthly gas use for each residence. We note that the minimum gas consumption occurs in the summer, and appears to be gradually declining over the years. We assume that this gas is used mainly for cooking, water heaters, and clothes dryers. We calculated the summer (June, July, and August) gas consumption each year, and assume that this appliance use occurs at a constant rate throughout the year. The remainder of the gas use is then assumed to be for heating. The peak gas consumption is obviously for heating and is also on a declining trend.
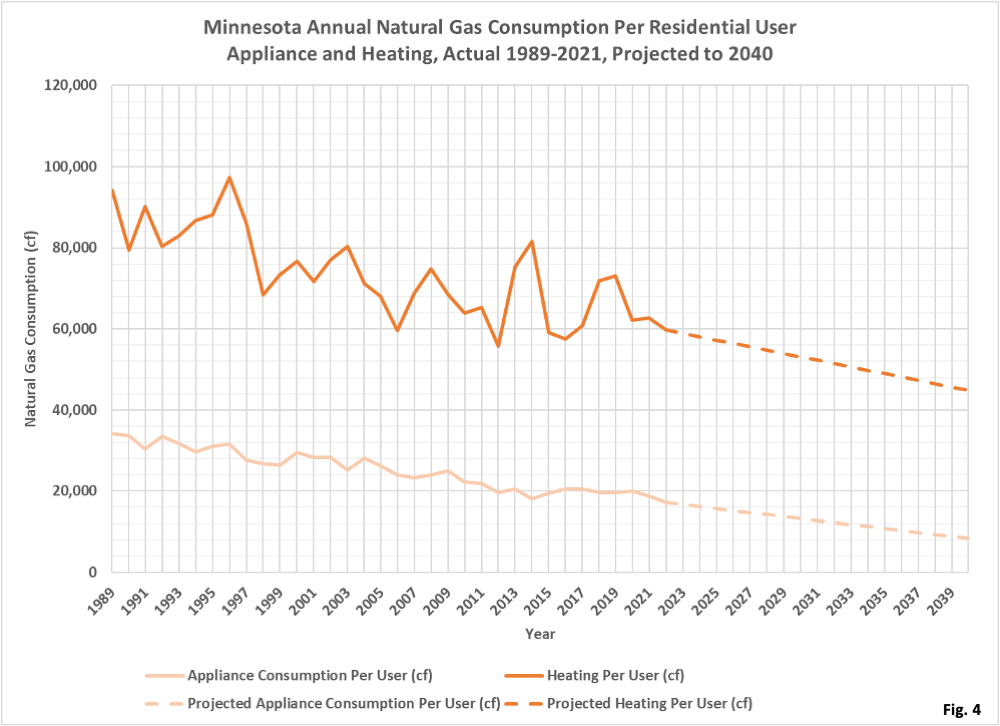
5. Fig. 4, Minnesota Annual Natural Gas Consumption Per Residential User, Appliance and Heating: We performed a linear regression on the period of 1989 to 2021 for both appliance gas consumption and heating gas consumption. We found very strong and consistent declining trends for both appliances and for heating, and projected these trends forward to 2040. Presumably appliance efficiency and home insulation effectiveness have been improving over the years.
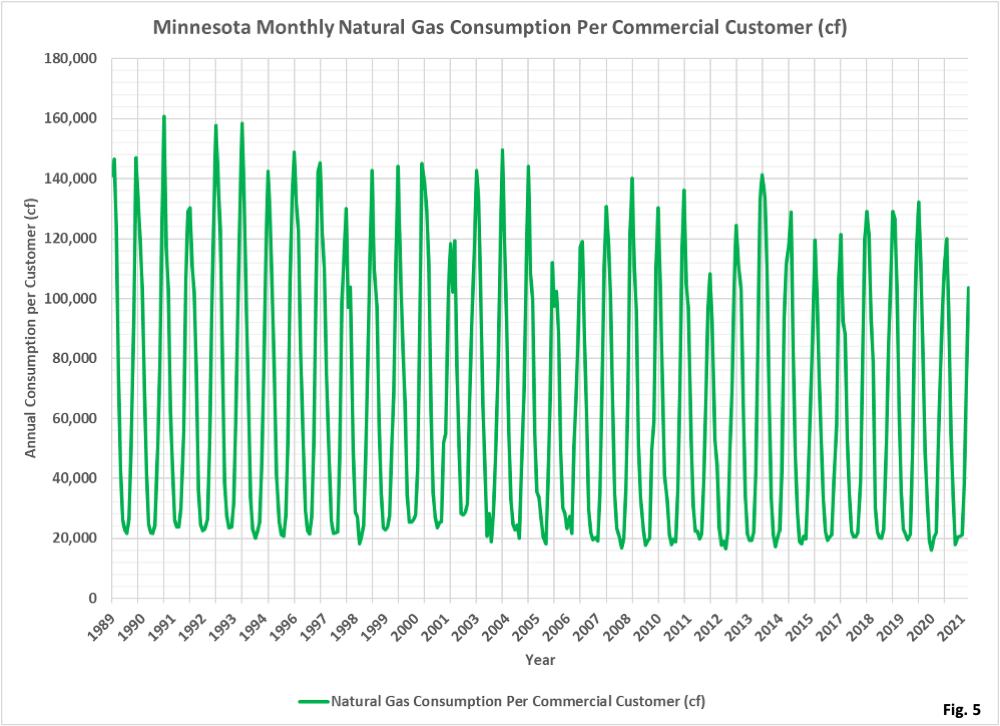
6. Fig. 5, Minnesota Monthly Natural Gas Consumption Per Commercial Customer (cf): Similar to to residential data in Fig. 3, we divided the total annual commercial natural gas consumption by the total number of commercial customers each year. We note that the amount of natural gas consumption is higher for commercial customers than for residential customers in Fig. 3. We see that there appears to be a slight declining trend, both for the summer appliance consumption and for overall consumption. As we did for residential consumption, we will assume that the minimum gas consumption in June, July, and August are for appliance uses, and occur at a constant rate throughout the year. The remainder of the monthly gas consumption is then used for heating.
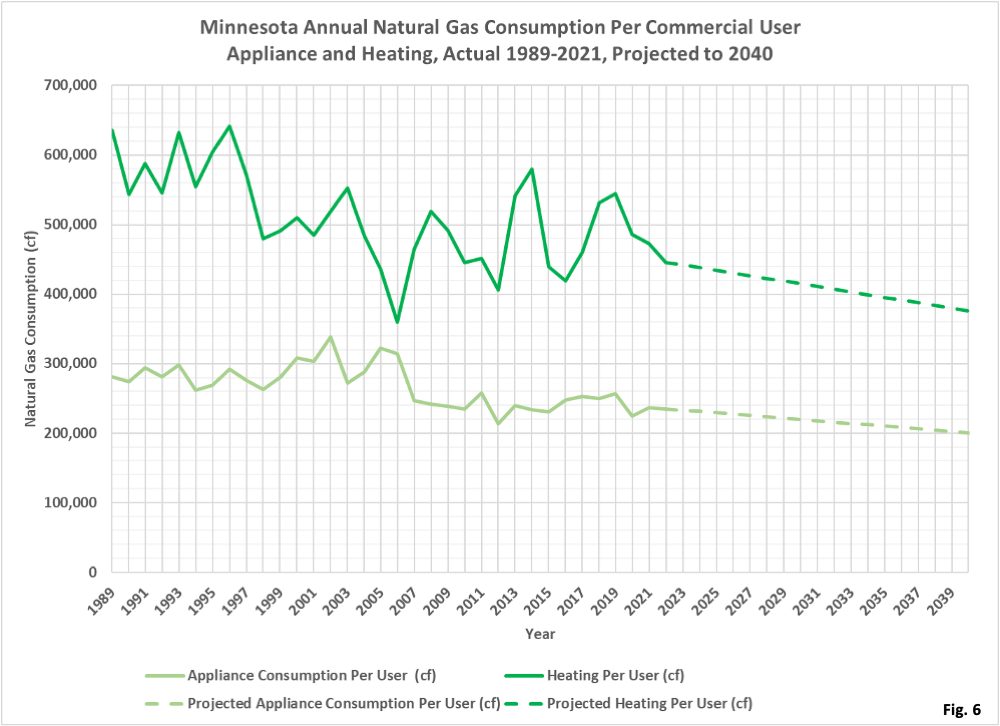
7. Fig. 6, Minnesota Annual Natural Gas Consumption Per Commercial User, Appliance and Heating: As we did for residential gas use in Fig. 4, we performed a linear regression on the appliance consumption based on summer months gas use, and on the heating consumption, and extended each trend forward to 2040.
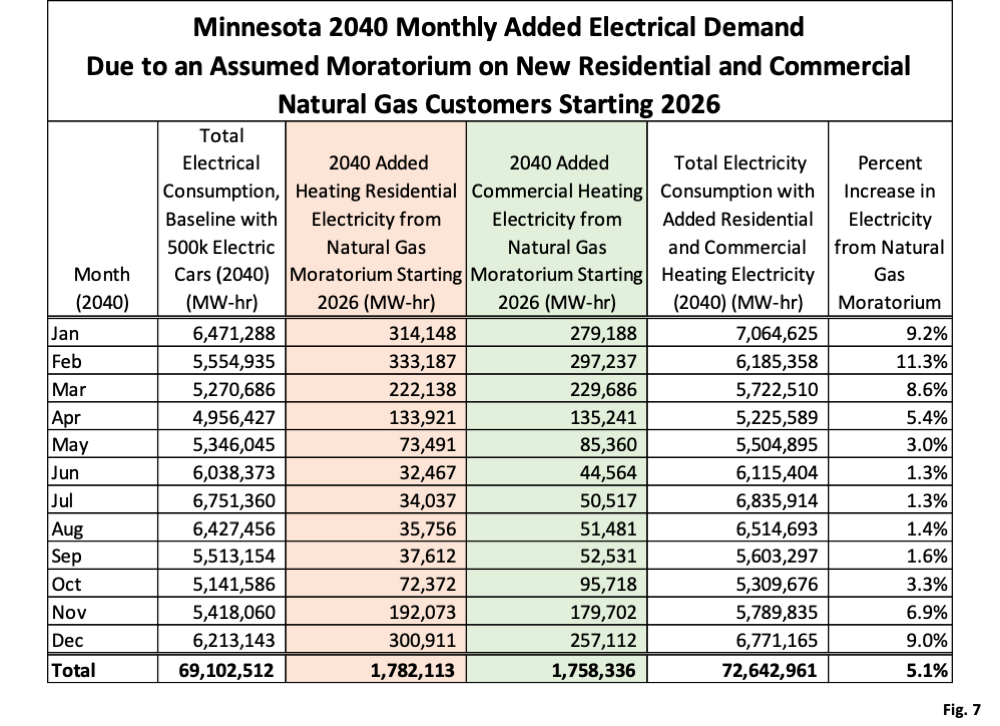
8. Fig. 7, Minnesota 2040 Monthly Added Electrical Demand Due to an Assumed Moratorium on New Residential and Commercial Natural Gas Customers Starting 2026: Here we finally to get to the point of this entire exercise, which is to calculate the amount of added electrical demand that would occur in 2040 by forcing all new residential and commercial buildings to use electrical appliances and electrical heating starting in 2026. We assumed that the gas used for appliances would be replaced by electric resistance heating, on a BTU-for-BTU basis. We also assumed that 80% of the natural gas for used for heating would be replaced by electric heat pumps with a Coefficient of Performance of 3, meaning that 1 watts of input electrical power yields 3 watts of building heat. Because heat pumps can lose effectiveness at the very cold temperatures in winter in Minnesota, we assumed that the remaining 20% of natural gas used for heating would be replaced by electrical resistance heating on a BTU-for-BTU basis. Natural gas has a heat of combustion of approximately 1020 BTU per standard cubic foot, and one BTU/hr equals 0.2931 Watt. By multiplying the hourly average gas consumption by 1020 BTU/scf and 0.2931 watt/BTU, we can then calculate watts/hour. We then convert this to MW-hr over the course of the year, giving us the total amount of added electrical demand.
9. The baseline electrical demand in 2040 with 500k electric cars comes from Minnesota’s New Energy Insanity Part 3 (https://healthy-skeptic.com/2023/02/28/minnesotas-new-energy-insanity-part-3/). In Fig. 6 of Part 3 we had computed a total electrical demand in 2040 of 69,105,512 MW-hr for Minnesota. The monthly consumption amounts for each month are shown in the second column. Next, in the column highlighted pink, we have the monthly added electrical consumption caused by the natural gas moratorium for residential customers. As we would expect, a majority of the electrical consumption occurs in winter due to heating requirements. In the column highlighted green we have the monthly added electrical demand due to the moratorium for commercial customers. Finally, in the last two white columns, we have the new total monthly electrical demand totals in 2040, and the percent increase over the original baseline. The highest increase is only 11.3% in February, but of course during this time of year solar panels are very ineffective in Minnesota, so we would be completely dependent on wind power to provide electricity for heating, plus a small amount of hydroelectric and biomass energy.
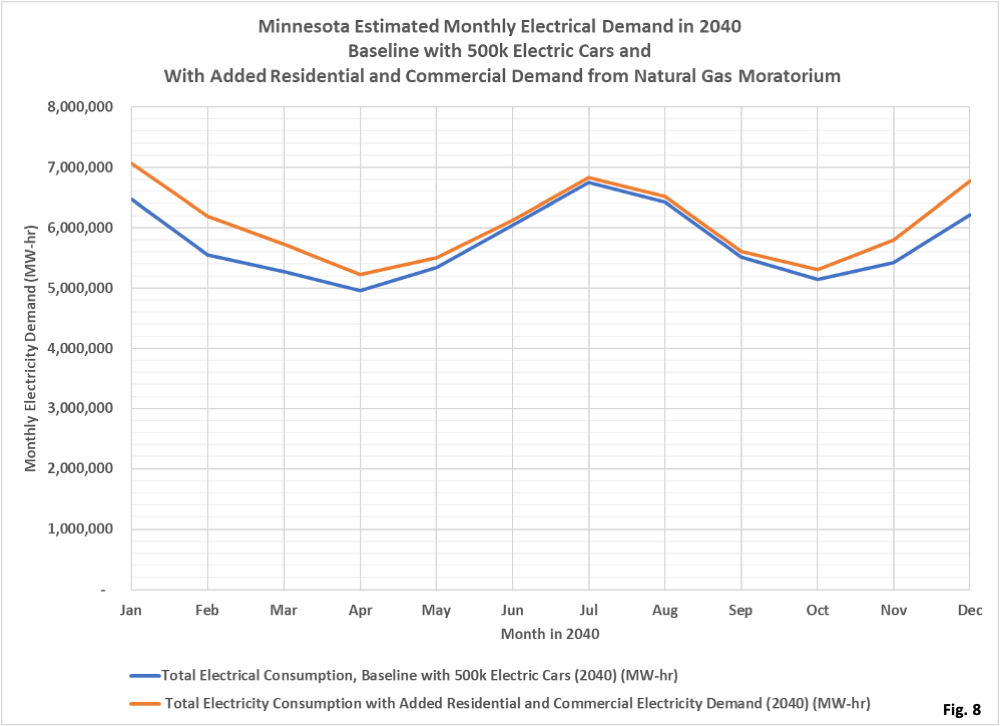
Fig. 8, Minnesota Estimated Electrical Demand in 2040, Baseline with 500k Electric Cars and with Added Residential and Commercial Electrical Demand: This chart displays the baseline and final electrical demand from Fig. 7. The peaks in summer and winter, with lower demand in spring and fill are clearly visible. This matches with the daily electrical demand we displayed in Fig. 3 of Minnesota’s New Energy Insanity Part 3 (https://healthy-skeptic.com/2023/02/28/minnesotas-new-energy-insanity-part-3/). Any energy system that would replace Minnesota’s current mix of sources will need to match these peak demands. Arguably, the winter peak is more critical, since disruptions in electricity in extreme cold weather can be a safety hazard and well as risking broken water pipes. Rolling blackouts can perhaps be tolerated more easily in the summer, but a modern civilization really should not be subjected to periodic loss of electricity.
