I assume it is apparent to everyone now why we refer this new law as insane. If we are to ensure that Minnesotans have adequate electricity in the future, the bill would require the building of either additional generation capacity or battery storage or a combination that is literally impossible and would cost trillions of dollars and make electricity unaffordable for most Minnesotans. Now since the state has gone full insane like California, New York, Illinois, et al, it may be that Little Timmy assumes that we will keep losing population and businesses at a record rate to states that actually function, so maybe electric demand will be far lower than the current level. Read Dave’s notes in full.
Let me reiterate. There are two choices. Build enough renewable generating capacity, with cushion, to always meet expected peak electricity demand, or, build a ton of battery storage to fill in when the demand is over your actual generation capability; or some combination. Either one, as Part 3 and this Part 4 demonstrate, is literally financially impossible. It is also physically and environmentally impossible. But that means nothing to the airheads in our legislature.
Note especially that the document used to generate cost estimates for various electricity sources is absurdly optimistic about the cost of renewables. In reality they will cost far more. Note too that exporting surplus power is not going to happen. We have surpluses at the same time everyone else does and deficits when everyone else does. And you have to assume that every state will have the same insane energy policy as Minnesota by then, so they all will have surpluses or massive battery storage. No one will buy the surplus electricity we are creating by avoiding constant blackouts. It is just wasted.
 Dave’s notes:
1. In Minnesota’s Energy Insanity Part 1 (link) we started looking at Minnesota’s new carbon-free energy law, and how it will create a reliance on wind and solar energy sources for electricity in 2040. In Minnesota’s Energy Insanity Part 2 (link) we modelled the variability of wind and solar power, and also the variability of demand, using hourly data from the Midcontinent Independent System Operator (MISO) region. This variability in demand and generation creates highly variable electricity surpluses and deficits, both on a short-term hourly basis and long-term over the course of the year. In Minnesota’s Energy Insanity Part 3 we estimated what the 2040 annual energy cost might be for this baseline scenario, including full battery backup power systems to deal with the energy deficits. We came up with a ridiculous cost of over $70 billion per year, driven by the low wind power available in the summer along with the highest demand of the year.
2. Today in Part 4 we will apply the same basic methodology we used to calculate the electricity surpluses and deficits and costs, but will examine alternate scenarios for energy source mixes in 2040. There are numerous assumptions that went into this analysis, many of which have a dramatic effect on cost. Hopefully the estimates for these scenarios at least bring to light some of the challenges in going to 100% carbon-free electricity, even if the cost estimates are eventually proven to be inaccurate.
3. The biggest risk Minnesota faces may not be energy deficits in 2040, but before 2030, as the last remaining coal-fired power plants are shut down. The three operating units at the Sherco plant in Becker, MN are reported to be scheduled for closure in 2023, 2026, and 2030 (link). This same news report lists 2028 as the closure date of the Allen S. King coal plant in Oak Park Heights, MN. The only other remaining coal-fired power plant in Minnesota is the Boswell Energy Center in Itasca County, with two of its four units shut down in 2018 and total shut down scheduled for 2035 (link). The existing nuclear power plants appear to be typically operating at near maximum capacity, but we have not yet done a detailed analysis of excess capacity there may be in the existing natural gas power plants. The electric grid will likely be under pressure when the large Sherco units are shut down in 2023 and 2026.
4. In the data for each of the scenarios we calculate the net cost per MW-hr and net cost per kw-hr, as well as the total net cost. For reference, the EIA states that the average US residential retail electric price in November 2022 was $0.1564 per kw-hr (link). Our cost data is the EIA’s cost estimate for new energy sources entering service in 2040, from Table B2 from the EIA document “Levelized Costs of New Generation Sources in the Annual Energy Outlook 2022”, Table B2 (link). Note that this cost data is supposed to reflect the total cost of production but does not include other energy utility company expenses such as overhead or profit. This document predicts that wind and solar energy will be the cheapest available in 2040, cheaper than natural gas and less than half the cost of nuclear or coal. In addition, although batteries are expensive, we are assuming that surplus electricity can be exported, offsetting battery cost. However, it is not clear that large of amounts of power can be exported without large expenditures, such as for power lines, which are not included in the cost estimate. This type of cost data is the source of frequent claims made in the media how carbon-free renewable energy will be cheapest for the consumer, but a lot is riding on this being true. If the claims of being cheaper are incorrect, or there are other unexpected costs that are not included in these estimates, or if the disruptions caused by relying on intermittent power sources proves to be significant, then Minnesota consumers may be in for a surprise.
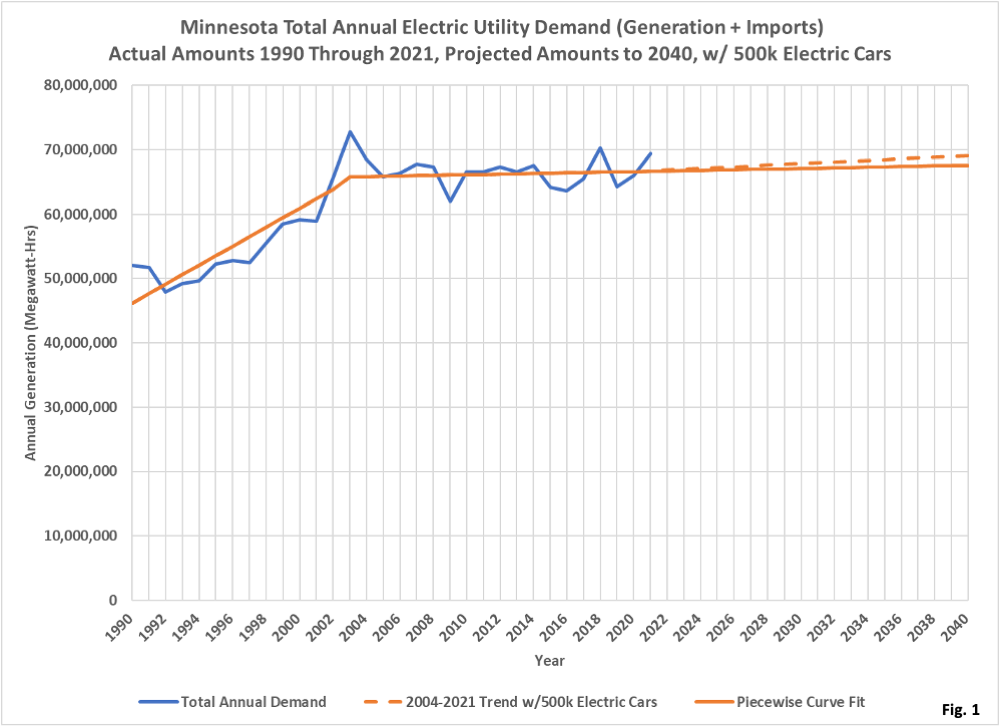
5. Fig. 1, Minnesota Total Annual Electric Utility Demand: This chart displays the actual electrical demand in Minnesota from 1990 to 2021 (blue curve) and two projected demand profiles (red curves). The demand data is obtained from the US Energy Information Agency (EIA) (link). Electricity generation data is found on Tab 5 and import data is on Tab 10, the sum of which is net demand. We evaluated a variety of curve fits for the actual demand data and decided that a piecewise linear fit was most appropriate. A linear regression was performed on the data from 1990 to 2003, and a second linear regression was done for the 2004 to 2021 time period. This second regression was then extended to 2040. We then modelled the impact of adding 500,000 electric cars by 2040. The policy of the Walz administration is that electric cars should make up 20% of all registered cars in Minnesota by 2030 (link). We have estimated that this goal, if achieved, might result in 500,000 electric vehicles in Minnesota in 2040. We further estimate that each electric car will travel 12,5000 miles per year, consuming 0.24 kw-hr per mile. This level of electric car adoption is depicted as a dashed red line, increasing 2040 total electric consumption by 1,500,000 MW-hrs, only 2.2% of 2040 electrical demand. It does not appear that this level of electric car adoption will be a major source of disruption to Minnesota’s power system.
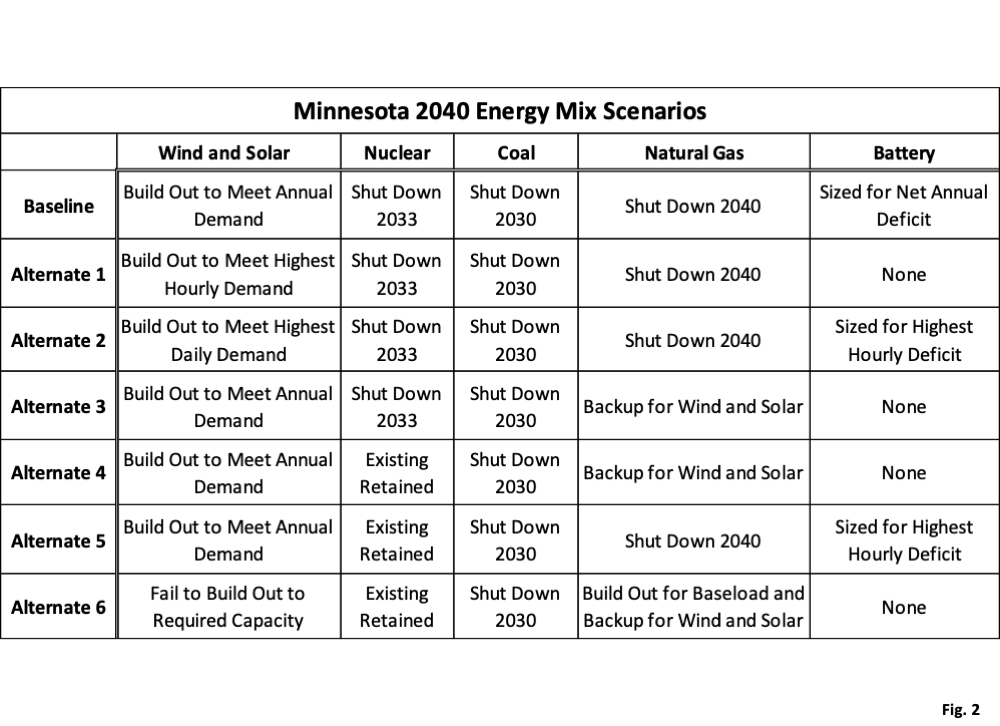
6. Fig. 2, Minnesota 2040 Energy Mix Scenarios: This table summarizes our baseline scenario and six alternate scenarios. For the baseline scenario we have assumed that Minnesota’s new energy law will be followed strictly, and only energy sources listed as ‘eligible energy technologies’ will be used, along with the full amount of battery backup needed to prevent rolling blackouts. For some of the alternate scenarios we have added nuclear and natural gas energy back in. Note that we have not included any margin in the estimates for maintenance downtime, or for production levels above or below our 2022 hourly model.
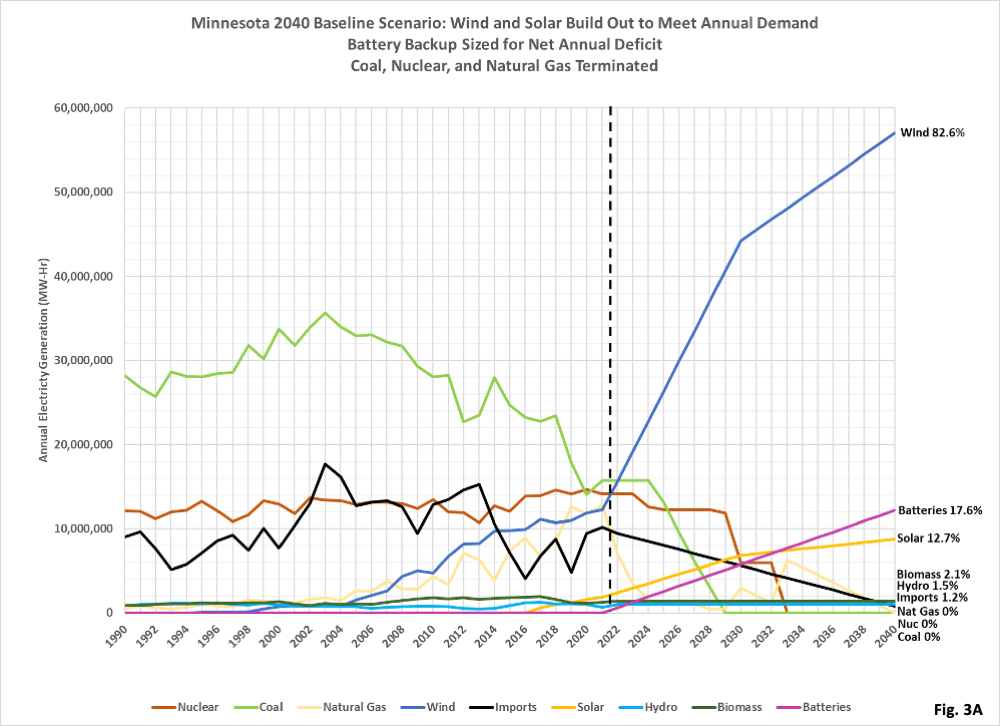
7. Fig. 3A, Minnesota 2040 Baseline Scenario, Wind and Solar Built Out to Meet Annual Demand, Battery Backup Sized for Net Annual Deficit; Coal, Nuclear, and Natural Gas Power Terminated: This chart displays what the power source mix might look like between 2022 and 2040, in response to the new Minnesota carbon-free legislation (link). The new law recognizes only hydroelectric, wind, solar, and biomass as “eligible energy technologies”, explicitly considered to be carbon-free. The new law has provision for continued use of natural gas or other carbon-based energy sources beyond 2040, but requires special approval by the Public Utility Commission, and/or the purchase of renewable energy credits. Nuclear energy is not addressed in the legislation. We have chosen to create our baseline energy mix using only the energy sources specifically approved in the legislation. In addition, we have chosen to assume that hydro and biomass energy sources will remain constant at the 2017-2021 averages, and that the assumed 10% of imported power that is derived from hydro power will continue at a constant rate to 2040. Wind and solar energy are scaled up to supply the total estimated annual power, maintaining the same ratio of wind to solar power that existed in 2021. Because of the intermittent nature of wind and solar power 50% of all hours have a surplus of electricity generation, and 50% of hours have a deficit, as we describe in Minnesota Energy Insanity Part 3. Note that the percentages add up to more than 100%, since the battery percentage is generated by one of the other sources.
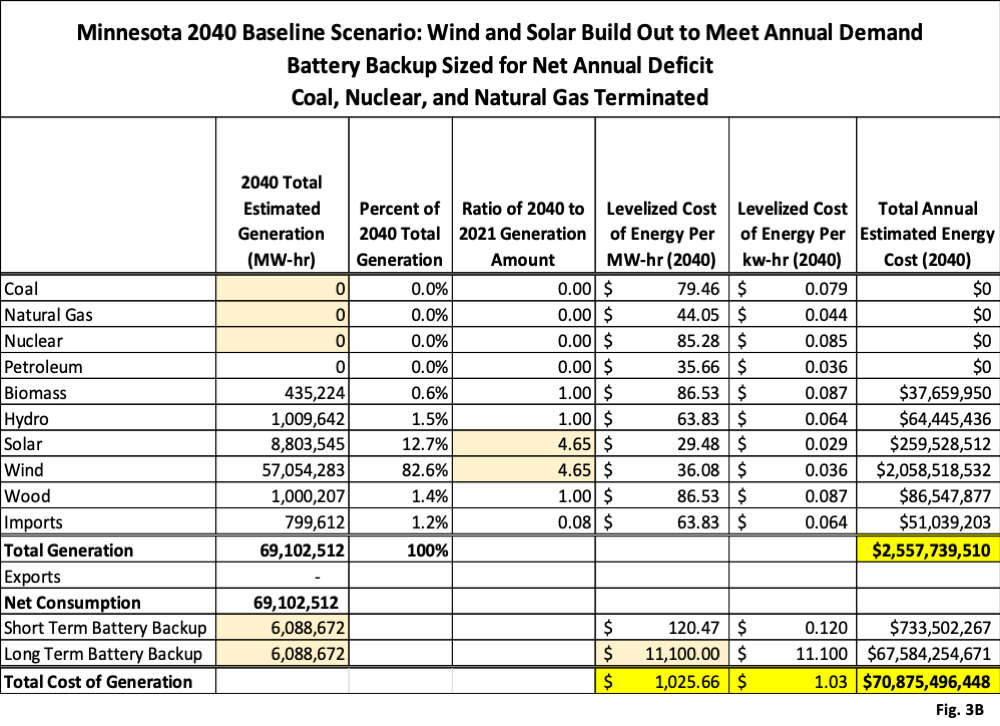
8. Fig. 3B, Minnesota Baseline Scenario 2040 Power Generation and Estimated Cost: This data table displays the estimated 2040 power source mix, as well as the estimated total 2040 cost of power. The key cells are highlighted in light yellow. Note that coal, natural gas, and nuclear power are zero in 2040. Battery power is split evenly between short term (over a period of hours) and long term (over the course of the summer). Data and assumptions used to size the batteries are described in Minnesota’s Energy Insanity Part 3. The ratio of 2040 to 2021 generation amounts are 4.65 for both wind and solar, meaning that total annual generation of wind and solar power generated in 2040 must be 4.65 times actual 2021 generation. Cost data is obtained from the EIA document “Levelized Costs of New Generation Sources in the Annual Energy Outlook 2022”, available here (link). The National Renewable Energy Laboratory (NREL) estimates that the capital cost for battery storage is $333 per kw-hr (link). Applying this capital cost to half of the annual required battery capacity, 6.088 million MW-hr, yields a total capital cost of just over $2 trillion for enough battery capacity to last through the wind power deficit predicted during the summer months, or $11,100 per MW-hr when amortized for 30 years. Applying all of these costs yields a total of $70.875 billion in 2040, driven completely by the long term battery costs required to get through the Minnesota with the wind and solar sizing we chose. The net cost of $1.03 per kw-hr is roughly 6 times the current national average, so clearly the use of batteries to make up for low wind production in the summer is not a viable solution.
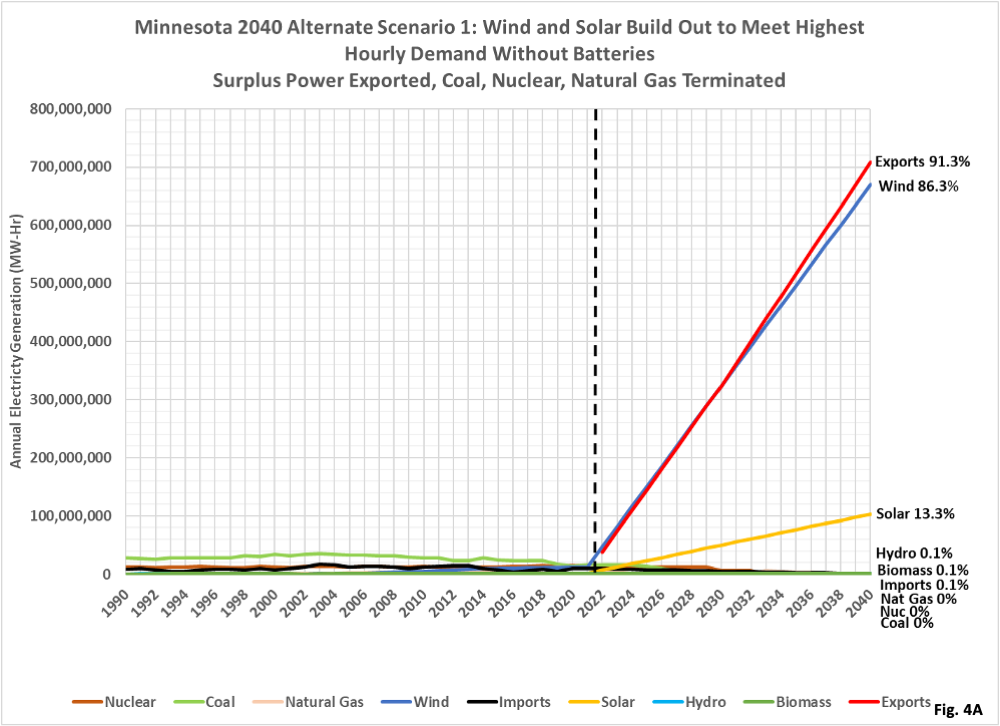
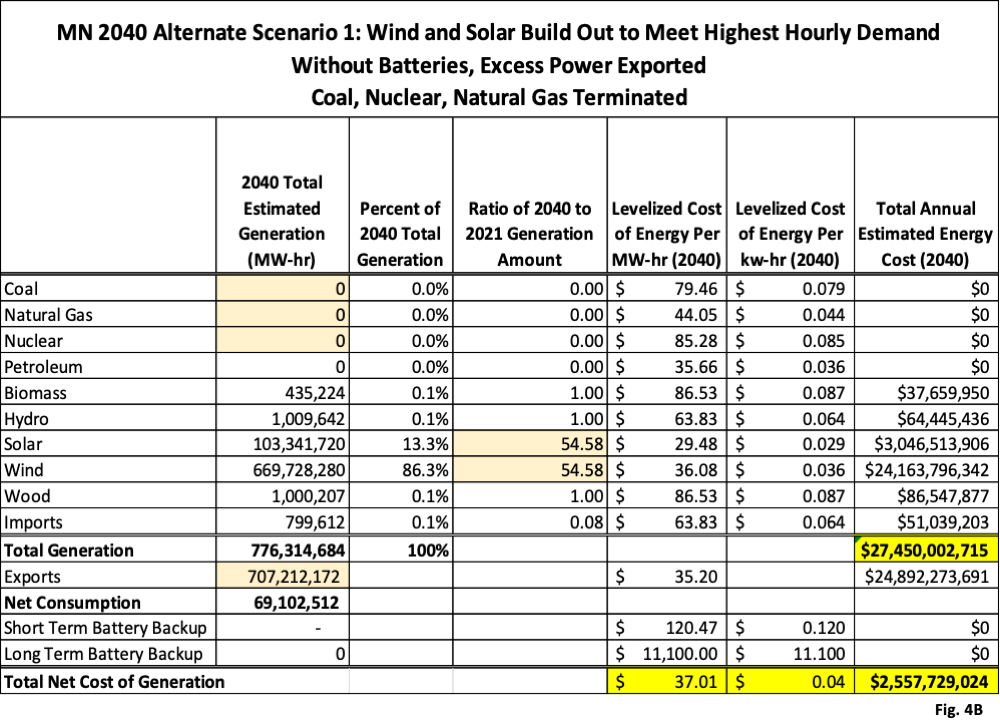
9. Fig. 4A and 4B, Minnesota 2040 Alternate Scenario 1, Wind and Solar Build Out to Meet Highest Hourly Demand Without Need for Batteries, Surplus Power Exported, Coal, Nuclear and Natural Gas Terminated: This scenario displays the result if we attempt to take wind and solar build out to the extreme of eliminating the need for battery backup. For this scenario we scale up wind and solar to a level of 54.58 in times 2021 actual wind and solar output. Note that the great majority of the time this energy source mix would generate a huge surplus of power that would have to be exported, if customers for this much power existed. While this solution eliminates the need to build expensive batteries, we substitute the equally unacceptable problem of requiring a massive buildout of wind and solar power, along with the power lines needed to export the surplus power. It seems clear that such a massive buildout of intermittent power sources will be unsatisfactory. The net cost of only $0.04 per kw-hr is very cheap but is only theoretically possible if the huge amounts of excess power are successfully exported.
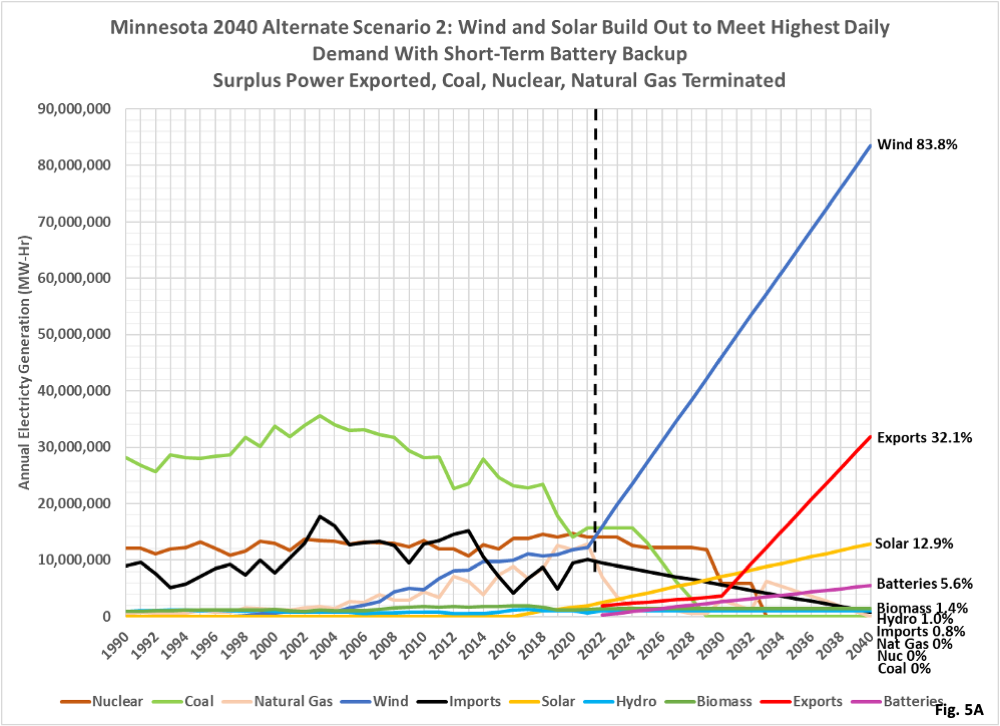
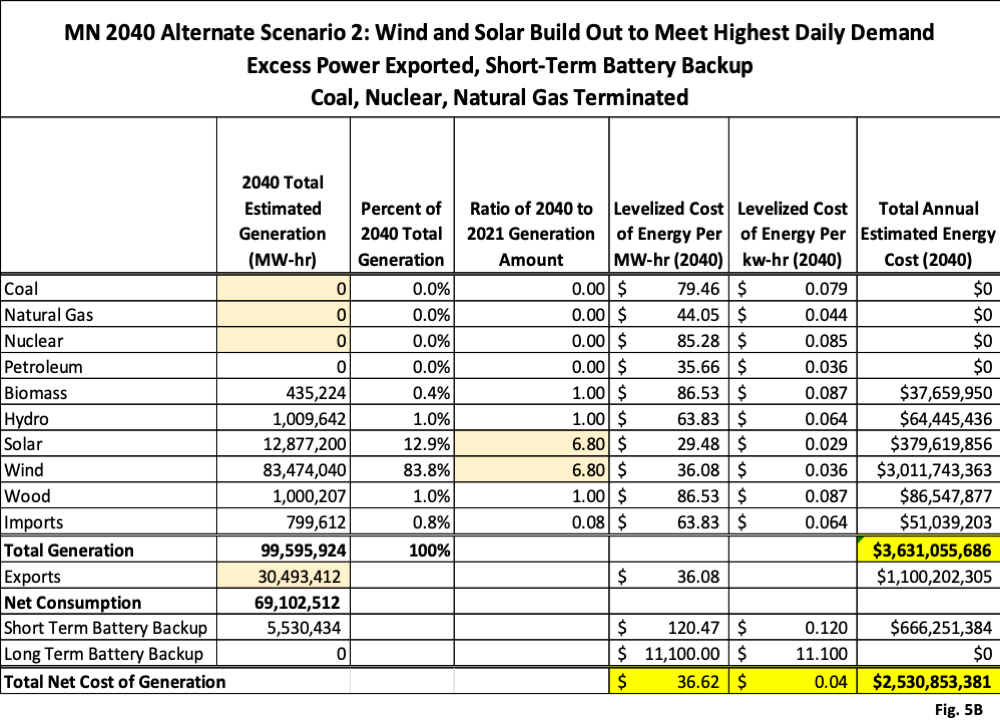
10. Fig. 5A and 5B, Minnesota 2040 Alternate Scenario 2, Wind and Solar Build Out to Meet Highest Daily Demand with Short-Term Battery Backup, Surplus Power Exported; Coal, Nuclear, and Natural Gas Terminated: This scenario presents a middle ground between the Baseline and Alternate 1 scenarios. In this scenario we have sized wind and solar generation to meet the total demand on the highest demand day of the year. In this scenario, on this highest demand day, we will still have half the hours of the day to have an energy surplus and half the hours to have an energy deficit. Other days besides this highest demand day would also have hours with an energy deficit. We sized short-term batteries to meet these estimated hourly deficits. Because the batteries only need to meet short-term demand, they are smaller than those estimated in the Baseline Scenario, and because they are charged and recharged on a daily basis they are more cost effective on a MW-hr basis, since we have more energy flowing through the batteries over the course of the year. In Fig. 5B note that wind and solar need to be built out to 6.8 times the 2021 actual output, as compared to 4.65 times 2021 in the Baseline Scenario (sized for annual demand), and 54.58 times for the Alternate Scenario 1 (sized for highest hourly demand). Exports are sizeable, equal to almost half of Minnesota’s annual demand. This level of exports would likely require major cost and effort to accomplish. The net total cost is $0.04 per kw-hr is very cheap and is totally dependent on the low cost of wind and solar power, and the ability to export surplus energy.
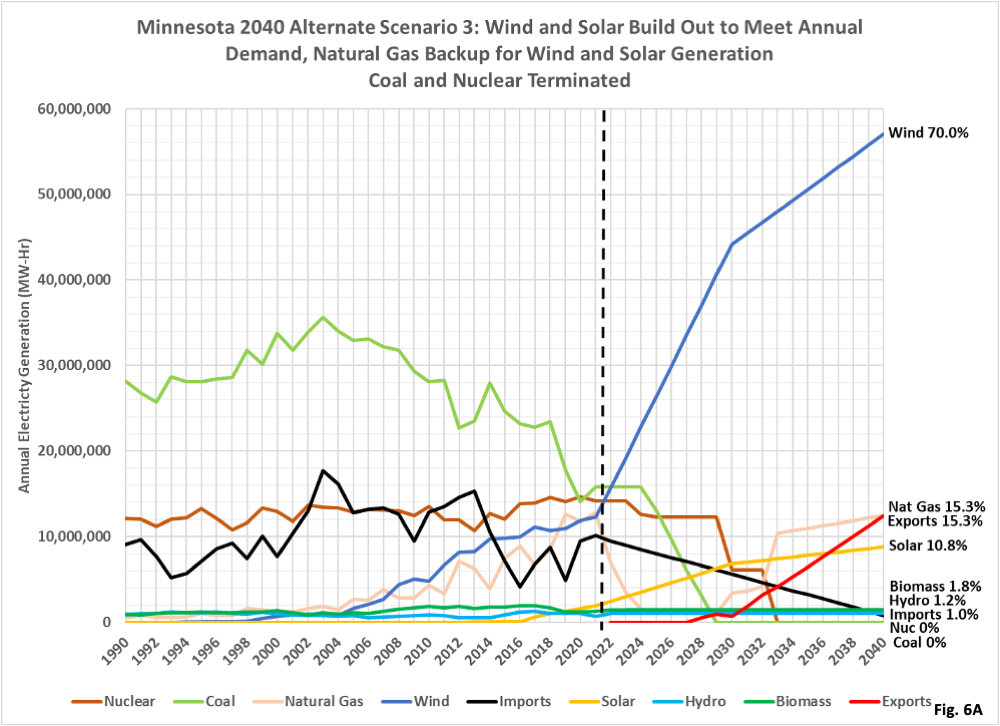
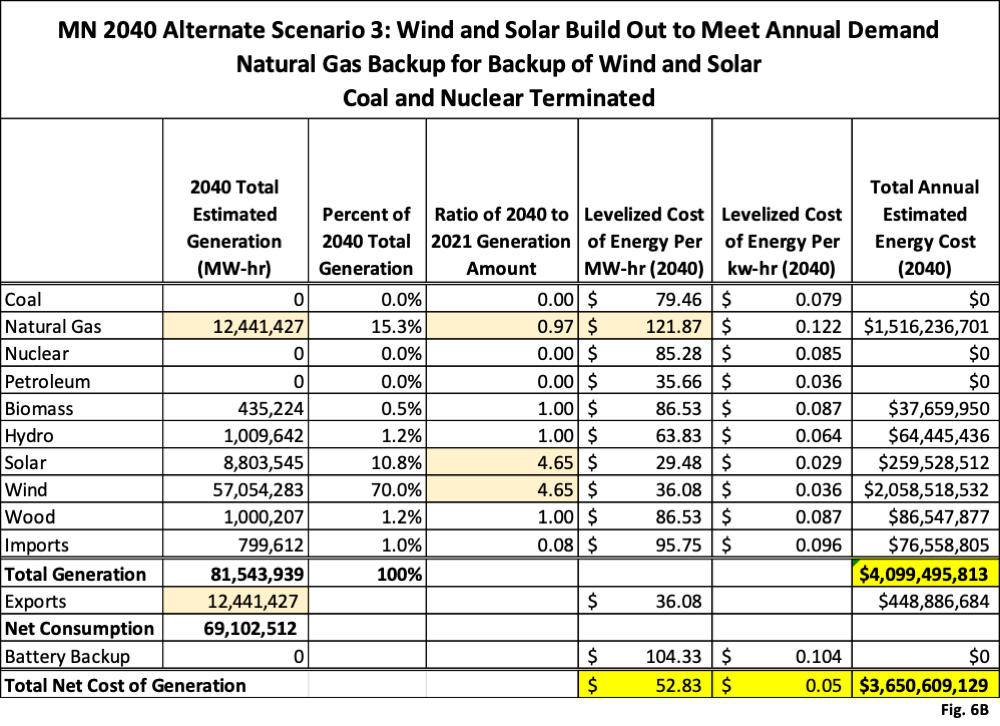
11. Fig. 6A and 6B, Minnesota 2040 Alternate Scenario 3, Wind and Solar Build Out to Meet Annual Demand, Natural Gas Backup for Wind and Solar, Coal and Nuclear Terminated: For this scenario we are still building out wind and solar to 4.65 times 2021 actual output as in the Baseline Scenario, but we are retaining natural gas as backup power. Theoretically natural gas output in 2040 would be 0.97 times 2021 output, almost exactly what we currently have. However, natural gas power would be ramped up and down much more rapidly than is done currently, so it is unclear if existing natural gas plants are suitable for this duty cycle. Short term power rates would likely exceed current capacity, requiring the construction of additional natural gas power plants. The EIA cost document lists a much higher price, $121.87 per MW-hr, for natural gas used exclusively as this type of backup power, rather than the lower price of $44.05 per MW-hr for baseload. Note that we still have a sizeable amount of surplus power from wind and solar that must be exported. The net cost for this scenario is only $0.05, still relatively inexpensive compared to some of our other scenarios.
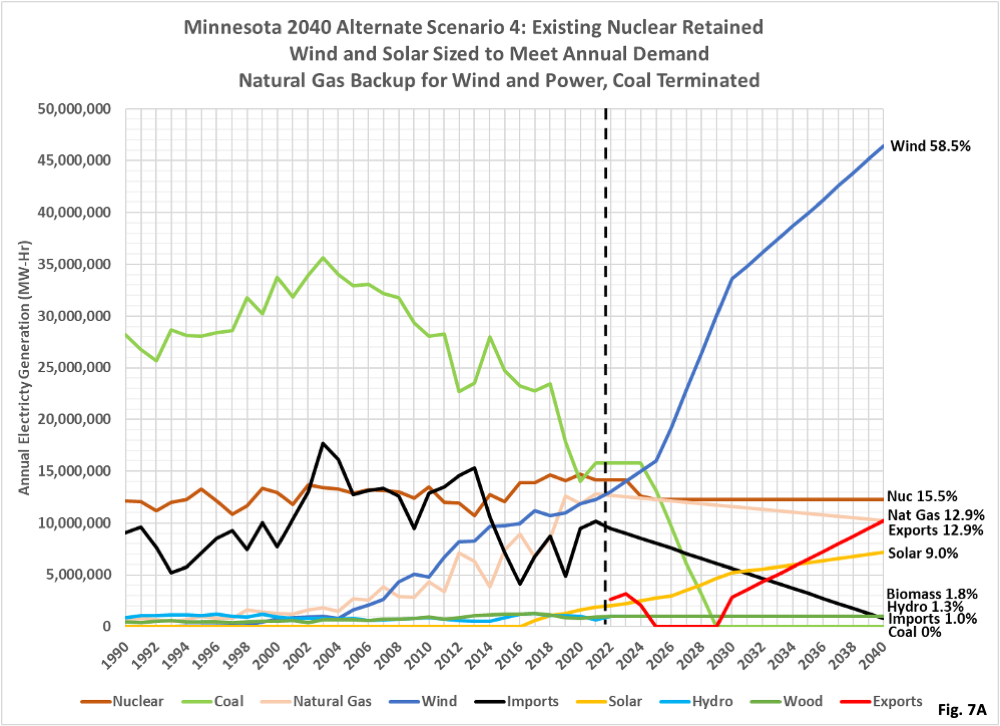
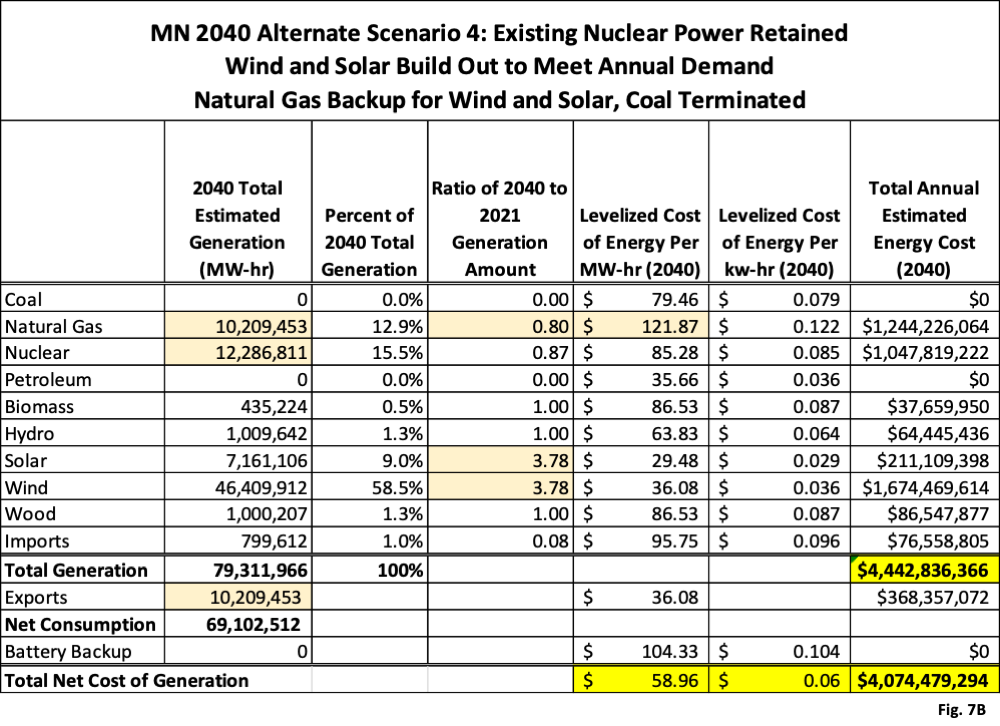
12. Fig. 7A and 7B, Minnesota 2040 Alternate Scenario 4, Existing Nuclear Power Retained, Wind and Solar Sized to Meet Annual Demand, Natural Gas Backup for Wind and Solar, Coal Terminated: For this scenario we assume that Minnesota’s two nuclear power plants operate at the average of 2017-2021 output. This additional baseload power reduces the required build out of wind and solar from the Baseline Scenario of 4.65 times 2021 output to 3.78 times 2021 output. Natural gas is retained as backup for wind and solar, but because it is strictly used as backup power, we cost it at the higher rate of $121.87 per MW-hr. The net cost of this scenario is $0.06 per kw-hr, higher than Alternate Scenario 3, but will be much more reliable due to the nuclear baseload power and natural gas backup for wind and solar.
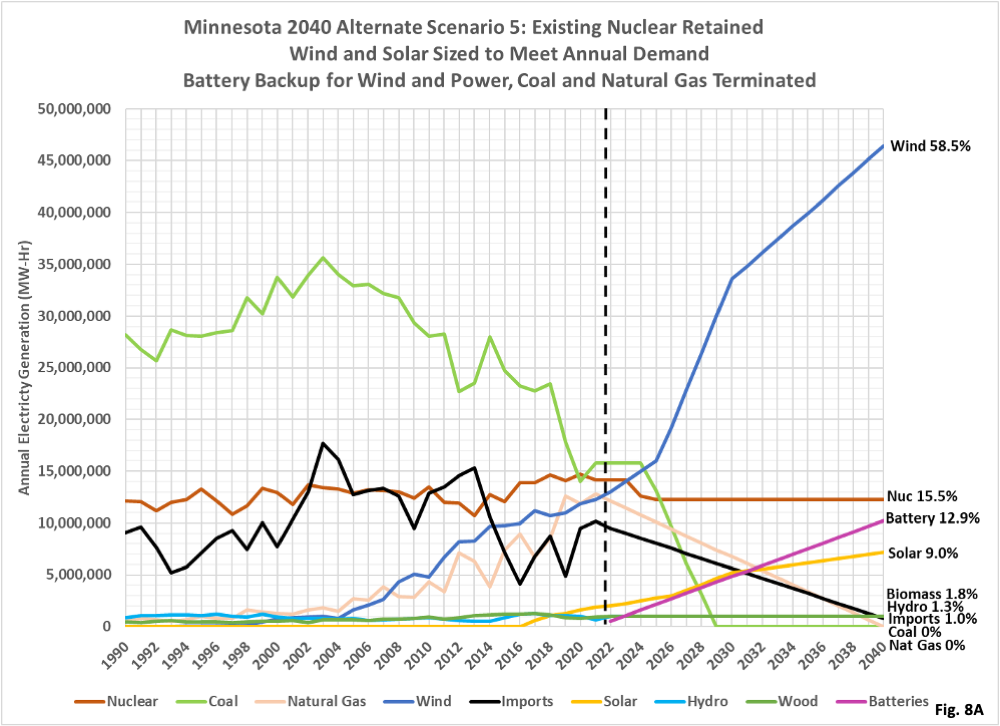
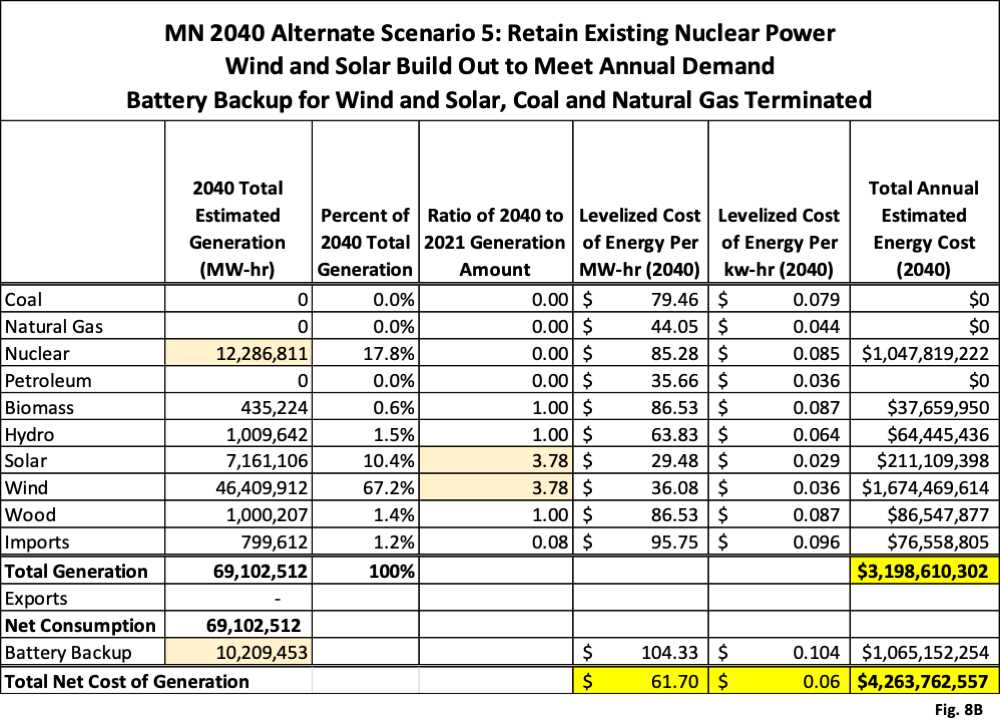
13. Fig. 8A and 8B, Minnesota 2040 Alternate Scenario 5, Existing Nuclear Power Retained, Wind and Solar Sized to Meet Annual Demand, Battery Backup for Wind and Solar, Coal and Natural Gas Terminated: This scenario is identical to Alternate Scenario 4, except that we are using batteries as back up for wind and solar rather than natural gas. The batteries add roughly $190 million per year of cost, but the cost per kw-hr still rounds off to $0.06, the same as Scenario 4. In reality it is likely that a mix of battery and natural gas backup systems might be used.
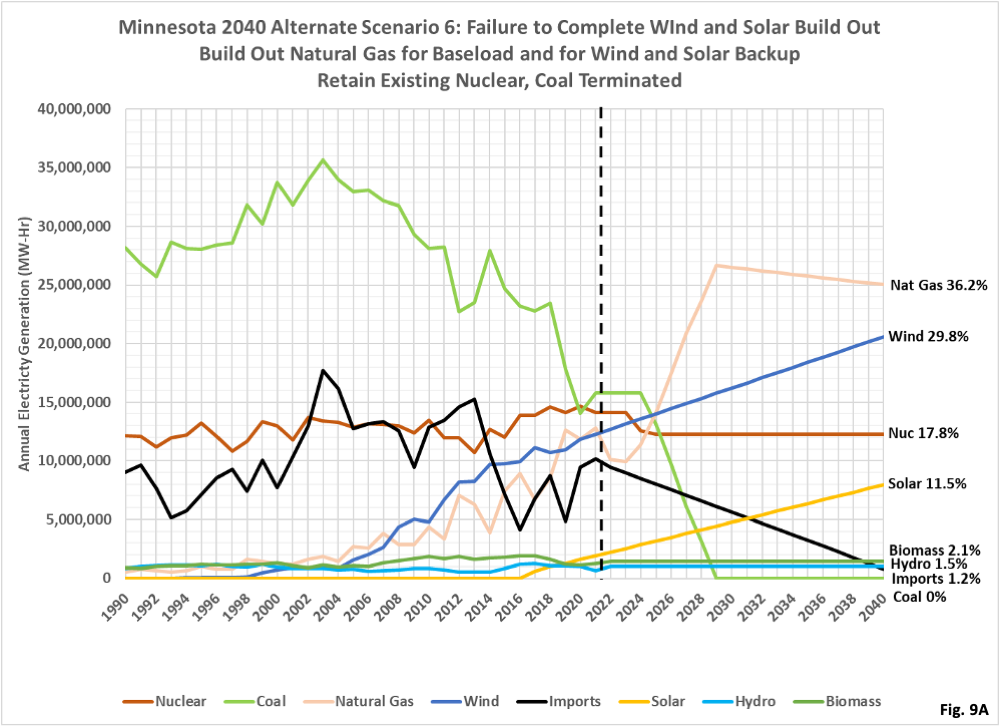
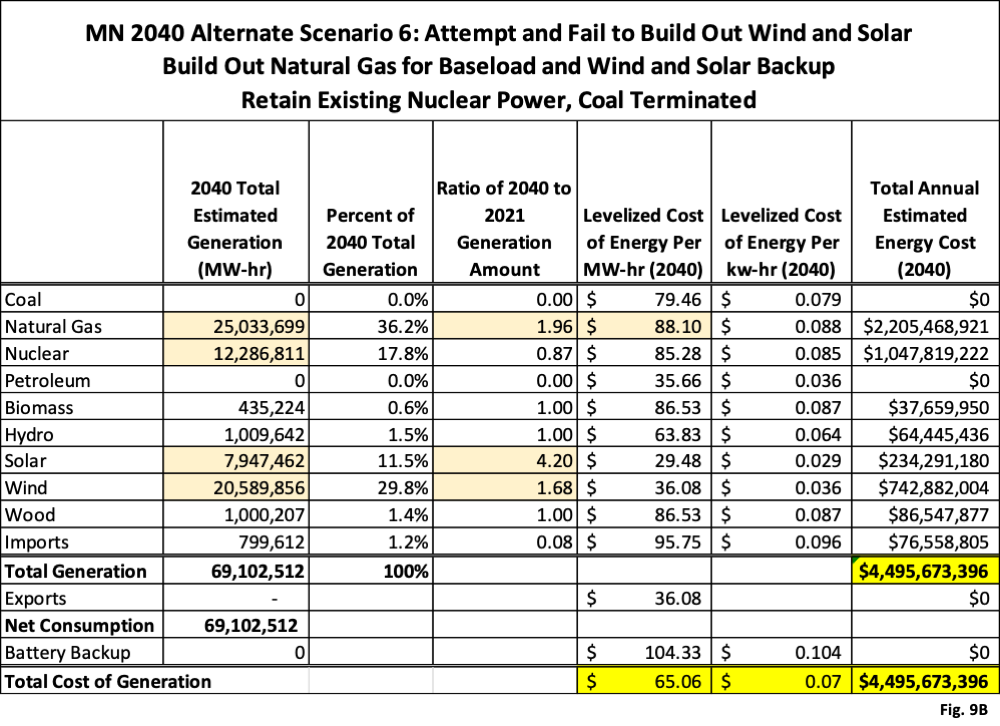
14. Fig. 9A and 9B, Attempt and Fail to Build Out Wind and Solar to Meet Annual Demand, Build Out Natural Gas to Replace Coal Baseload and for Backup of Wind and Solar, Retain Existing Nuclear, Coal Terminated: This scenario presents a scenario where we fail to build out the required amount of wind and solar power to replace coal and natural gas power. We assume that coal is shut down as planned. We assume that wind is built out at the same rate as the last 10 years, reaching only 1.68 times 2021 output in 2040, rather than 4.65 times 2021 output as required I the Baseline Scenario. We assume solar is built out at the same rate as the last 5 years, reaching 4.20 times 2021 output in 2040, but still much smaller than wind power output. We assume at some point that it is realized, hopefully before it is too late, that wind capacity especially will not be built in sufficient quantities in 2040, and that natural gas plants will be built as a substitute. We find that total natural gas electricity would be 1.96 times 2021 output. We have used a cost of $88.10 per MW-hr because half of the natural gas power would be baseload, and half would be backup power for wind and solar. The net cost of this scenario works out to $0.07 per kw-hr, but that the danger is that if the shortfall in wind capacity is recognized too late then there may not be time to build additional natural gas power plants. The test for this scenario will come as soon as 2026 or 2030, as the existing coal plants are shut down, likely before wind power construction has fully ramped up. Note that natural gas peaks in 2029 as the last coal plant is assumed to be shut down, and then gradually declines as more wind and solar are built. Estimated cost for this scenario is only $0.07 per kw-hr, but the risk of rolling blackouts is extremely high.

In 1971 I lived in a place with electric baseboard heaters. The electric bills were $150 per month which was approximately the same as the rent. I bought a wood stove after that and cut down a lot of trees to stay warm.
Rob – FWIW – a common method of heating homes in the rural north are outdoor ovens which circulate water through oven then through out the house through pipes. Usually 1 log a day except extreme cold days where it takes 3-4 logs. No electricity involved. very common in MN, WI and MI, – presume very common in Canada, MT, ND, SD