The more I look at this and at Dave’s analyses, the more insane this law looks. And it will get even worse as these nuts try to force everything to be electric. We won’t be able to meet even the demand for electricity that exists today. Banning natural gas to heat homes? Banning gas-powered lawnmowers? Banning gas and diesel vehicles? That is what these clowns are planning. In this post you see Dave’s analysis of what the bill would require. Basically wind farms in every square inch of Minnesota. Look at the last slide–see those numbers, that is trillions of dollars, and it will be at least twice that high in reality, with material cost increases, permitting delays and costs, etc.
You have two choices in this renewable energy fantasy. You either build enough renewable energy generation capability to have a cushion for even the highest peak times or you build immense battery storage the cover the peaks above your generating capacity. Either way is phenomenally expensive, an expense that has to be passed through in power bills. Either way is incredibly environmentally destructive and dangerous. But that is what the dipshit Minnesota Democrats call “progress”.
 Dave’s notes:
1. In Minnesota’s Energy Insanity Part 1 (link) we showed what Minnesota’s energy mix might look like in 2040 in response to the new carbon-free energy legislation, with a heavy reliance on wind and solar. In Minnesota’s Energy Insanity Part 2 (link)we showed that reliance on wind and solar energy creates mismatches between generation and demand, both on a short-term basis and long-term throughout the summer. Today in Part 3 we find that the extra demand caused by future adoption of electric cars will only increase overall 2040 electricity consumption by 2.2% to 69.105 million MW-hrs. We project, using the energy sources specifically approved for use in the legislation (wind, solar, hydroelectric, and biomass) that Minnesota will derive 82.6% of annual electric from wind and 12.7% from solar in 2040. We also estimate that the required battery capacity to avoid rolling blackouts under our assumed energy mix will total 12.177 million MW-hrs annually. We estimate that the 6.089 million MW-hrs of battery capacity to get through the low wind-power summer months would require a capital expenditure of $2.03 trillion. In future installments of this series we will evaluate other energy mixes, including keeping Minnesota’s nuclear power plants in services and using natural gas to back up wind and solar instead of batteries.
2. Minnesota’s Climate Action Framework, the same document that ultimately led to the new legislation that recently required 100% carbon-free electricity in Minnesota by 2040, has the goal of electric vehicles being 20% of all vehicles in service by 2030 (link). In 2020 there were approximately 1.84 million cars registered in Minnesota (link). We estimate that roughly 500,000 electric vehicles might be in service in Minnesota in 2040 if the 20% goal in 2030 is met. Assuming 12,500 miles per vehicle per year, and assuming an electricity consumption rate of 0.24 kw-hr/mile, using a Tesla Model 3 as a reference (link), we find that this level of adoption would increase 2040 energy use by 1.5 million MW-hr per year. This amount would increase total projected electricity consumption in 2040 from 67,602,512 MW-hr to 69,105,512 MW-hr, an increase of only 2.2% in annual electrical consumption in Minnesota. We will use the 2040 projected baseline of 69.105 million MW-hr for modelling future scenarios of energy source mixes. It does not appear that electric car adoption at the 20% level will greatly affect overall energy consumption in Minnesota in 2040. Using electricity for home heating instead of natural gas or propane would likely to be much more impacting.
3. The use of batteries to back up utility scale electric generation is currently rare in Minnesota. The US Energy Information Agency (EIA), in its report for Form 860 (link), lists only three battery facilities in Minnesota in 2021, with a total capacity of only 15 MW. Only two new battery facilities are listed as proposed, with a total capacity of 2 MW of power. 17 MW is approximately 0.25% of Minnesota’s average annual electricity production rate, not enough to make any real impact on electricity supply. The number of hours at which these battery systems could sustain 17 MW of output is not listed, and would probably be quite limited, so actual capacity is likely well below 0.25% of annual electricity demand in Minnesota.
4. The costs of electricity generated by various energy sources are obtained from the EIA report “Levelized Costs of New Generation Sources in the Annual Energy Outlook 2022”, available here (link). We are using the cost data in Table B2, on Page 21 of the pdf document, for resources entering service in 2040. Using 2040 estimates puts the carbon free energy sources in the best light, as they are projected to decrease in cost, while the costs of more traditional energy sources such as natural gas are projected to increase.
5. Predicting the cost of battery back up systems in 2040 is particularly perilous. Table B2 includes a cost for battery storage of $120.47 per MW-hr. The text describes the duty cycle as energy arbitrage, providing energy to the grid during periods of high cost and recharging during periods of low cost generation. The text does not explain how the modelled battery system would differ if it was intended for providing reliability to the electric grid. We are using this cost data in the belief that the duty cycle is similar, charging and discharging as needed through the course of a day. Note that this cost of battery storage is over and above the cost to generate the electricity to charge the batteries. Note also that we are ignoring energy losses associated with charging and discharging batteries. Various internet sources give different estimates associated with batteries, but a loss rate of 10% seems to be a common estimate.
6. We find that approximately half of our total predicted battery capacity is needed during the course of a day, or overnight. For this application we are using the cost of $120.47 as described in Note 5 above. The other half of the total battery storage is needed for long term storage of energy to overcome the generation deficit over the course of the summer. Since this type of battery storage system would be charged and discharged only once a year it will be hugely expensive, both in terms of total construction cost as well as in cost per MW-hr. The National Renewable Energy Lab (NREL) publishes data and reports about a variety of renewable energy systems, including utility scale batteries. NREL estimates that utility scale batter systems might cost $333 per kw-hr (link). Applying this capital cost to half of the annual required battery capacity, 6.088 million MW-hr, yields a total capital cost of just over $2 trillion for enough battery capacity to last through the wind power deficit caused by a Minnesota summer. Clearly a solution other batteries will be needed to provide power in the summer. Options include building extra wind and solar capacity, retaining the existing nuclear capacity, or retaining and adding to the existing natural gas capacity.
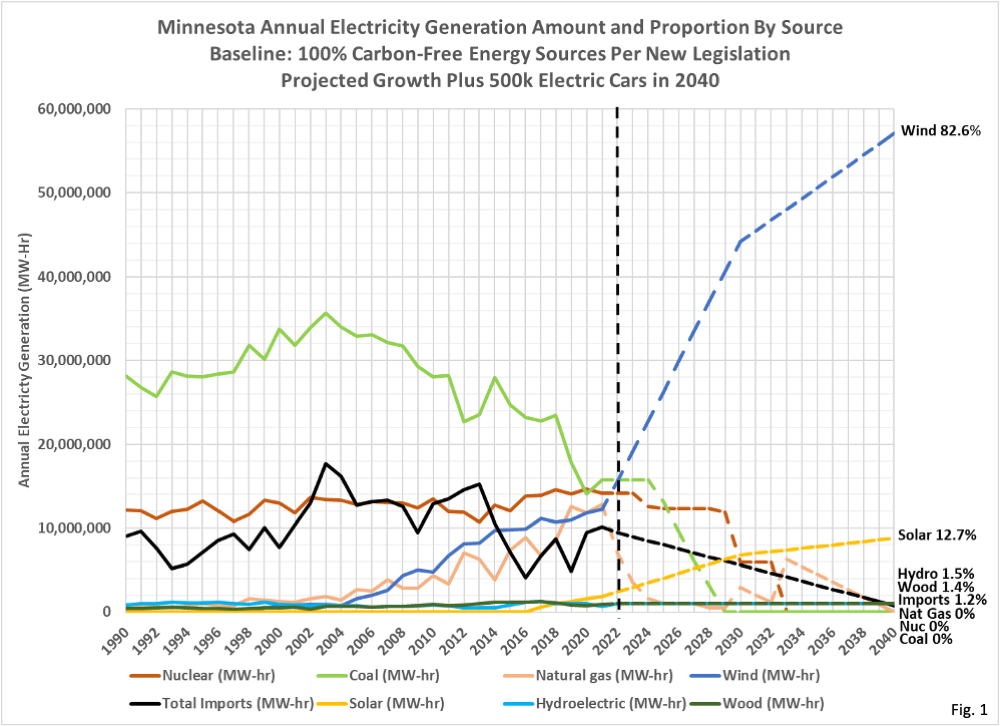
7. Fig. 1, Minnesota Annual Electricity Generation by Source: This chart portrays the actual electricity generation amounts from 1990 through 2021, and the projected generation amounts through 2040, assuming strict compliance with the Minnesota’s new clean energy legislation. We have assumed modest annual increases in annual demand, using a linear regression of actual increases in demand from 2004 through 2021, and have also added the estimated demand from adoption of 500,000 electric cars by 2040. Note that 500,000 electric cars add relatively little demand, increasing 2040 total annual demand by only 2.2%. We have assumed that the 2017-2021 average generation of electricity from biomass and hydro continue at a constant rate through 2040. We have assumed that 10% of imported electricity is from hydro power, and that this imported electricity gradually declines to this 10% level in 2040. We have assumed that nuclear, natural gas, and coal power are shut down before 2040, as they are not explicitly listed as ‘eligible energy technology’ in the new legislation (link). Finally, we have assumed that wind and solar generation are scaled up as needed to generate the total annual electricity demand in 2040, maintaining the same ratio of wind to solar generation as existed in 2021.
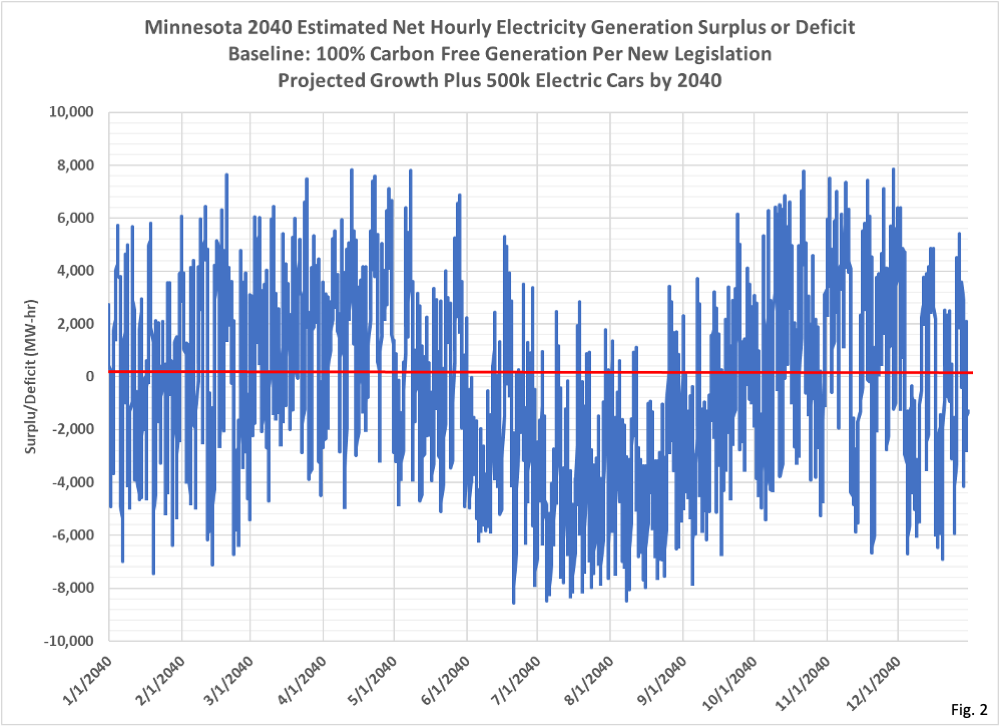
8. Fig. 2, Minnesota 2040 Estimated Net Hourly Electricity Surplus or Deficit: The only hourly data on electrical generation and demand available to us is from the Midcontinent Independent Operator (MISO), which includes Minnesota and several other states. This data is published by the US Energy Information Agency (EIA) Real Time Grid Monitor for 2022 (link). For each hour of 2022, we have calculated the proportion of annual electrical demand, and also the proportion of annual wind and solar generation that occurred in each hour. We applied these hourly proportions to the estimated 2040 energy source mix, and then take the difference between demand and generation to calculate the hourly surplus or deficit in 2040. Note that although wind and solar capacities are sized to generate exactly the total annual electrical demand, there are deficits in exactly 50% of the hours during the year, and surpluses in 50% of the hours. Furthermore, there are generally surpluses in the spring and fall of the year, caused by high wind energy production along with generally reduced demand. In the summer the situation reverses, with low wind production along with high electrical demand. Note that unless the surplus power is used to charge batteries that it must be exported.
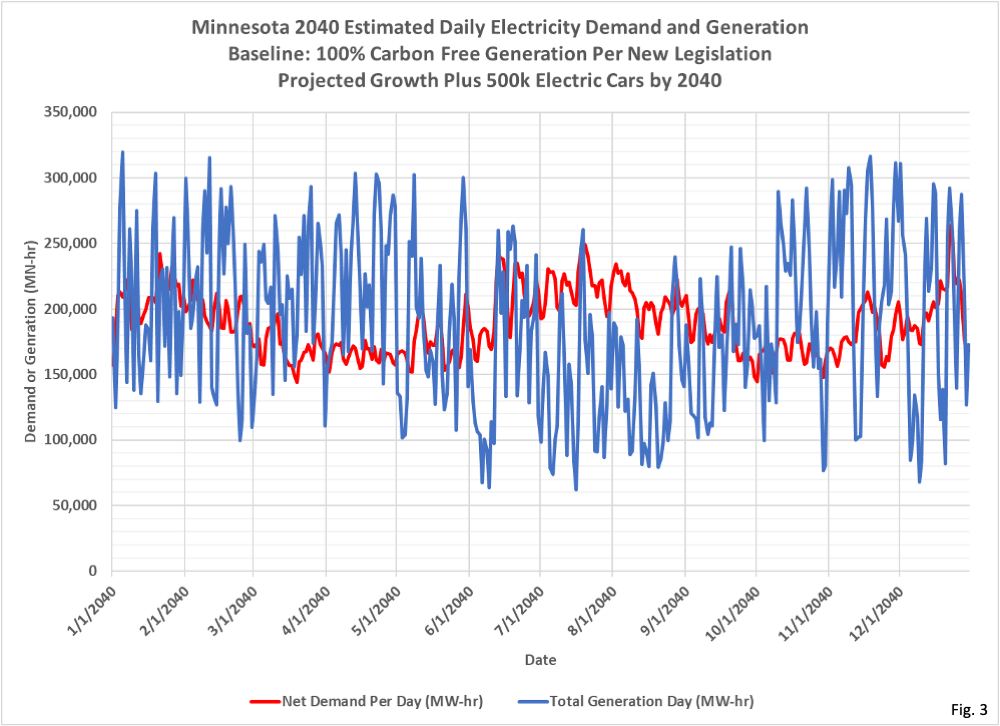
9. Fig. 3, Minnesota Estimated 2040 Daily Electricity Demand and Generation: This chart displays the total daily electrical demand and total daily generation, using the hourly data used to generate Fig. 2. In the December, January, and February, there is little cumulative surplus or deficit, because the demand and generation are evenly matched on a daily basis, despite all the fluctuations. In March, April, and May we accumulate a net surplus of electricity, although periods throughout any individual day are in deficit. A surplus accumulates in October and November as well. In the summer, we have 3-1/2 months of significant deficit. A battery system, if attempted to be used to overcome the deficits in the summer months, would need a capacity of approximately 6.5 million MW-hr, which is roughly half of the total annual battery usage we estimate.
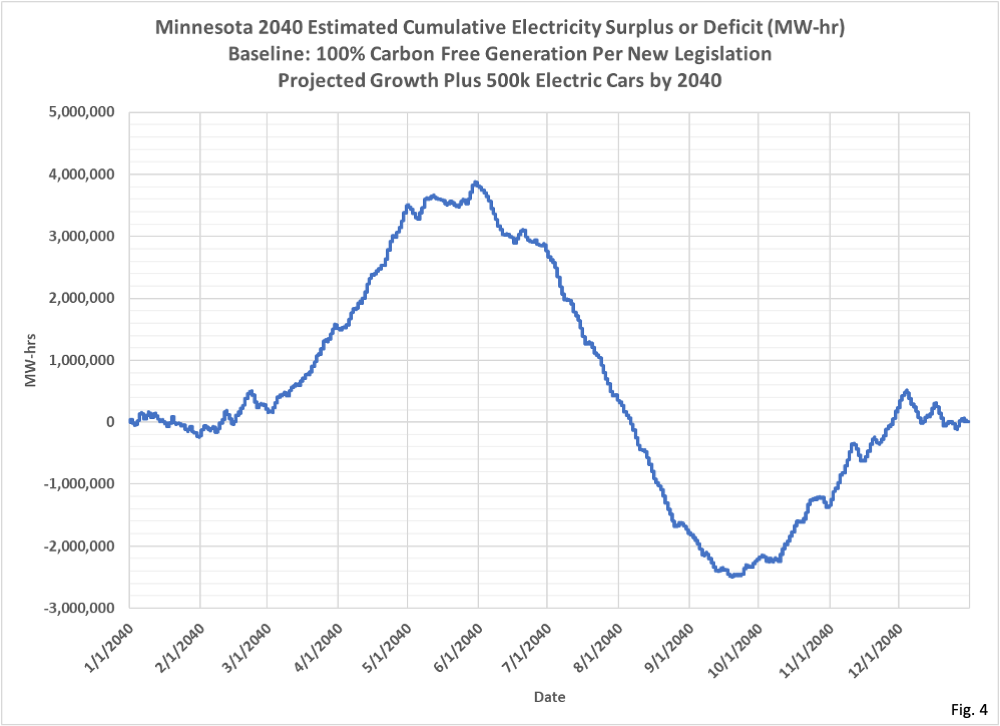
10. Fig. 4, Minnesota Cumulative Electricity Surplus or Deficit in 2040 (MW-hr): To generate this chart we summed the hourly electricity surplus or deficit used to generate Fig. 3. In December, January, and February we generally have fairly equal demand and generation, at least on a monthly basis. Starting in March we have a large excess of generation, accumulating to nearly 4,000,000 MW-hr. If batteries are used as the solution for backup power then this represents the excess power that would have to be stored, assuming we started with no stored power on Jan. 1. Then, starting in June, high demand for power along with lower wind generation consumes this theoretical stored power all the way to a deficit of over 2,500,000 MW-hr. The total span from top to bottom represents the total stored energy batteries would have to provide, around 6,500,000 MW-hrs of electricity. Then, starting in mid-September, we start to generate a surplus of electricity and we get back to zero net stored electricity at the end of the year. We end up back at zero because we sized wind and solar to generate exactly the total amount needed over the course of the year.
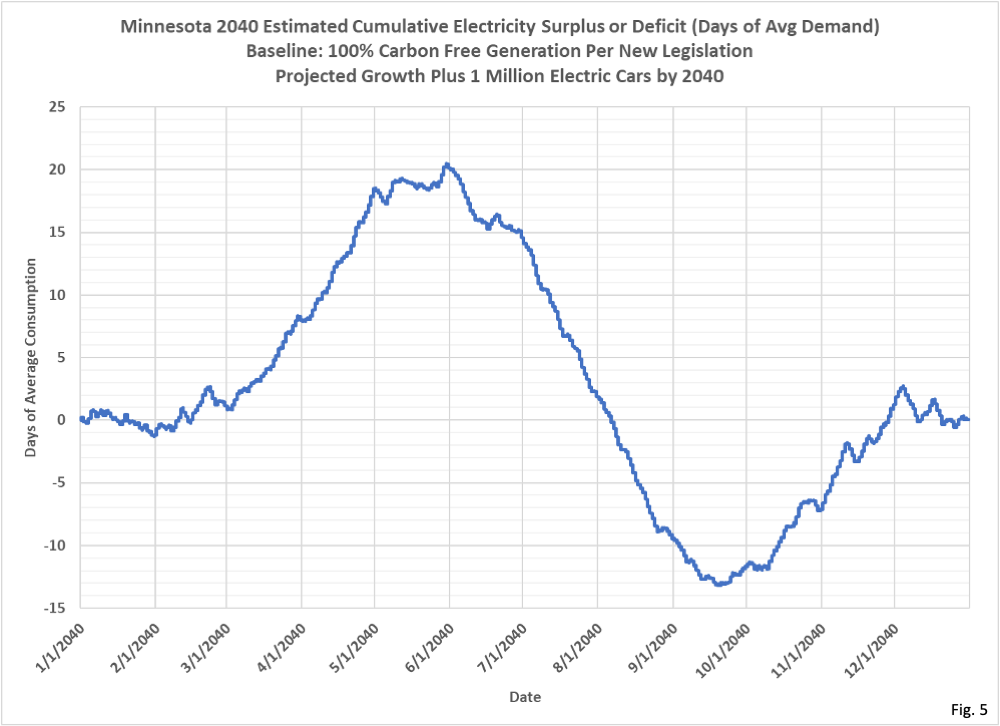
11. Fig. 5, Minnesota Cumulative Electricity Surplus or Deficit in 2040 (Days of Average Demand): This chart takes the same cumulative surplus or deficit from Fig. 4 and divides by the average daily demand to get the cumulative surplus or deficit measured in days of average electricity demand. The total span of this chart from high to low is approximately 33 days. This means that if batteries are used to store excess power generated in the spring that they would need the capacity to store 33 days of daily average demand in order to get Minnesota through the summer without rolling blackouts. This is massively larger than the batteries that might be needed to get through a typical night without solar power or a couple day period with low wind power. The long-term mismatch between demand and generation means that the batteries would need to store as many as 33 times the total power consumed in Minnesota from all generation sources each day.
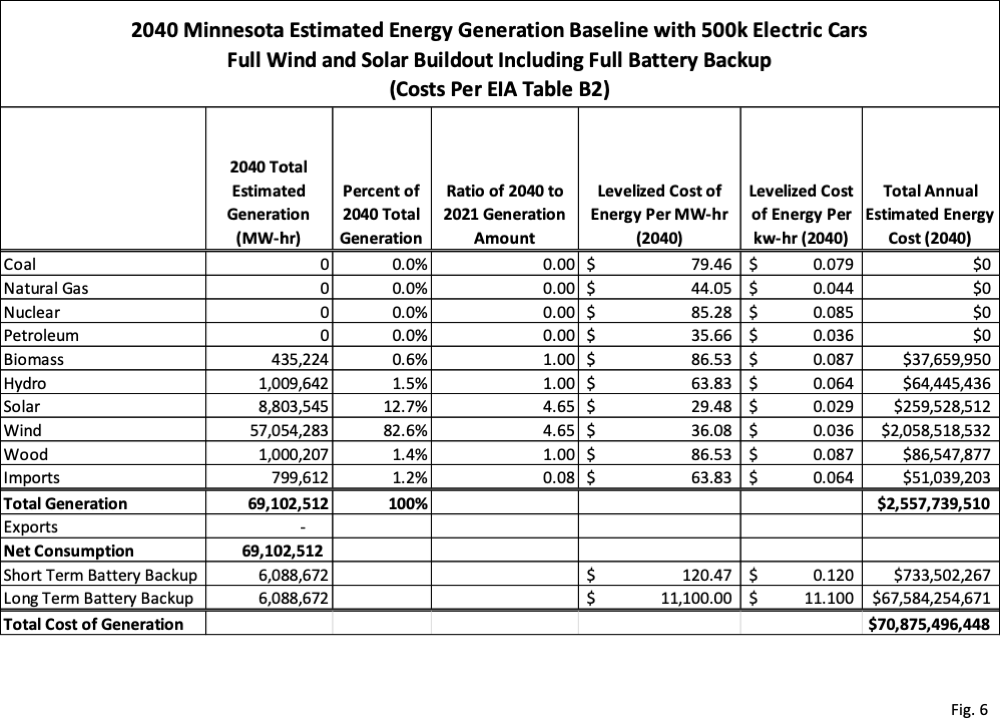
12. Fig. 6, 2040 Minnesota Electrical Generation Source Amounts and Costs, With Full Battery Backup: This table gives the total amounts of electric power generated by source in 2040. The total generation amount is 69,105,512 MW-hr. Even with the addition of 500,000 electric cars in 2040 this is below Minnesota’s peak demand of 72,754,978 MW-hr in 2003. The first column, 2040 Total Estimated Generation, matches the 2040 end date in Fig. 1. Similarly, the second column gives the proportion of total 2040 generation from each source. Wind dominates, followed by solar, because of the assumptions we have made about how the energy industry will react to the new legislation. The third column gives the ratio of generation by source in 2040 to the generation in 2021. Wind and solar would scale to generate 4.65 times 2021 actual generation. Imported power declines to the amount we assume is derived from renewable sources, 10% of the 2017-2021 average, or 8% of the 2021 actual imported amount.
13. The levelized cost per MW-hr in Fig. 6 are taken from Table B2 of the EIA document discussed in Note 4 above. Wind and solar are projected to be the cheapest energy sources in 2040, and natural gas is projected to be the cheapest dispatchable energy source, meaning it is capable of ramping up and down. Note that Table B2 gives two costs for natural gas, one for baseload plants at $44.05/MW-hr and one for ‘capacity resource technologies’ at $121.87/MW-hr. The higher price is for a small-scale system that might back up a solar facility, turning on at night and being idle during the day. We have assumed that natural gas will be required in sufficient quantities that the baseload price is the appropriate price to use, but this will depend on the duty cycle of any natural gas plants in operation in 2040. Note that we list 2 prices for backup batteries. The Short Term price is taken from Table B2, since we envision that half of the required duty cycle will match that described in Table B2. The other half the required battery storage is used for overcoming the shortage of wind power in the summer months. We have assumed that battery facilities would need to be constructed at a capital cost of $333/kw-hr, or $333,000/MW-hr, and amortized over 30 years. This yields a ridiculous capital cost of $2.07 trillion, amortized as $67.584 billion per year for 30 years. Clearly batteries will not be suitable for overcoming the summer wind power deficits. We will explore several options for summer wind power in Part 4 of this series, including building extra wind and solar capacity, retaining the existing nuclear power plants, and retaining natural gas power plants, both existing and new.
