Dave’s analysis of the consequences of Minnesota’s new energy mandate law continues. There is no way, not a single possibility that Minnesota can meet its electricity needs without fossil fuels and/or more nuclear power. To demonstrate just how absurd the law is, Dave has been generous in his analysis to the nonsensical notion that we can go all renewables, but even with that it is clearly a fantasy. Minnesota is part of a multistate grid that includes several states much further south, with different energy needs, and we have less hours of sunlight and less wind than those states, so our situation is even worse than the data used by Dave suggest. The consequences of even attempting to go all renewable will be vastly more expensive electricity and a high likelihood of blackouts. Why are we doing this? Because of the equally ludicrous notion that there is some climate emergency caused by CO2. You may recall the charts Dave did last year using rural Minnesota stations which showed no substantial warming and some actual cooling. But the whackos never care about facts, only about their precious ideological fantasies. Dave’s notes are long, but I encourage you to read them in their entirety.
 Dave’s notes:
- Today in Minnesota’s New Energy Insanit,y Part 2 we attempt to estimate what the implications of reliance on wind power will be in 2040. We find that there are likely to be huge mismatches between hourly electricity demand and hourly generation, caused by the variable nature of wind and solar electricity generation. More worrying, there are also long-term mismatches throughout the year that will require massive battery storage facilities to make up the difference, if batteries are chosen as the backup power source. These charts should be terrifying for anybody who plans to be a resident of Minnesota in 2040, or cares about the prosperity of future generations of Minnesotans.
- The text of Minnesota’s new energy law can be read here: https://www.revisor.mn.gov/bills/text.php?number=SF4&version=latest&session=ls93&session_year=2023&session_number=0. Subdivision 1, on line 2.17, of this new law defines “Carbon-free” energy as energy derived from an “eligible energy source”, later defined as energy from solar, wind, small hydro or large existing hydro, biomass, or hydrogen derived from one of the first four sources. Note that nuclear is not defined as “carbon-free” per this section. A utility that owns a nuclear power plant must file a renewable energy plan to the energy commission, who shall approve the plan unless it determines the energy plan is not in the public interest, in line 13.26 of the text. Additional, in the definition of “renewable” energy starting in line 14.12, renewable energy is defined as wind, solar, geothermal, hydro, biomass, landfill gas, or wastewater effluent. Nowhere in the law is nuclear energy explicitly approved, as other energy sources are. At best, the existing nuclear plants can be submitted for renewed licensing in the hopes that they will be found to be in the public interest by the regulating authorities. If the lawmakers wanted to support nuclear energy, why aren’t at least the two existing nuclear plants listed as “carbon-free”? The fact that they are not included speaks volumes.
- In Minnesota’s New Energy Insanity, Part 1 (https://healthy-skeptic.com/2023/02/12/minnesotas-new-energy-insanity-part-1/) we presented what Minnesota’s electrical generation sources might look like in 2040, with the new carbon-free electricity law taken to its logical conclusion. We found that Minnesota would be highly dependent on wind power in 2040, with natural gas and coal power plants shut down by legislated fiat. We also assumed that nuclear power would also be shut down in 2040, but this is perhaps a uncertain position to take. The new energy law does not mandate the shutdown of nuclear power in 2040, but it is clear there is little support for nuclear power within the Democrat party or the groups pushing for carbon free energy. Whether the two existing power plants are shut down when their current operating licenses expire in 2033 and 2035, or in 2053 and 2055 if they are renewed for another 20-year period, the end result is a future without nuclear energy if those in power have their way. For this reason we have included no nuclear power in our 2040 model, assuming that at some point, either 2035 or 2055, these two plants will be retired and not replaced, and we will ultimately become dependent on wind power for the bulk of our electricity needs.
- In Part 1, we projected a gradual increase in electric demand, continuing the current linear trend from 2003 to 2021. We also assumed that power from hydro and biomass would remain constant at 2017-2021 average levels through 2040. The new energy law only permits new small-scale hydro to be considered carbon free, but does allow expansion of electricity from biomass sources. It is not clear if there is actually support for generation of electricity from landfill gas, for example, or from trash burners.
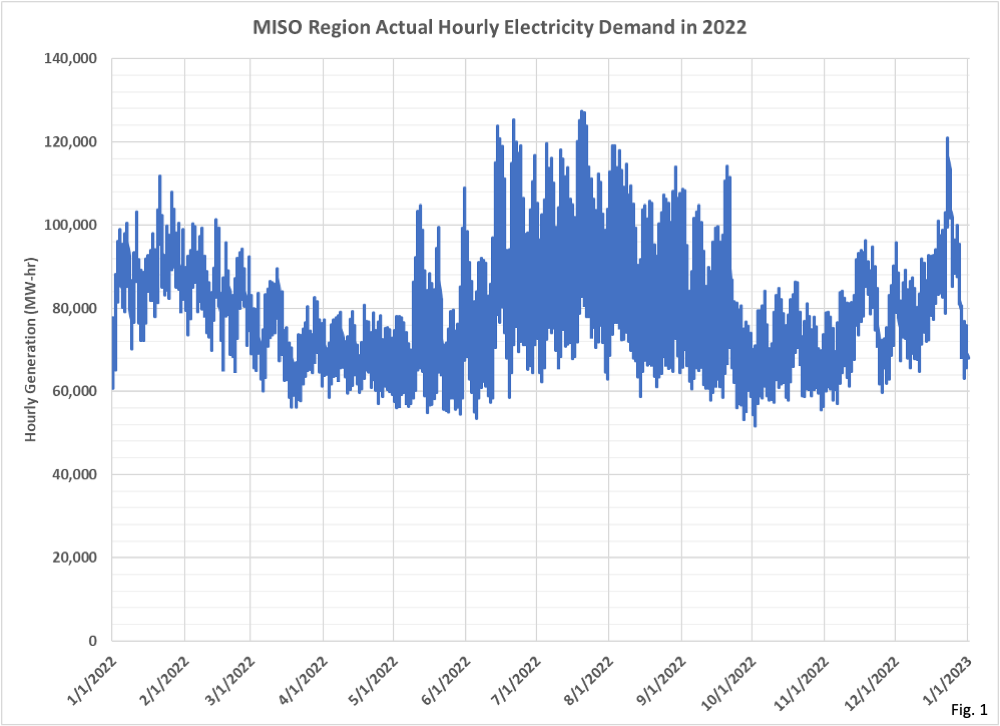
- Figure 1, MISO Region Actual Hourly Electricity Demand, 2022: This chart shows the hourly electricity demand for the entire MISO region. MISO, the Midcontinent Independent System Operator, is the organization that manages electricity distribution across 15 states and Manitoba and includes Minnesota. It appears that data for MISO Subregion 1 (consisting mainly of Minnesota, western, Wisconsin, and North Dakota) is available, but we have been unable to access it, so far. A future update may utilize Subregion 1 data, if we can successfully obtain it. The key point of this chart is that electricity demand is highest in the winter and summer, and lowest in the spring and fall. Note also the fair amount of variability over the course of a day. The raw data was downloaded from the US Energy Information Agency (EIA) Hourly Realtime Grid Monitor (https://www.eia.gov/electricity/gridmonitor/dashboard/electric_overview/regional/REG-MIDW), clicking on “Data Download” in the upper right corner.
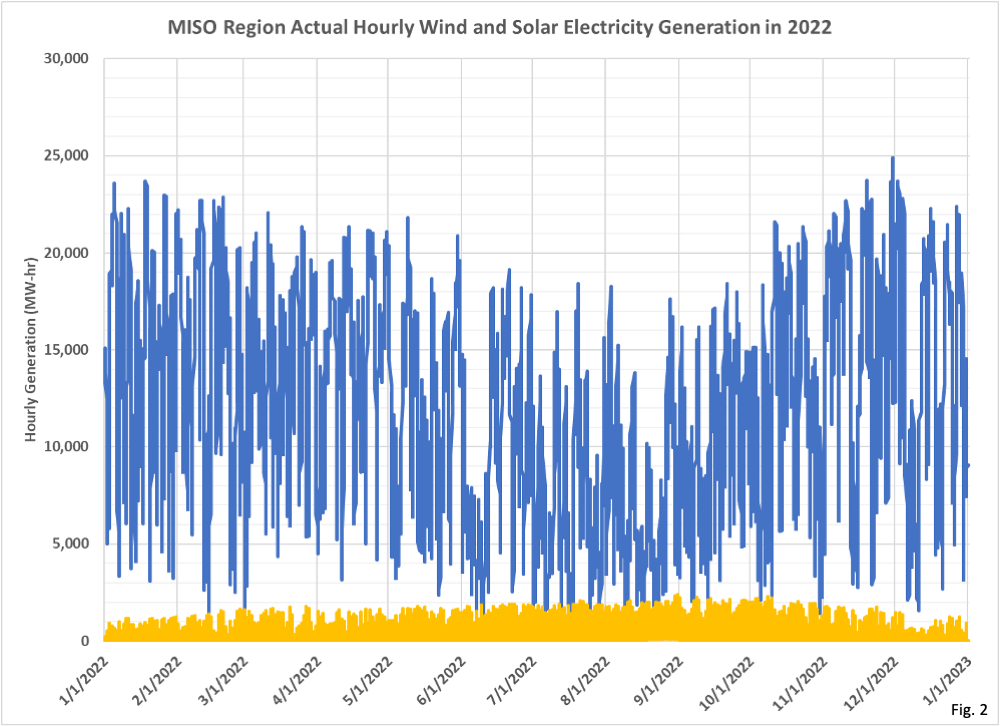
- Figure 2, MISO Region Actual Hourly Electricity Generation From Wind and Solar, 2022: This chart shows the actual MISO wind and solar generation for each hour in 2022. We can see that wind is producing much more electricity than solar, similar to the situation in Minnesota. The key points with this chart are the extreme variability throughout each day, and the relatively high amounts of generation in the spring and fall, and low generation in the summer. The data comes from the same source as Fig. 1.
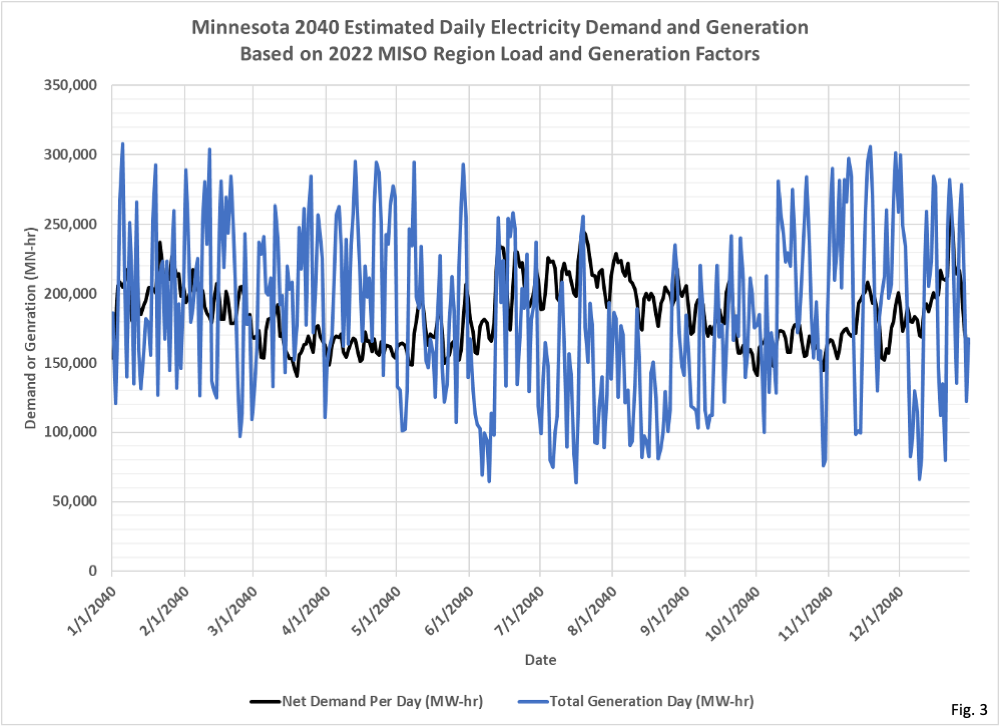
- Figure 3, Minnesota Estimated 2040 Daily Electricity Demand and Generation: In Fig. 1 of Minnesota’s New Energy Insanity Part 1 (https://healthy-skeptic.com/2023/02/12/minnesotas-new-energy-insanity-part-1/) we estimated that Minnesota’s total Energy consumption in 2040 might be 67,602,512 MW-hr, assuming that the linear increase from 2004 to 2021 continues unchanged. We also assumed that all coal and natural gas power plants are shut down in 2040 in compliance with the new energy law. We also assumed that the two existing nuclear power plants are shut down for political reasons or because of end of life reasons, and are not replaced. We then estimated what wind and solar generation would have to be on an annual basis in 2040 to provide the total demand of 67,602,512 MW-hrs, assuming that the ratio of wind power to solar power in Minnesota in 2021 remains constant, and that hydro and biomass generation continue at constant 2017-2021 rates. We estimated that wind power would total 54,704,154 MW-hr in 2040, and solar power would total 9,653,674 MW-hrs.
The next step in our analysis is to assume that Minnesota’s electricity demand per hour in 2040 will fluctuate exactly as MISO’s hourly electricity demand did in 2022. To do this we calculated an energy demand factor for each hour in 2022, which was equal to percentage difference from the actual MISO hourly demand to the average annual hourly demand. These percentage differences in demand for each hour throughout the year were then applied to our 2040 estimated electrical demand in Minnesota. We used the same technique to calculate the 2022 MISO generation factors for wind and solar generation, calculating the percentage difference from 2022 actual hourly generation to the annual average generation. These hourly load factors were then applied to the 2040 estimated annual wind and solar generation in Minnesota, giving us actual hourly wind and solar generation in 2040. In this way variability in 2022 demand and generation were applied to 2040.
Finally, in order to present the data in this chart, we summed the estimated hourly demand and generation for Minnesota for each day. The black curve gives the estimated daily demand, derived from the variation in MISO 2022 data applied to our total 2040 Minnesota demand estimate, and the blue curve is the total electricity generation each day in 2040 assuming the same variability as in 2040, based on all of our assumptions described above, and in Minnesota’s New Energy Insanity Part 1.
Note that in spring and fall the daily generation (blue curve) is generally greater than the daily demand (black curve). Because we sized wind and solar to provide exactly the required amount of power needed on an annual basis, then some parts of the each day we may have too much power or not enough. Similarly, because there are long term trends throughout the year we might have too much power or too little over longer periods of time. We can plainly see that throughout much of the spring we would generate excess power, then have large deficits in the summer, before switching to a surplus in the fall.
Overall, our conclusion from this chart is that throughout the year there are large mismatches between demand and generation due to reliance on wind power. These mismatches will require us to dispose of excess power in some parts of the year, and generate backup power in other parts of the year.
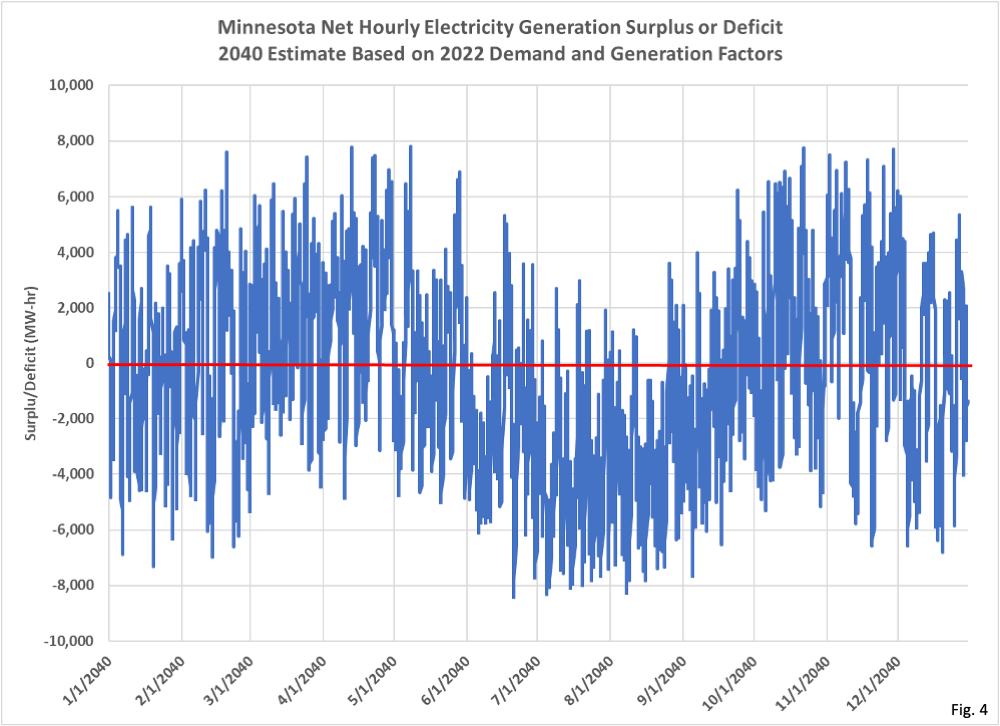
- Figure 4, Minnesota Net Hourly Electricity Generation Surplus or Deficit in 2040 (MW-hr): Taking the underlying demand and generation data from Fig. 3, we calculated the difference between estimated demand and estimated supply for each hour in 2040. This difference may be positive (surplus of power) or negative (deficit of power). Any hour above the red line is surplus power, and below the red line is in deficit. Because we sized the 2040 wind and solar power generation based on total required annual power, we find that exactly 50% of the hours are in surplus (requiring disposal of excess power) and exactly 50% are in deficit (requiring rolling blackouts if there is not a viable backup power supply). The long-term ebb and flow of the surpluses and deficits throughout the year are plain to see. We find that the longest period in surplus, thus not requiring rolling blackouts without backup power, is 128 hours. The longest period of time in deficit is 324 hours (about 13 days), requiring rolling blackouts for the entire time period if there is not backup power. The rest of the year the deficits are more intermittent but will total 50% of all hours during the year. If batteries are contemplated as the solution for backup power then they will have to absorb the surplus power, at nearly 8000 MW-hr per hour in the fall and spring, and supply the energy caused by the generation deficit, exceeding 8000 MW-hr per hour in the summer. You can only imagine what that kind of battery storage would cost and what kind of environmental issues the production and operation of this storage would cause.
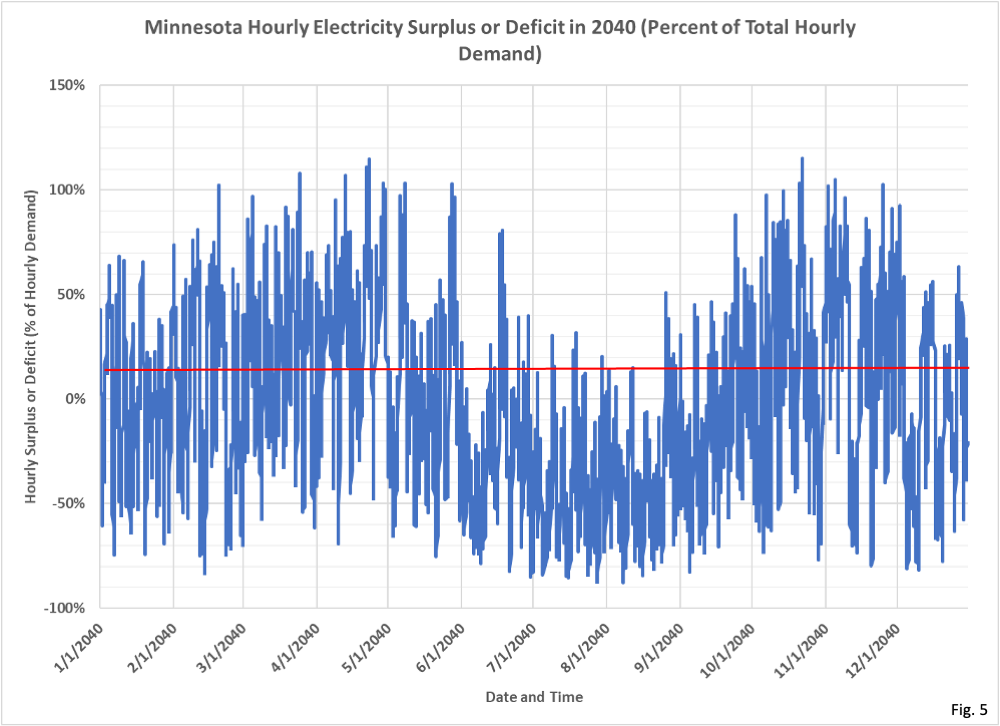
- Figure 5, Minnesota Net Hourly Electricity Generation Surplus or Deficit in 2040 (% of Total Hourly Demand): This chart presents the same data as Fig. 4, but this time the surplus or deficit is expressed as a % of the hourly demand for electricity. The peak surpluses in the spring and fall exceed 100%, meaning that total generation will be slightly more than double hourly demand for those hours. The largest deficits in the summer approach 80% of demand. Without reliable backup power the negative deficits represent an estimate for much power the rolling blackouts would have to save. It seems unrealistic to assume that close to 80% cuts in electricity usage in the summer could be accomplished without massive consequences.
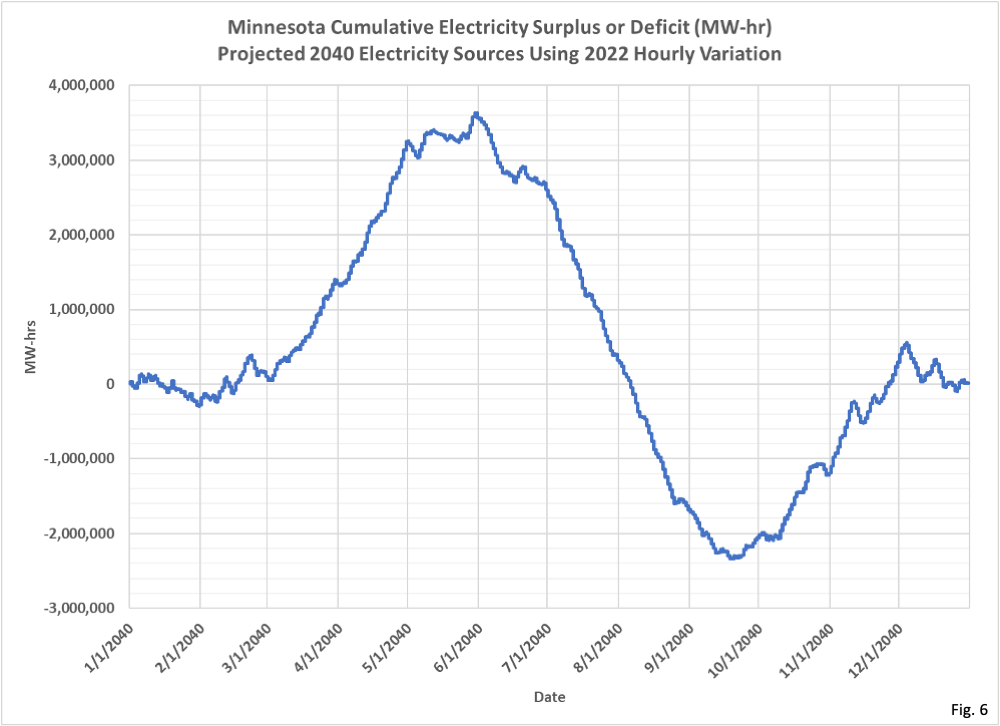
- Figure 6, Minnesota Cumulative Electricity Surplus or Deficit in 2040 (MW-hr): To generate this chart we summed the hourly electricity surplus or deficit from Fig. 4. In January and February we generally have fairly equal demand and generation, at least on a monthly basis. Starting in March we have a large excess of generation, accumulating to nearly 4,000,000 MW-hr. If batteries are used as the solution for backup power then this represents the excess power that would have to be stored, assuming we started with no stored power on Jan. 1. Then, starting in June, high demand for power along with lower wind generation consumes this theoretical stored power all the way to a deficit of over 2,000,000 MW-hr. The total span from top to bottom represents the total stored energy batteries would have to provide, just under 6,000,000 MW-hrs of electricity. Then, starting in mid-September, we start to generate a surplus of electricity and we get back to zero net stored electricity at the end of the year. We end up back at zero because we sized the wind and solar generation to exactly equal the amount needed over the course of the year.
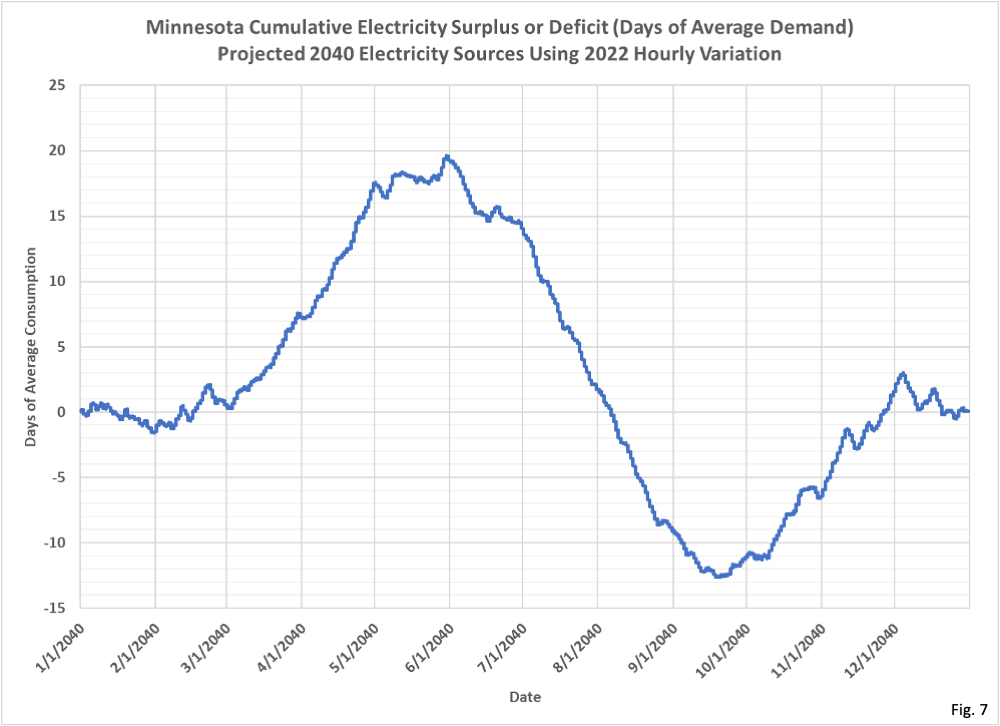
- 10, Minnesota Cumulative Electricity Surplus or Deficit in 2040 (Days of Average Demand): This chart takes the same cumulative surplus or deficit from Fig. 6 and divides by the average daily demand to get the cumulative surplus or deficit measured in days of average electricity demand. The total span of this chart from high to low is approximately 33 days. This means that if batteries are used to store excess power generated in the spring that they would need the capacity to store 33 days of average demand in order to get Minnesota through the summer without rolling blackouts. This is massively larger than the batteries that might be needed to get through a typical night without solar power or a couple day period with low wind power. The long term mismatch between demand and generation means that the batteries would need to store 33 times the total power consumed in Minnesota from all generation sources each day.
- All of the analysis above is based on many assumptions, any one of which may be incorrect. For example, if nuclear power is retained at current levels this would increase the daily baseload power, and therefore reduce the total amount of deficit in the summer. However, as long as wind and solar are used to make up a substantial portion of daily power then 50% of the hours of the year will be in deficit, requiring rolling blackouts.
- We assumed that Minnesota’s power demand would increase gradually leading up to 2040. It is possible that increased adoption of electric cars will impact the total electrical demand. The official policy of Minnesota is that 20% of all registered vehicles in Minnesota in 2030 will be electric vehicles (https://www.americanexperiment.org/walz-wants-electric-vehicles-to-be-20-percent-of-all-vehicles-on-the-road-by-2030/). Future installments in this series will estimate the resulting electrical demand if electric cars are adopted at this rate, as well as other possible mixes of power generation sources.
- We only considered electricity demand and generation in 2022. It is likely if we analyzed other years, we might find more extreme ranges of demand or generation. We also did not include any excess generation capacity in our Minnesota’s New Energy Insanity Part 1 analysis. Clearly, a substantial generating margin should realistically be provided if we want to avoid blackouts.
- A rational conclusion from all of the above analysis is that it seems unlikely that Minnesota will both construct sufficient wind and solar power generating facilities to meet the 2040 carbon free goal, and also build enough battery capacity to avoid rolling blackouts, even if cost was no object. A reasonable solution to meet the goal of reducing carbon dioxide generation would be to gradually increase wind and solar output while keeping natural gas power plants online to provide baseload and peaking power. Future installments of this series may investigate some of these alternate power supply mixes.

Dave, Very Well Done!
The Healthy Skeptic is rightly criticizing the 2040 energy standard legislation. Let’s see the legislation.
HF 7 Electric utility renewable energy standard obligations modified, utility cost recovery provided, … . 02/02/2023 Third reading Passed pg. 638 vote: 34-33 (Party-Line?). P38 shows the votes: https://www.senate.mn/journals/gotopage?session=ls93&number=638
Text: .
House research Notes (read the Overview): https://www.house.mn.gov/hrd/bs/93/HF0007.pdf
Senate Fiscal Notes (Note no $ amounts are seen): file:///C:/a-temp/HF7_1A-1.pdf
“The bill establishes a carbon-free resource standard for all covered electric utilities that starts at 80% in 2030 and increases by steps to 100 percent by 2040.”
A big proponent is “Fresh Energy”: 100% by 2040 bill: The 100% clean electricity bill, which was passed by the Minnesota Legislature and was signed into law by Governor Tim Walz on February 7, 2023,
.
The Administration is cramming their energy notion down our throats -and pocketbooks. HF413 Companion: SF1296, EV-Vehicle Charging & Promotions is a perfect example.
See YouTube of hearing: https://www.youtube.com/watch?v=eGZC1iFjCS4
“House Sustainable Infrastructure Policy Committee OKs HF413 1/25/23.” January 25, 2023.
Bill: https://www.revisor.mn.gov/bills/bill.php?f=HF413&b=house&y=2023&ssn=0
Text: https://www.revisor.mn.gov/bills/text.php?number=HF413&type=bill&version=1&session=ls93&session_year=2023&session_number=0
House Summary: https://www.house.mn.gov/hrd/bs/93/HF0413.pdf
The EV-Charging legislation proposal, Docket 22-432 is a perfect example of forcing and the lack of ratepayer notice.
Avoiding many issues, upon receipt of the Xcel Petition, the MPUC immediately passed the matter to another Minnesota office: The Office of Administrative Hearings. There, the consumer has no direct voice; consumers are unlikely to even know of the office.
Another example is that there is no consumer group provided marshaling the ratepayer, informing the homeowner what is happening and what they can do about it.
The Xcel Petition was filed months ago but only now is the ratepayer given notice -by a card in the utility bill.
** Consumer contact form: https://mn.gov/puc/assets/Printable%20Public%20Comment%20form_tcm14-494375.pdf
* The announcement did not mention the Petition or the MPUC Docket Number, Docket 22-432.
* Nor how to get or see the Petition filing and evidence.
Nor does it,
* provide information about how to get public information
* how to address MPUC
* how to register a complaint with Xcel or the MPUC
* how to file a position statement
* or how to become a Party to the proceeding.
The announcement nor the MPUC provided no standard time line for evidence or hearings. Normally the time-line is 6 – 9 months. The card note in the bill gave maybe 1 – 3 weeks.
The MPUC / Xcel’s very late ratepayer notice meant:
* the homeowner was totally surprised by the idea
* has minimal opportunity of public input and Testimony
* has very little opportunity to become informed
* to discuss it with others in the neighborhood and community
* no opportunity to cross examine the Company, the MPUC staff witnesses, other Parties, or other public
* and not time to contact their legislators about the matter.
The card notice said that there would be two opportunities for the public to see and make public input.
However, the affair is not being held live; it is nothing but a Zoom affair, a virtual not real situation.
* It means the public has almost no opportunity to provide information to the hearing.
* It implies only a handful of ratepayers will be able to voice their concerns.
* It implies the public will not be able to provide contrary information nor rebuttal.
* It means those in virtual attendance will not be addressing the MPUC.
* Sadly, it also means most Minnesotans will not have the ability to directly provide their views to the MPUC.
In other words, the most important people in the State are being cast adrift.
Follow the money.
The massive mismatch in the timing of electric generation for wind and solar with timing of electric demand is extremely well known. Its astonishing delusional to believe that battery backup would be remotely sufficient.
Marc jacobson – the fraudster out Stanford of 100% renewable fame claims that 4 hour battery backup is more than sufficient since the wind is always blowing somewhere,.
I think the wind is mostly blowing inside his head
Thanks Dave and Kevin. All I ask is that my electricity be dischargable — there when I need it, and affordable, so I don’t have to choose between food and warmth. Renewable without nukes will not be dischargable and every where there are renewables there are high prices. But there may be a place for solar, maybe not in MN. Thomas Massie a member of congress who is a very interesting character salvaged a Tesla battery five years ago and has been using it to help run his home (which he built) off the grid. It charges during the day and provides the needed power at night. It gives me pause to think that maybe there’s a better way to put some of this solar technology to use that maybe won’t involve the MISO grid. So much legislation for solar power, both big farms and residential with buybacks is organized around utilities and grid managers. I won’t hold my breath.