The legislature and Governor of Minnesota, in their full-blown delusional power-madness, have passed a bill which guarantees that Minnesota will have the most expensive electricity in the country and at the same time have blackouts most of the year. The bill is based on the ludicrous assumption that somehow we can generate enough wind and solar power, with a little hydro backup, to supply demand. The reality is that we will be purchasing even more coal and gas power from the Dakotas and elsewhere. Now one thing that may help is the Little Timmy’s whacko policies are chasing people out of the state extremely rapidly, so demand may be much lower than currently appears. One thing that hurts is the equally absurd requirement that everyone drive an electric car, which would cause electricity demand to soar. I know I sound harsh and repetitive, but these people are idiots and we will all pay for their idiocy. Read Dave’s notes in full to understand how crazy this is.
And understand that Dave here is assuming pretty flat electricity demand in the future years. The reality is that people will be forced into electric cars, driving demand far higher. Note further that the state will have to build an absurd amount of wind power generation to meet future demand. That simply won’t happen.
 Dave’s notes:
- Recently the Minnesota legislature passed a new bill (link) requiring the State’s electric utilities to provide 100% renewable energy by 2040. The version of the legislation passed by the Minnesota Senate can be read here: (link). A complete technical and economic analysis of this legislation and the impact on Minnesota’s electric power industry is beyond our means, but we will examine the data that is available to us and see what we can learn. In the charts below we will present the data available from the US Energy Information Agency (EIA) and then calculate what the mix of power sources might be needed through 2040 based on the requirements in the new legislation, and based on many assumptions.
- Note that the estimates below for how much power must be generated by the various power sources are actual annual power required, based on the assumptions, not the installed capacity necessary to achieve these electrical production levels. We have posted previously (link) that wind power plants in Minnesota have monthly average outputs of between 10% and 60% of nameplate rating, and solar power plants have monthly outputs of between 5% and 40% of nameplate rating.
- The key requirement of the legislation is that it requires that electric utilities must generate or distribute 80% electricity from “eligible energy technologies” by 2030, 90% by 2035, and 100% by 2040. “Eligible energy technologies” are described as both renewable and carbon free in different places in the legislation, however, only 5 specific sources are listed as acceptable: 1). Solar, 2). Wind, 3). Hydroelectric less than 100 megawatts (MW), or greater than 100 MW only if already in operation, 4). Hydrogen, if derived from one of the other four sources in this list, and 5). Biomass, including landfill gas, anaerobic digesters, or refuse burners. Refuse burners located in counties with population densities of 1500 to 2500 persons per square mile are excluded, written to intentionally exclude a Hennepin County refuse plant, according to news reports.
- The legislation specifically lists wind, solar, hydro, and biomass as “carbon free”. However, not considered is the carbon footprint of the entire energy production chain, from mining raw materials to construct the power plant, obtaining the energy source for carbon-based fuel sources, constructing the power plant, maintaining and operating the powerplant, and disposal when the facility is shut down. None of these activities are carbon free, even for the specific technologies labelled as carbon free by this legislation. In addition, factors such as reliability, domestic availability, and non-carbon environmental impact also need to be fully assessed. Finally, by limiting the energy sources to “eligible energy technologies” this legislation will remove any incentive to develop other possible energy technologies that might be a better choice overall for the state of Minnesota.
- Notably missing from the list of renewable or carbon free energy sources is nuclear energy. Also missing is any provision for using carbon sequestration to mitigate carbon emissions, if such technology should provide technologically and economically viable. Because these are not listed as “eligible energy technologies” there will be no incentive for companies to attempt to develop these technologies in the future, or any others that might be carbon free, or at least less environmentally harmful that those included in the legislation.
- Hydrogen is not a power source, even though it is listed as an “eligible energy technology”; it is merely a way to store energy in a form that it might be transferred for later use. Hydrogen and batteries may provide a way to store excess energy for use at night or when the wind doesn’t blow. However, all storage systems will have inherent energy losses and inefficiencies, which will reduce the available power while also costing a huge amount of money.
- There are two mechanisms in the legislation the allow for the continued use of carbon-emitting energy sources after 2040. First, the electric utilities may submit a request for modification or delay of the implementation of the carbon free standard for several reasons, such as impacts on utility costs, reliability of the electric grid, technical advances or concerns, construction permitting delays, construction delays, etc. It is unknown how likely it will be that the relevant agencies will grant modifications or delays. Second, the utility may purchase ‘renewable energy credits’ in lieu of complying with the renewable or carbon-free energy standards. The cost of these credits is not known, but it seems obvious that the use of renewable credits would increase cost to customers, since the cost of the renewable credits would be over and above the cost of producing the energy.
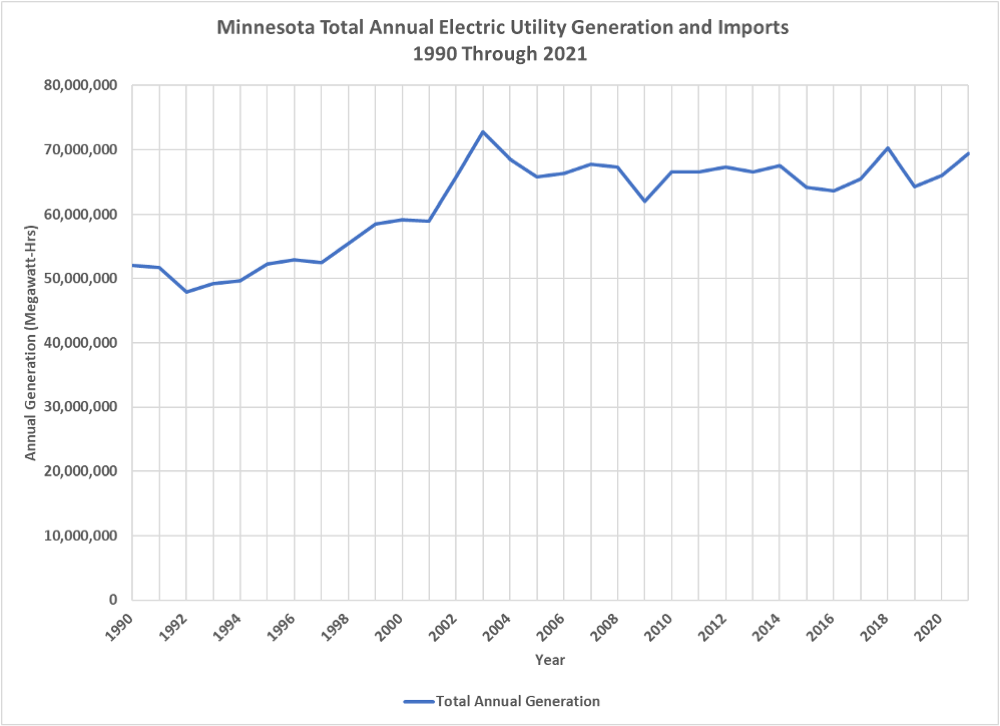
- Fig. 1, Minnesota Total Annual Electricity Generation, 1990 Through 2021: This chart displays the annual amount of electricity generated or distributed by Minnesota’s electric utilities, including power produced by independent power producers and power imported from Canada or other states. Power produced for on-site commercial or industrial purposes is excluded, and power from residential solar panels is excluded. The most notable feature of this chart is that total electrical generation peaked at 70.52 million MW-hr in 2003, after rising steadily since 1990. After the 2003 peak, generation dropped lower for several years, followed by a more recent gradual increasing trend. Data is available from the EIA here: (link). Generation data is found on Tab 5 and import data is on Tab 10 of the spreadsheet available at this link.
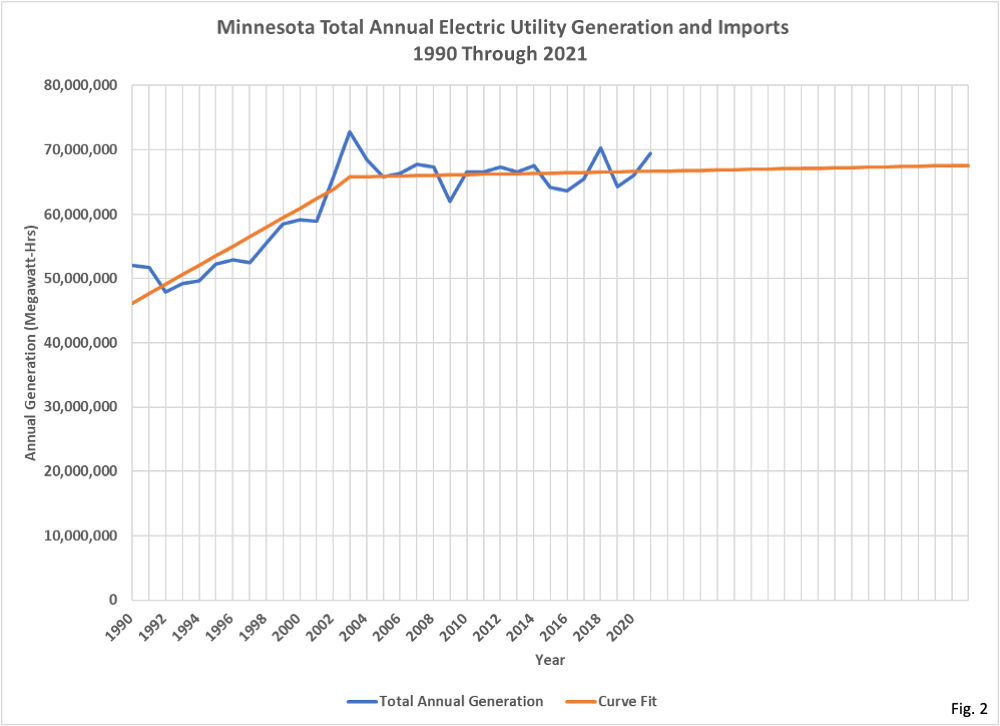
- Fig. 2, Minnesota Total Annual Electricity Generation, 1990 Through 2021, with Curve Fit: The annual total from Fig 1 was analyzed in specialized software to evaluate possible curve fits. After analyzing over 100 possible models, a piecewise linear model was judged to be the best curve fit that also could plausibly be extended to 2040. The model uses a linear regression from 1990 to 2003, and then a separate linear regression from 2004 to 2021. It is not clear why there is a step change in the rate of increase in electrical consumption in 2003, but the data appears to support that this happened. Since 2004, electrical generation has increased by 48,610 MW-hr per year per this model. Improvements in electrical efficiency may tend to reduce future electricity usage, while population growth and adoption of electric cars may increase usage. We will assume this gradual increase through 2040 is correct for the purposes of this analysis. This curve fit will be used to calculate the projected electrical generation by source in the years 2022 through 2040.
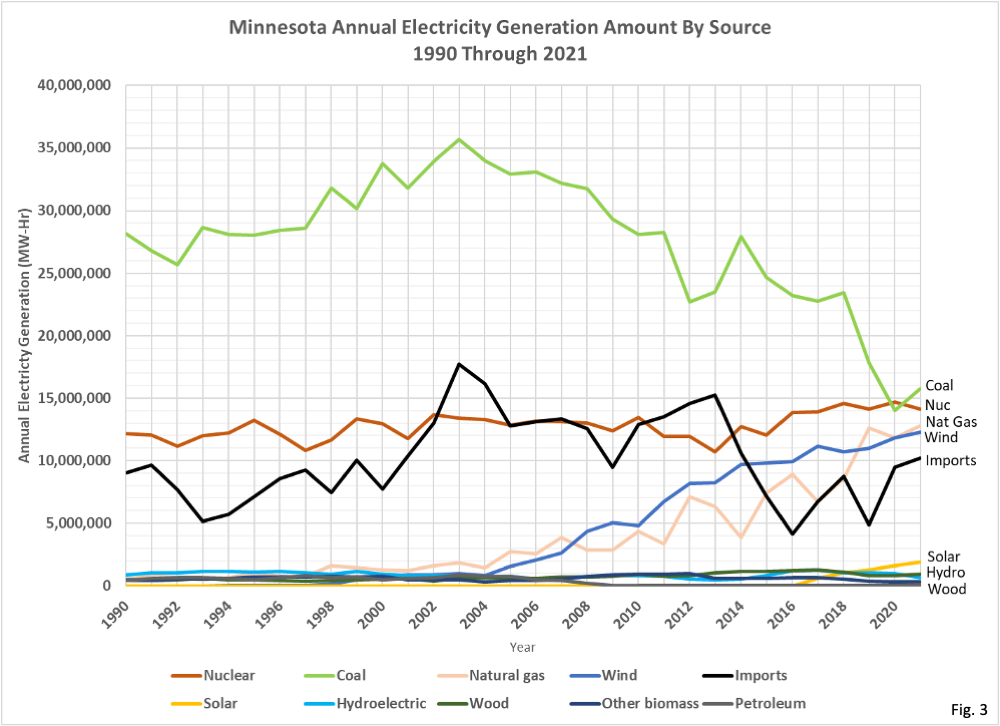
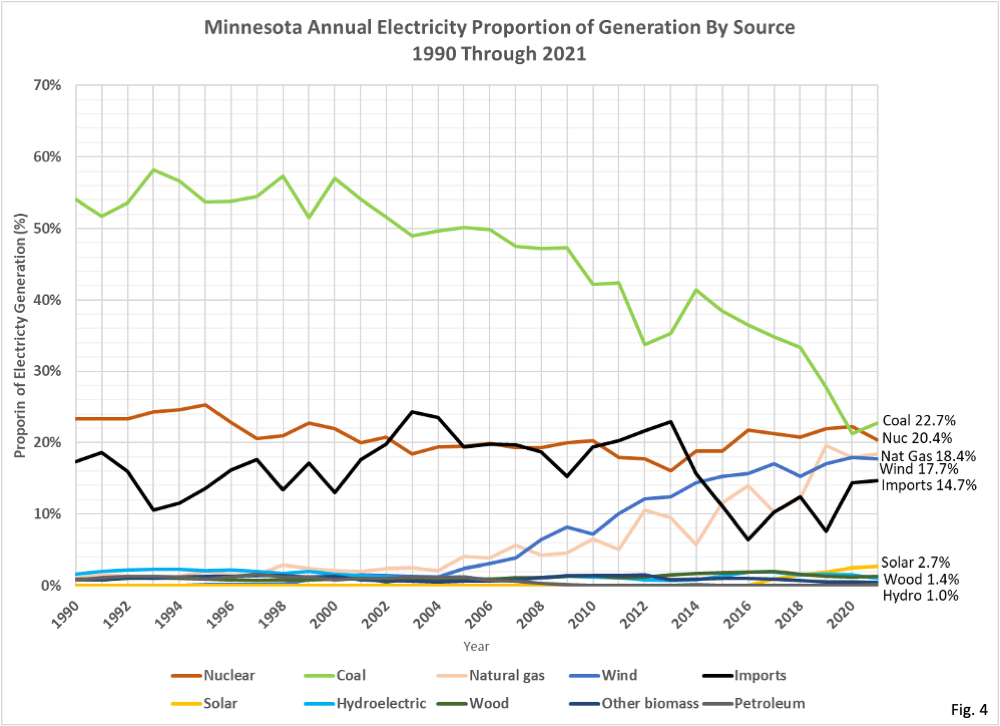
- Fig. 3, Minnesota Annual Electricity Generation by Source, Amounts: This chart gives the generation amount by source, using the same data source as Fig. 1 and 2. The overall trend has seen wind power and natural gas gradually replacing coal on an annual basis, with nuclear power being relatively constant and imported electricity being more variable. Solar, hydro, and the biomass sources are insignificant amounts at the bottom of the chart.
- Fig. 4, Minnesota Annual Electricity Generation by Source, Proportion of Total: This chart uses the same data as Fig. 3, expressed as a proportion of the total. We can see that the sources that are not considered carbon or renewable (coal, natural gas, and nuclear) are the top three energy sources in 2021, providing a total of 61.5% of the total annual power supply. We do not have detailed data on the sources of imported electricity. Here in Stearns County, Minnesota our electricity comes from a coal-fired power plant in North Dakota. We assume the great majority of imported electricity, with the exception of hydro power from Canada, is not carbon free or renewable. The total proportion of carbon free energy in 2021 was 24.3%, when including other minor biomass sources, and assuming that 10% of imported electricity is carbon free hydro.
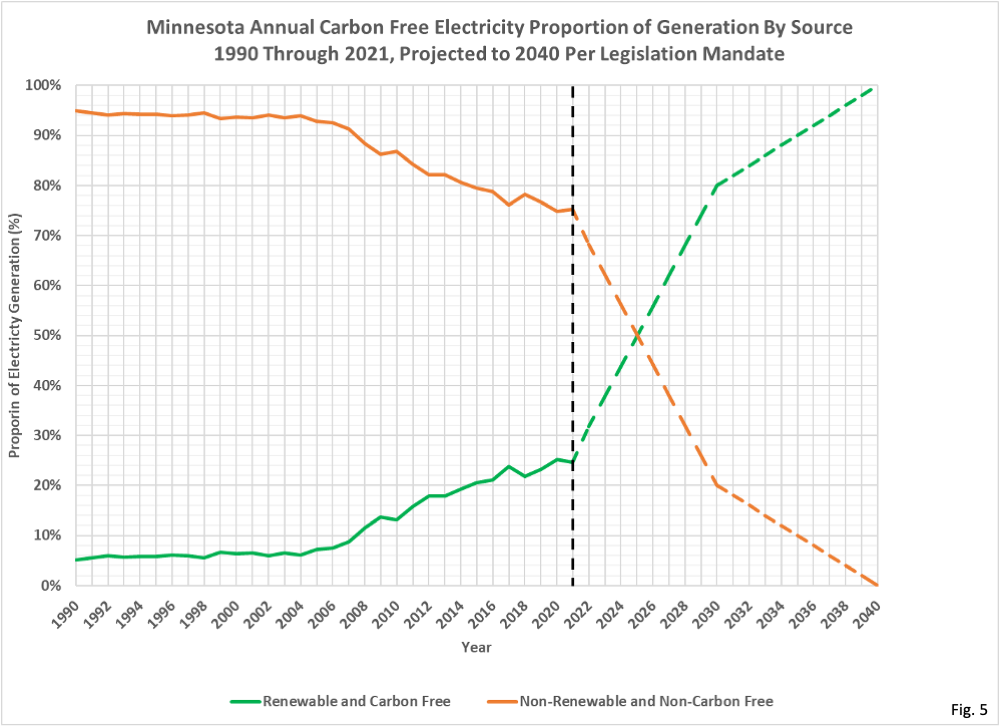
- Fig. 5, Minnesota Annual Electricity Proportion by Source, Carbon Free vs. Non-Carbon Free: We summed the proportion of electricity that comes from carbon free sources (wind, solar, hydro, and biomass, using the definition in the new legislation), using the data from Fig. 4. We then extrapolated the proportion carbon free electricity mandated by the new legislation (80% in 2030, 90% in 2035, and 100% in 2040), shown as dashed lines. We can see that the proportion of carbon free power, which appears to be levelling off leading into 2021, must accelerate greatly to achieve 80% carbon free by 2030. Consider as well that by 2040 many of the older wind turbine generators will be reaching the end of their service life and will need to be repaired or replaced.
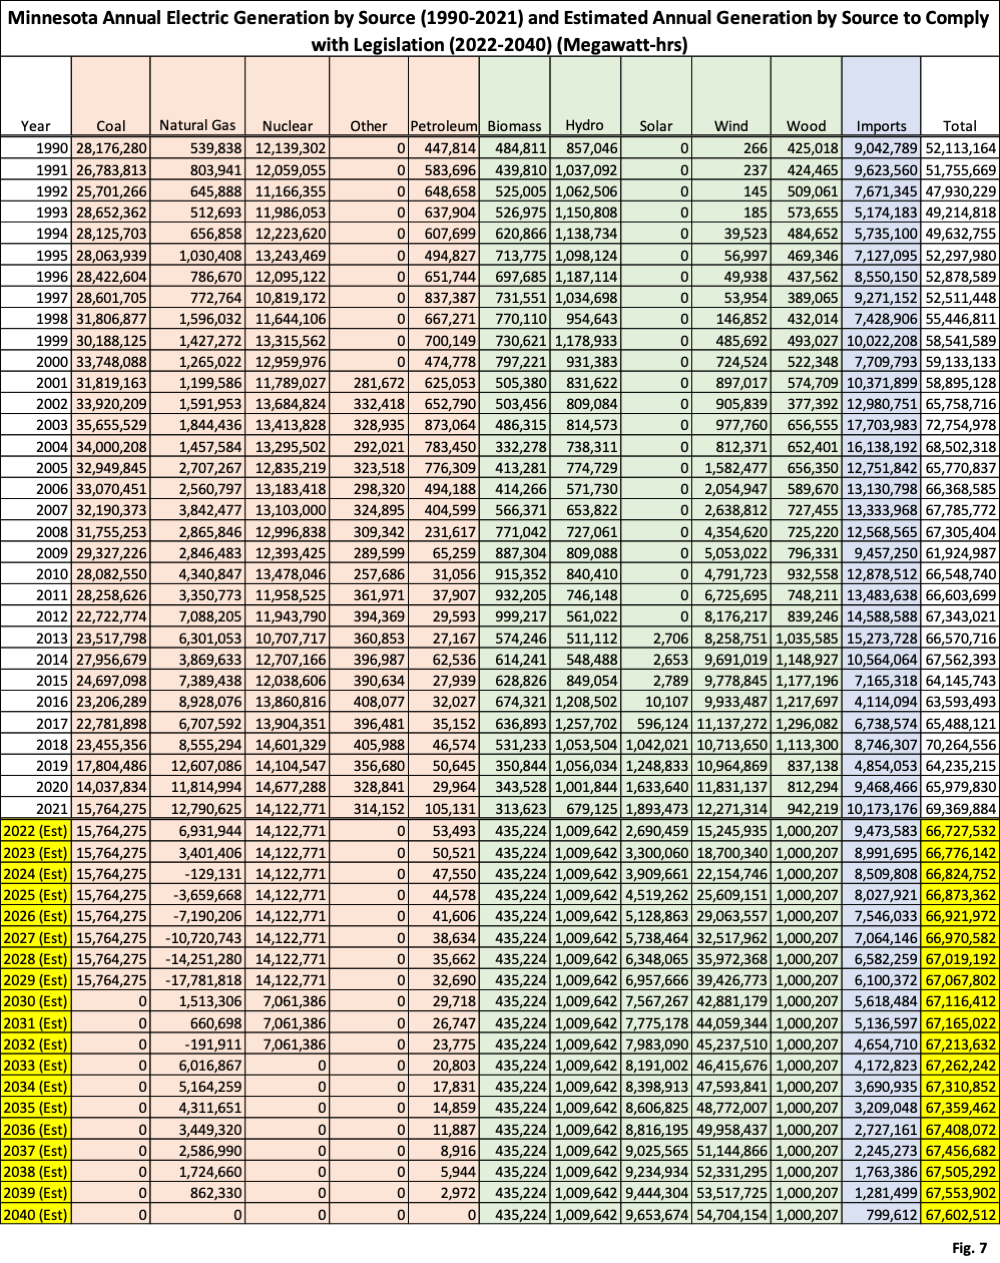
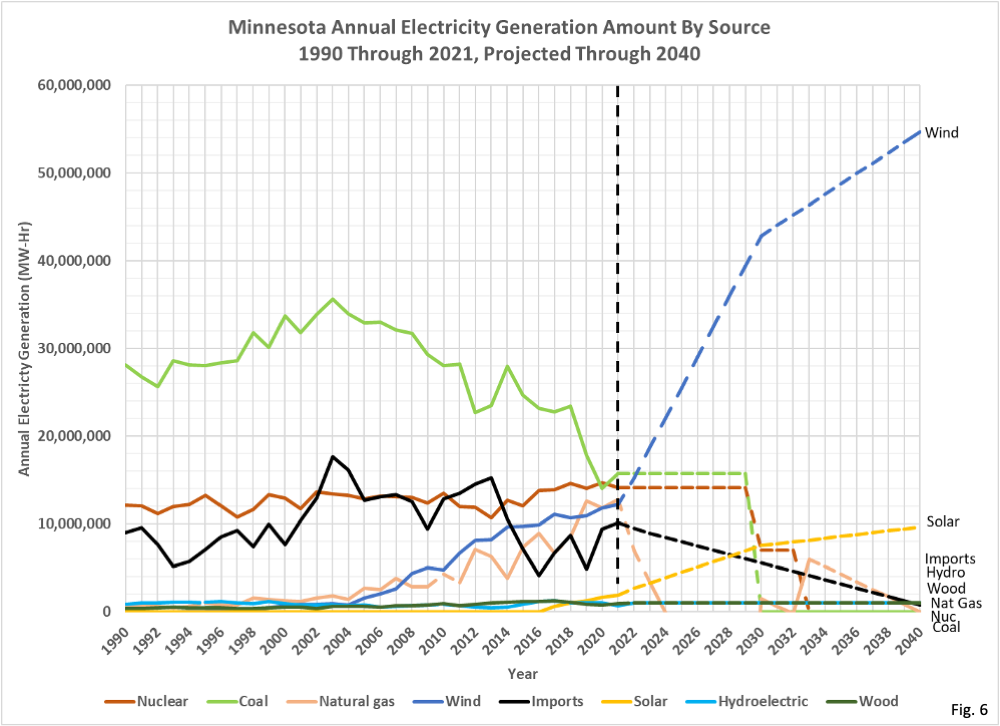
- Fig. 6, Minnesota Annual Electrical Generation by Source, Projected Through 2040: This chart gives our estimate of annual electrical generation, combing the total annual amounts in Fig. 2 with the overall proportions of carbon free electricity in Fig. 5. Obviously there are a host of assumptions that go into this chart. Several assumptions: 1). The two nuclear power plants, not meeting the “eligible energy technologies” definition, will be shut down when their current operating licenses expire in 2030 and 2032, 2). The three existing coal power plants will be shut down as planned by 2030, 3). Imported power is assumed to be 10% carbon free hydro, and will gradually decline to 2040, retaining the imported hydro at a constant rate per year, equal to the average generation from 2017-2021, 4). The ratio in 2021 of wind power to solar power will remain constant on an annual basis to 2040, 5). Hydro, wood, and biomass will remain constant through 2040 (based on the average of 2017-2021), which is reasonable because there has been no increase in these sources in many years and no discussion in public about new projects, 6). Wind and solar will be increased to meet the carbon free standard, and 7). Natural gas will increase or decrease as needed to meet overall demand, before being terminated in 2040.
- Fig. 7, Minnesota Annual Electrical Generation by Source (1990-2021) and Minnesota Annual Estimated Electrical Generation by Source in Compliance with Legislation (2022-2040): This table contains the underlying data used to plot Fig. 6. Besides the assumptions noted for Fig 6 above, also note that the generation amounts are negative from 2025 through 2029 and in 2032. This occurs because, if the carbon free wind and solar requirements are achieved, and if the other energy sources are continued forward as assumed in Fig.6 then Minnesota will have excess electrical power on an annual basis. In the unlikely situation that there really was a surplus of electrical power then it is likely that natural gas and coal power plants would be shut down sooner than planned.
- The amount of electricity required to be supplied by wind and solar in 2040 to meet the carbon free standard, and using the definitions and assumptions described above, are only 4.5 times the amount of wind and solar power generated in 2021. At first, this seems somewhat feasible, although requiring a massive construction effort. However, there are several problems with this analysis. First, this analysis only considers total annual electricity generation. This measurement of annual power generation is effectively an average; 50% of the time we would have too much electricity which would need to be disposed of, and 50% of the time we would have blackouts. Neither condition is conducive to a well-functioning power grid.
- There are several solutions that could be implemented to minimize the blackouts resulting from shortfalls, which will explore in future analyses: 1). Build extra wind and solar capacity to minimize how often there is a shortfall, 2). Use the excess power when the wind does blow to charge batteries to make up the difference when there is not enough wind power, 3). Retain natural gas, nuclear, or coal as backup baseload power, or 4). Build a lesser amount of wind and solar production, and retain natural gas as partial baseload and backup power.

This is appalling and laughable. Why no Nuclear energy??? There would be no life on this planet, and there would never have been any life or any GREEN on this planet without. Nuclear energy. The light and heat of the Sun are generated by a thermonuclear reaction at the center of the Sun. What part of the energy generated by solar panels is not derived from a thermonuclear source???
Don’t forget that all heat will have to be electric in the future also which means that everybody’s will have to get a new type furnace or heating elements Which are way less efficient than natural gas.
From one of my climate and energy mentors:
His closing comment: “Math. Don’t leave home without it.”
https://wattsupwiththat.com/2021/04/16/us-green-impossibilities/
https://wattsupwiththat.com/2023/02/11/the-cost-of-virtue-signaling-the-impact-of-doubling-uk-wind-power/
Good article on Watts up with That – regarding some basic concepts on electric generation from wind and the costs associated with increases in wind capacity.
currently , approximately 24% of electric generation is derived from wind. If the Uk doubled the amount of wind turbines, (ie doubling the wind capacity 2x) the electric generation from wind would only increase by approximately 1/2 of the increase in capacity. Instead of increasing from 24% to 48% via a doubling of capacity, the increase would only be from 24% to 36%. the reason is that a significant portion of time, the wind would generate electricity in excess of what is being used, thus being discarded.
Wind and solar are also highly touted as being less expensive than fossil fuel generation based on the levelized cost of energy computation. One of the deceptions (among many) in the LCOE computation is the all the electricity is assumed to be used thus lowering the average cost per Kw. However, if 20-40% of the electricity is being discarded, then the denominator should only include the electricity being used, instead fo the total electricity generated.
Regarding your comment about buying more electricity from North Dakota. If i remember correctly a law was passed that limits the amount of coal generated electricity that can be bought from North Dakota.