It feels like ancient history now, but you may recall that early in the epidemic CV-19 was wiping out residents of long-term care facilities, who typically are very frail and close to death. Dave Dixon put together a number of charts on the number and proportion and rates of LTC deaths. Recently LTC deaths have ticked up again, so Dave did an updated chart.
 Dave’s notes:
- The Minnesota Department of Health (MDH) provides relatively limited data on the number of cases and deaths occurring for residents of Long Term Care (LTC) facilities. Since 6/30/2022 MDH publishes a cumulative total of LTC deaths attributed to Covid every Thursday. In addition MDH publishes the cumulative number of deaths among jail inmates and among “High-Risk Congregate Care Facilities”, which includes group homes, homeless shelters, etc. The remaining deaths, which make up a large proportion of the deaths, occur for residents of private homes. For purposes of these charts we are grouping all non-LTC deaths together.
- We last published charts on LTC death here on 9/26/2022: https://healthy-skeptic.com/2022/09/26/long-term-care-deaths-4/.
- The cumulative death totals for LTC residents, and non-LTC residents, can be found on the Setting Specific Data page on the MDH Situation Update for COVID-19 web page, here: https://www.health.state.mn.us/diseases/coronavirus/stats/setting.html. Cumulative long term care resident deaths are found in the notes under the “Assisted Living and Skilled Nursing Facilities” graphic. Note that MDH does not report actual LTC deaths by date of death, but only reported cumulative deaths every Thursday. We therefore do not know when the reported LTC deaths actually occurred. By using 4 week rolling averages in Fig. 2 we hope that any errors in the proportions due to mismatched timing of LTC and non-LTC death reports may be minimized.
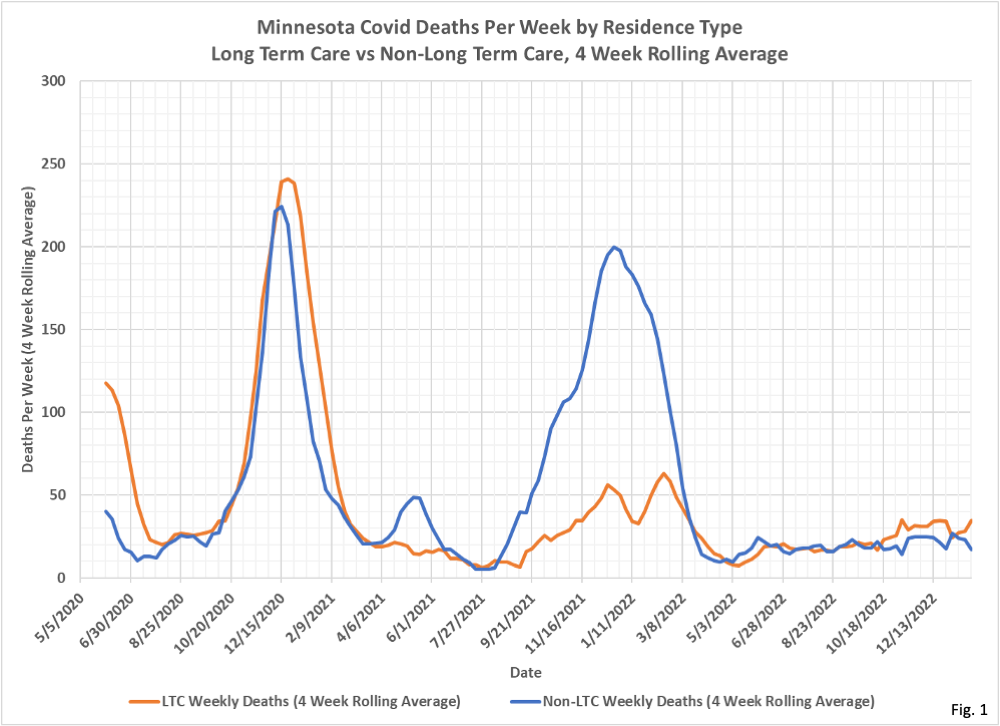
- Fig. 1: This chart displays the average deaths per week of the 4 week period ending on the date on the horizontal axis. It is interesting how different the residence profiles look during the winter 2020/2021 wave in Covid deaths vs. the winter 2021/2022 wave. Is the difference because fewer people were moving into LTC facilities in late 2021 after the way people in LTC were isolated from their families in late 2020? Or was the morbidity of the particular Covid variants that much different? A relatively brief internet search has failed to uncover any detailed LTC facility population data for Minnesota.
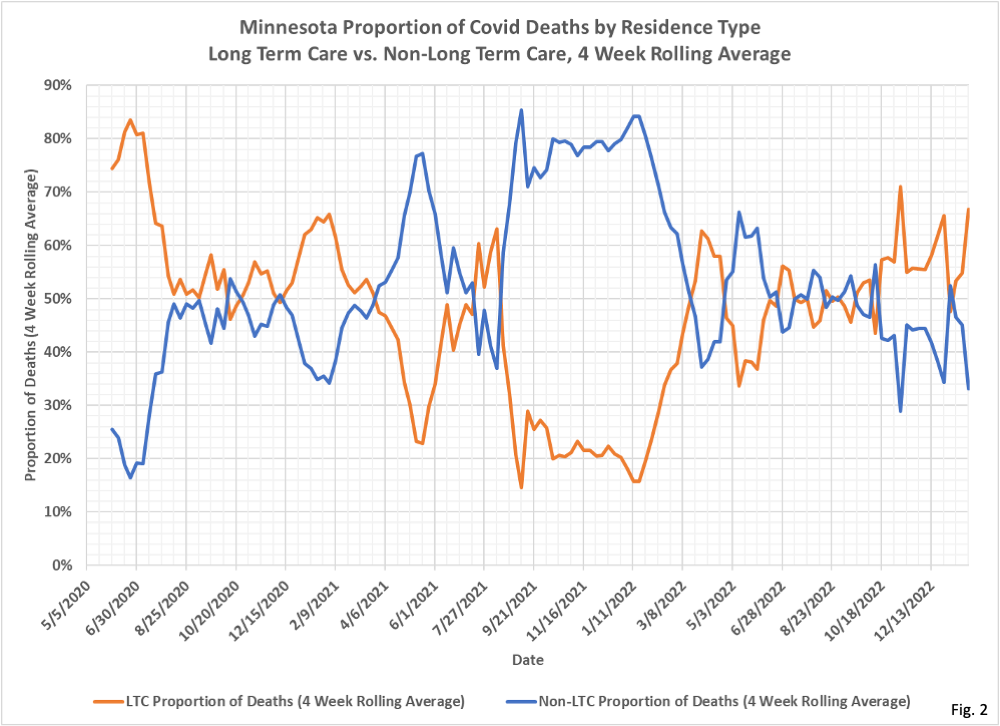
- Fig. 2: The data in Fig. 1 is displayed as simple proportions of the residence type for rolling 4 week periods. Of note, recently the proportion of LTC Covid deaths briefly exceeded 70% of all deaths, the first time that had happened since July 2020. From October 2020 until the present a majority of Covid deaths have been among LTC residents. We still have major questions about how cause of death is assigned, considering that LTC residents generally have serious medical issues to begin with. When LTC deaths are attributed to Covid, was Covid really the underlying cause of death, or just a contributing factor? These are all questions that need further investigatio

I recall a stat from a few years ago that the median (not average) life expectancy of person becoming a resident in a nursing home was 3-5 months for a male and 7-8 months for a female. That did not change significantly with covid. kevin – correct me if you have better info
that is definitely in the ballpark