You will recall we are on a new monthly schedule for publishing these analyses. This report covers data through the week of January 15, due to the DOH processing lag. The data is still presented by week. You can see the steady decline in all events in recent weeks. It really is over, although the scars will linger for an extended time. You will also note that in the most recent week, 6 out of 7 deaths were in the vaxed and vaxed and boosted; as were 74% of cases and 74% of hospitalizations.

 Dave’s notes:
1. This post is an update to the Covid vaccination breakthrough data
table and charts for the overall Minnesota population published on 1/11/2023
here: https://healthy-skeptic.com/2023/01/11/breakthrough-events-january-5/.
This week’s update adds data through the week starting 1/15/2023, published
by the Minnesota Department of Health (MDH) on 2/09/2023. There are very
minor revisions to the past weeks’ data, as is typical.
2. The breakthrough data files are available from MDH here,
https://www.health.state.mn.us/diseases/coronavirus/stats/vbt.html , in the
notes under the graphic images.
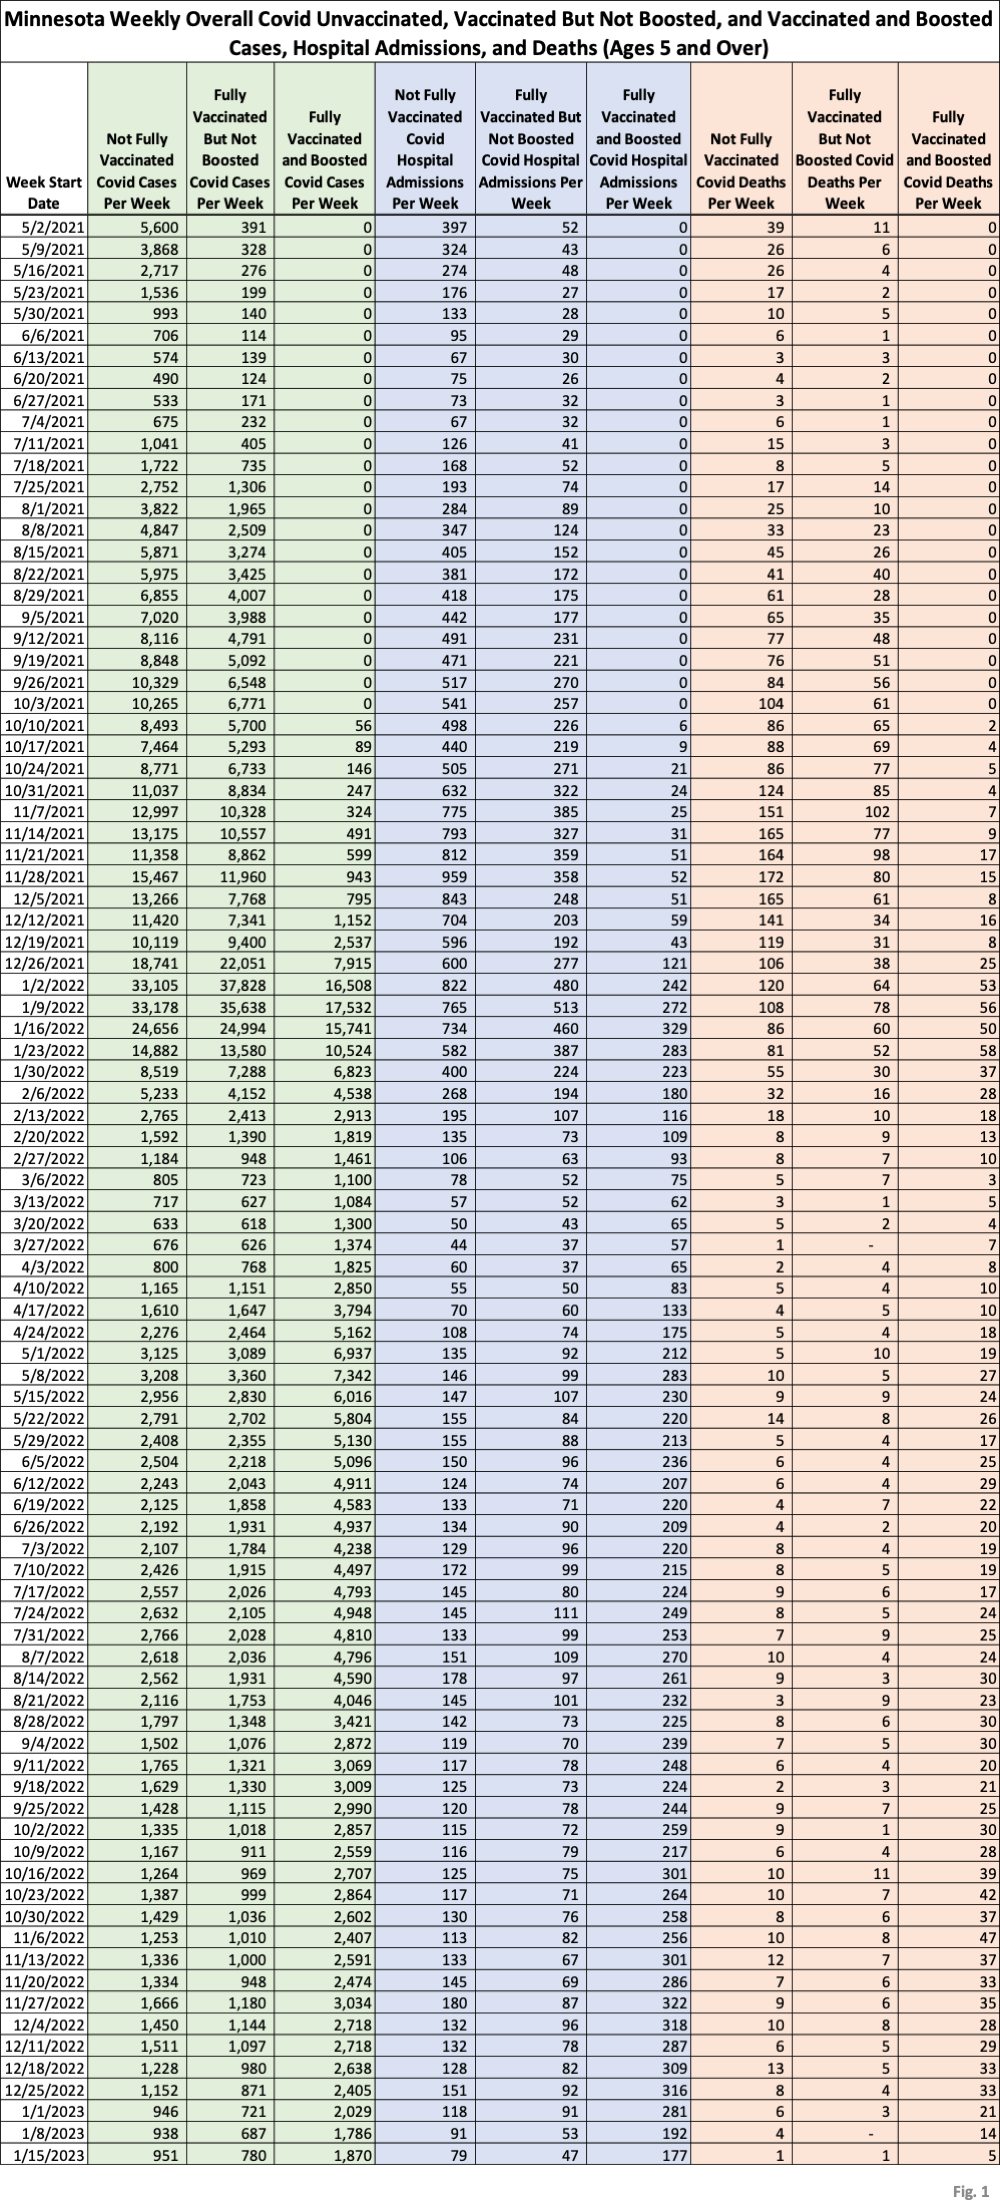
3. Fig. 1, Cases, Hospitalizations, and Deaths Per Week: This table
displays the total cases, hospital admissions, and deaths that occurred each
week among the unvaccinated, vaccinated but not boosted, and vaccinated and
boosted populations. All of the data categories have decreased substantially
since roughly 12/18/2022. Note, however, that the recent weeks of data
appears to be lagging. The last week of reported data, the week of
1/15/2023, there are a total of 3,601 cases total listed for the
unvaccinated, vaccinated, and boosted. However, for this same week in the
new cases by date data file, available on the Cases and Variants page on the
Covid-19 Situation Update web page
(https://www.health.state.mn.us/diseases/coronavirus/stats/case.html), there
said to be 4,009 new cases. Looking back further, the week starting
11/13/2022, Fig. 1 has a total of 4,927 new cases listed in total for the
three vaccination groups. The Situation Update web page lists a total of
5,295 cases for the 7 days starting 11/13/2022. Are reinfection cases
segregated from the vaccine breakthrough case list? It doesn’t seem likely
that simply lagging in reporting is the answer, since we are not seeing any
large revisions to past data. Checking hospitalizations, we see the same
pattern. Fig. 1 has a total of 3030 admissions the week of 1/15/2023 while
the Situation Update web page has a total of 341 the same week. Clearly,
more investigation is needed.
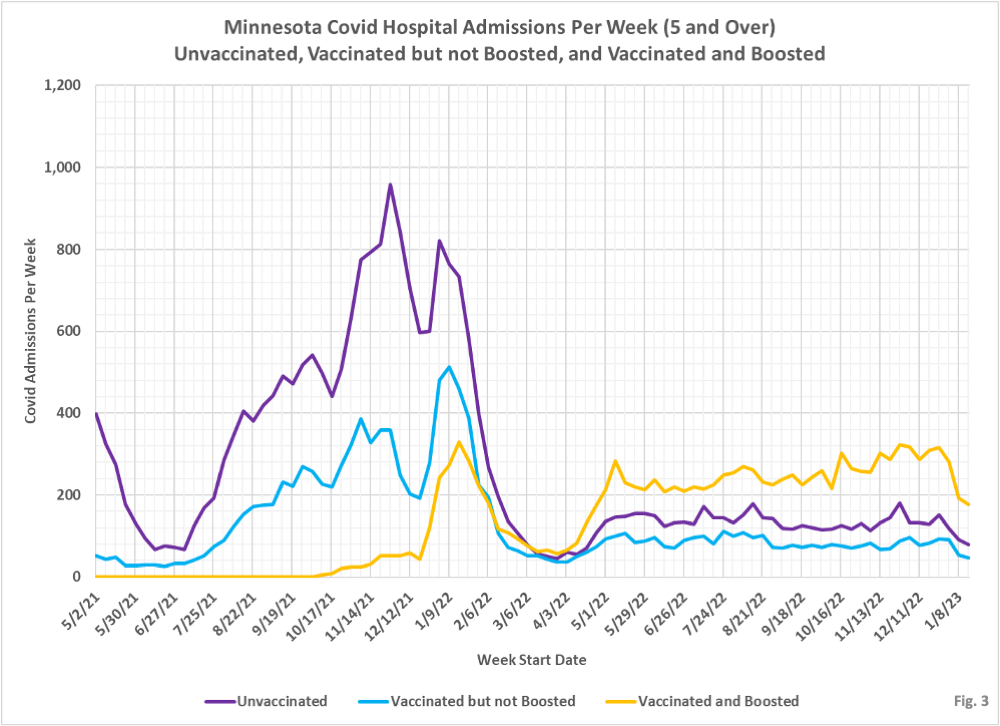
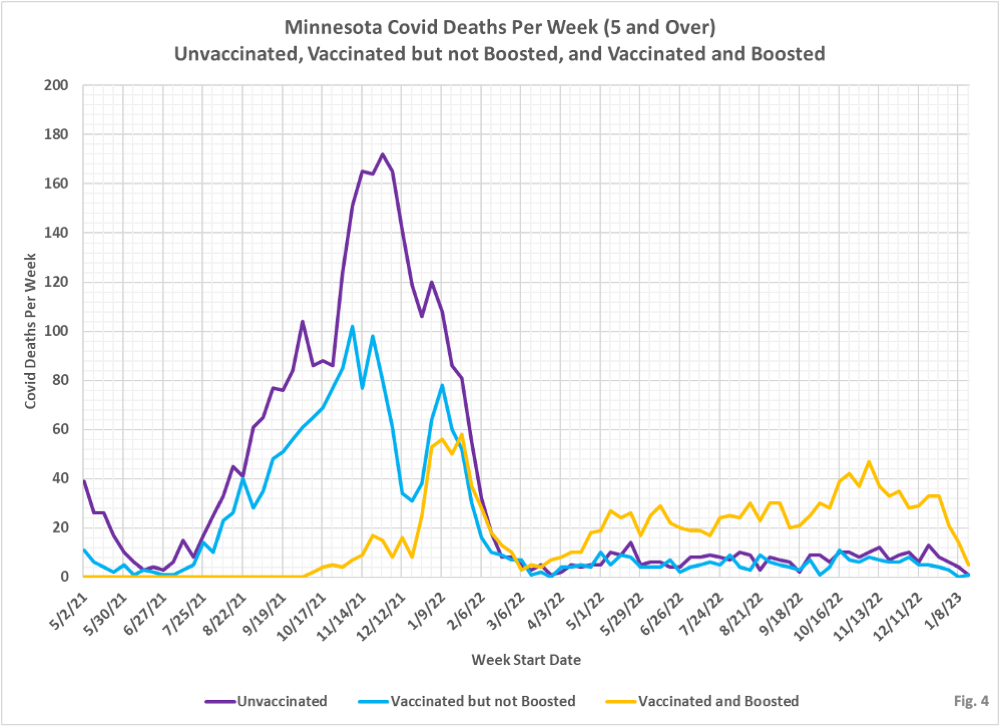
4. Fig. 2 through 4: Charts displaying the cases, hospital admissions,
and deaths over time, using the same data in Fig. 1. The drop in hospital
admissions and deaths in recent weeks is especially dramatic. Hopefully this
is real, and not an artifact of reporting issues.
5. MDH defines the fully vaccinated (what we have termed vaccinated but
not boosted) as those who have not received a booster after completing their
primary vaccination series, and had been vaccinated at least 14 days prior
to testing positive.
6. MDH defines the boosted as those who have received any additional
vaccination shots after completing their primary vaccination series, and
also received the booster at least 14 days prior to testing positive. In
addition, booster doses were only counted after 8/13/2021, the date the CDC
first began recommending booster shots.
