This is a huge amount of work on Dave Dixon’s part and it isn’t easy to even lay the foundation by getting accurate death counts from various sources and dividing them by age and sex. Then it gets even harder to identify a trend, if any, and to separate out changes by cause, across the age and sex groups. In some cases the absolute numbers being worked with are so small that changes are as likely to be random as anything else. In any event, extra kudos to Dave for this ongoing project.
What you will notice is that most of the change in deaths from an epidemic year to the prior year or to 2019, the prior non-epidemic year, can be accounted for by CV-19, but there are deaths beyond those. Some people would claim they were unreported CV-19 deaths, but I don’t believe that for one second. If anything CV-19 deaths have been overcounted.
 Dave’s notes:
1. In this post, part of our continuing series on the topic of Excess Deaths in Minnesota, we present several data tables of basic death statistics available to us from several sources. In our prior posts on Excess Deaths Part 1 (link) and Part 2 (link) we presented the number of deaths per month and per 6-month interval, based on analysis of Minnesota’s death certificates. In Excess Deaths Part 3 (link) and Part 4 (link) we converted these monthly and 6-month interval deaths into per capita death rates. Today, before we move on to more detailed analysis, we will compare our death certificate data to several other data sources to double-check our data.
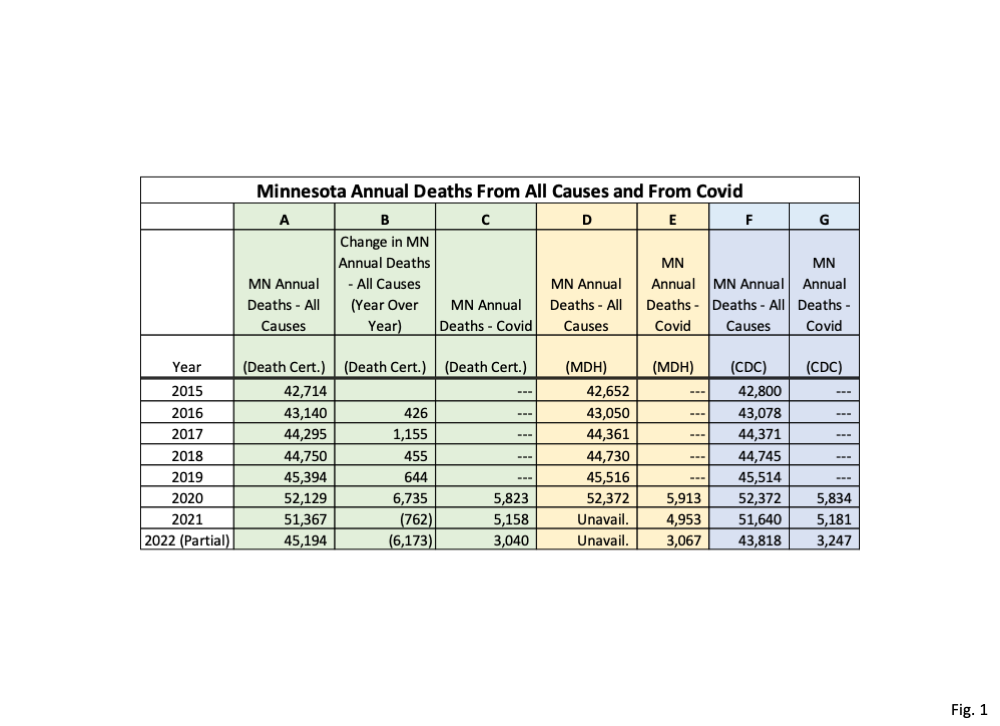
2. Fig. 1, Minnesota Annual Deaths from All Causes and from Covid: In this figure we compare annual death totals in Minnesota from three sources, our Death Certificate data base (green columns), MDH Annual Reports (yellow columns), and CDC Wonder data base (blue columns). Note that deaths in Minnesota from all causes increased by 6,735 in 2020 from the death certificate data base (green columns), while Covid deaths only accounted for 5,823 deaths. We suspect that a large proportion of deaths from Covid are incidental, or only somewhat accelerated in the case of nursing home residents. The implication is that excess deaths make up a large fraction of the increase in deaths in 2020, which we will investigate in the future.
3. None of the three data sources agree exactly, either for annual deaths from all causes or for Covid deaths. There are several sources of error. For example, deaths by Minnesota residents which occur out of state may be accounted for differently in each data base. Similarly, deaths of out of state residents which occur in Minnesota may also differ.
4. Note that all of the data sources are incomplete for 2022. Our death certificate data is from data files supplied to us from MDH on 12/1/2022. 2022 data won’t be considered complete until June 2023.
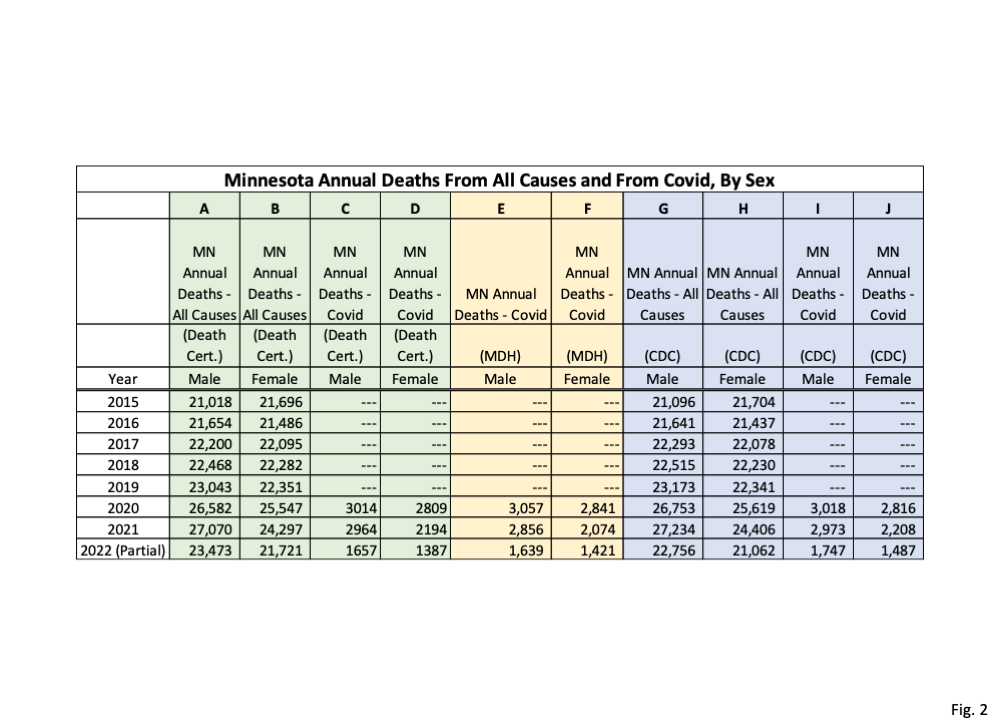
5. Fig. 2, Minnesota Annual Deaths from All Causes and from Covid, By Sex: This figure displays the annual deaths in Minnesota by sex, from the same three data sources used in Fig 1. However, note that MDH does not give us deaths from all causes broken down by sex, only deaths from Covid. As we saw in Fig. 1, there are minor differences in the total numbers of deaths from the three data sources.
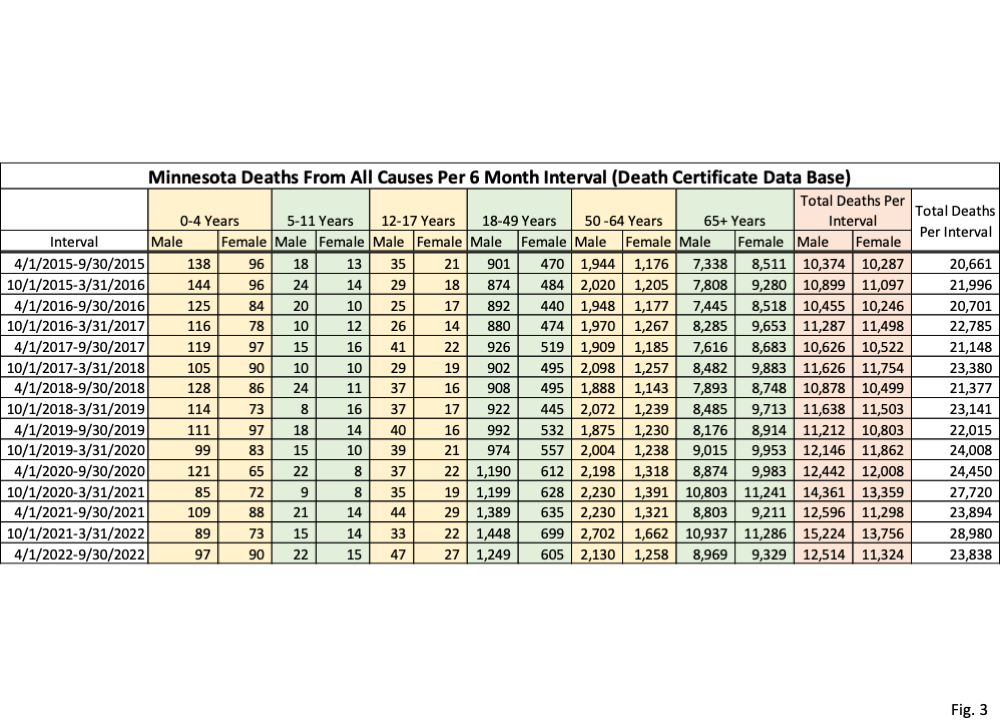
6. Fig. 3, Minnesota Deaths from All Causes Per 6 Month Interval: This figure presents death totals by age and by sex only from the death certificate data base. This table displays the underlying data used in Excess Deaths Part 2, Fig. 3 and Fig. 4 (link). We are documenting these figures because the deaths per 6-month interval will form the basis of our excess deaths analysis going forward.
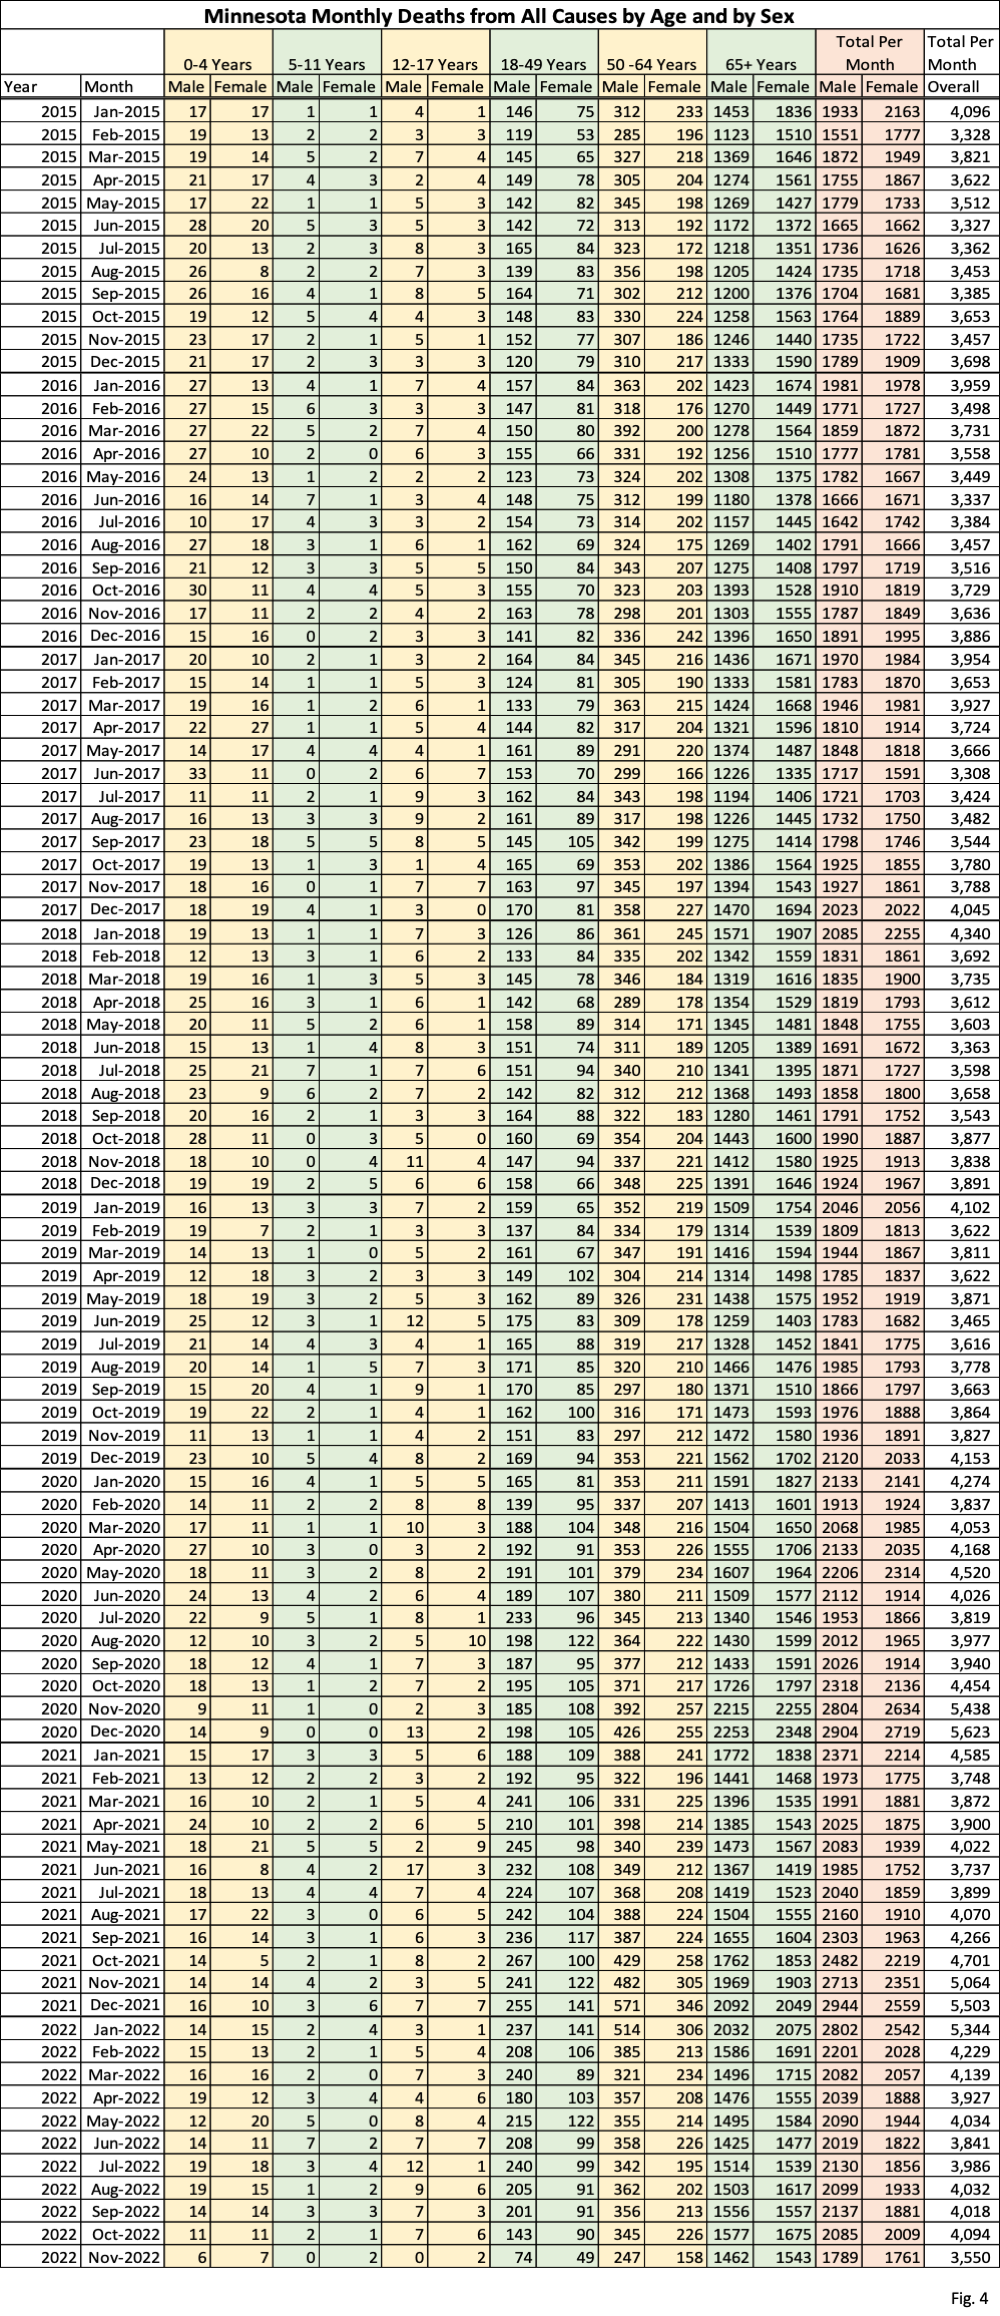
7. Fig. 4, Minnesota Monthly Deaths from All Causes by Age and by Sex: We present the total monthly deaths from all causes just as a way to see the differences in age groups more starkly. The large numbers of deaths each month in the 0-4 year age group remains surprising, with the majority of these deaths occurring in newborns. Even in the 5-11 years and 12-17 years age groups the number of deaths for males frequently exceeds the deaths for females. The higher numbers of deaths for 18-49 year old and 50-64 year old males than for females also stand out. Only when we get to the 65+ age group do female deaths exceed male deaths, because of the larger female population in this age group.
Data Sources:
1. The death certificate data (Columns A through C of Fig. 1, Columns A through D of Fig. 2, Fig.3 and Fig. 4) comes from collaborators who have analyzed Minnesota death certificates. A database of annual death certificates can be ordered from the Minnesota Office of Vital Records (link). Death certificate data used in these tables was provided by the Office of Vital Records on Dec. 1, 2022. Because of reporting lags there is likely to be incomplete data in the last several months of data.
2. Annual death data from all causes (Column D of Fig. 1) are obtained from the Minnesota Department of Health (MDH) Annual summary of Minnesota health statistics (link). This web page has annual reports from which we copied annual deaths. Unfortunately, these reports do not provide us with annual deaths by sex.
3. Annual Covid death data (Column E of Fig. 1, and Columns E and F of Fig. 2) are obtained from the Mortality Rate by Sex (CSV) data file available on the Mortality page of the COVID-19 Situation Update web page (link).
4. CDC deaths from all causes (Column F of Fig. 1, and Columns G and H of Fig. 2), are obtained from the CDC Wonder data base (link).
5. CDC Deaths from Covid (Column G of Fig. 1, and Column I and J of Fig. 2) are taken from a CDC provisional Covid data File (link). Data from weeks spanning across month-end and year-end are assumed to occur equally throughout the week.

Nice job putting all of this data together. One item I’d be curious about is the average age of a death from COVID vs the average age of a death from all other causes. I don’t remember the source, but a study I saw a long time ago had the average age of a COVID death the exact same as the average age of the average death right down to the tenth of a year. Assuming the data in that study was accurate, it was obvious that the medical establishment was calling a large # of deaths due to COVID when it likely had nothing to do with COVID.
the average age of CV-19 death is higher than the overall average of death, especially if you consider the people for whom CV-19 actually contributed to their death. YOu are right that a lot of deaths had nothing to do with CV-19.
Good try but Dave is working with fraudulent inaccurate data. It’s documented that very few healthy people died from Covid, but there were a lot of deaths caused by improper treatment and dangerous drugs used in hospitals. The hospitals and doctors are now being sued for this as it’s proven- http://www.myflcv.com/HW291.html & http://www.myflcv.com/CVtreat.html The proof that the data are fraudulent and overstate covid deaths and “deaths to unvaccinated people” is http://www.myflcv.com/CDCFDAPF.html
wow, fraudulent data, who knew. Lot of deaths caused by drugs and treatments, another stunner. What is wrong with people when they go read some obvious crap on the internet, don’t bother to vet it at all, just assume it must be true, and then spread it? Do us all a favor and don’t do that on this blog.