The starting point for any analysis of “excess” deaths, or any change in the trend of deaths is simply to catalog the total number of deaths and begin a rudimentary breakdown by basic categories like age and sex. Dave Dixon usual excellent data gathering and analytic skills at work. Seasonality, especially in the older age group, likely due to flu and other respiratory viruses, which peak in the winter, and to other bad effects of cold weather on the elderly. You see the obvious CV-19 death spikes, followed by somewhat lower death levels.
And in the DEI era, on behalf of real males everywhere, I want to protest the lack of equity in death rates and I demand that trillions of dollars be spend to get female death rates up to male ones.
 Dave’s notes:
- In this post, envisioned to be the first in a series of posts over the coming weeks, we will start to investigate the topic of deaths in Minnesota. Today will start by looking at deaths from all causes. In the future we will look at how deaths in different age groups and for different causes of death changed before and after the start of the Covid pandemic.
- The data used in today’s post comes from collaborators who have analyzed Minnesota death certificates from 2015 through 2022. A data base of annual death certificate data can be purchased from the Minnesota Department of Health (MDH) Office of Vital Records (https://www.health.state.mn.
us/people/vitalrecords/index. html). These death certificate records include a vast amount of personal information, including name, maiden name, age, birth date and location, address, spouse name, place of death, and many other details. Most importantly, for our purposes, we are also given the cause of death and other contributing factors listed on each death certificate. Deaths certificate data from the years 2015 through 2022 have been sorted, categorized, and analyzed by our collaborators. - Although we have partial death data for November 2022 we have terminated the charts in October 2022. It is likely that the October data is incomplete, and there may be changes in earlier months in the future as we get updated death certificate data from MDH.
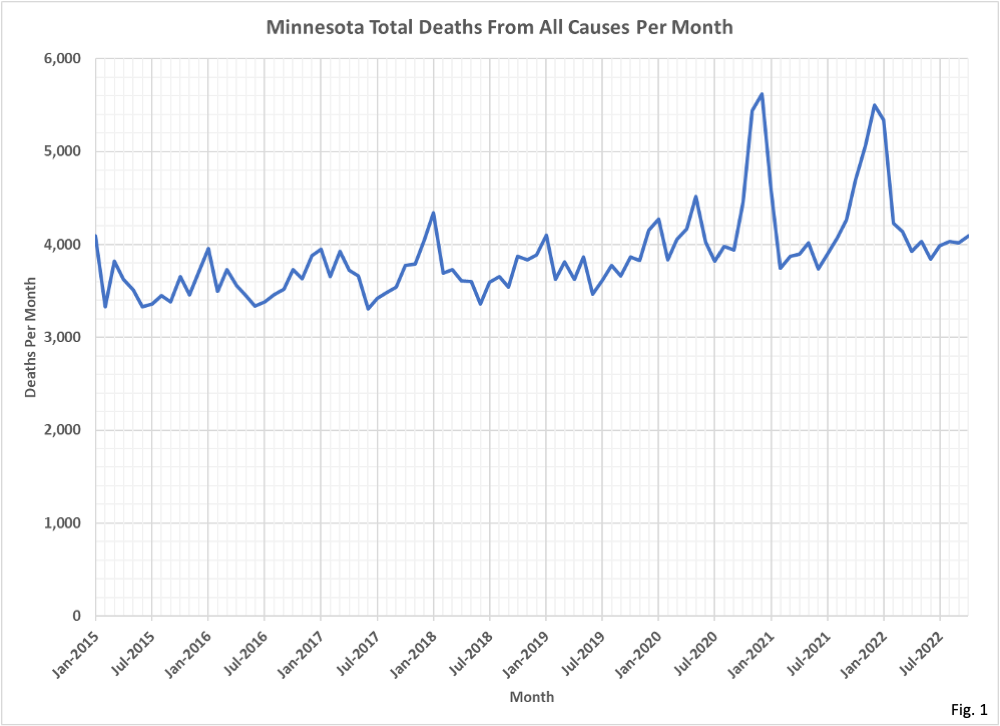
- Fig. 1, Minnesota Deaths From All Causes Per Month: In this chart we are simply displaying the deaths in Minnesota each month, from all causes. By visual examination, we can see that there appears to be an upward trend in deaths each month from 2015 through 2019. The two sharp spikes in deaths in late 2020 and late 2021 correspond to the surges in Covid cases and deaths that occurred at the same time. It appears that there may be periods of reduced deaths immediately after these two Covid-related spikes in deaths. If true, this would indicate that Covid had a ‘pull forward’ effect on deaths, especially for Long Term Care facility residents. These will be topics for future analysis.
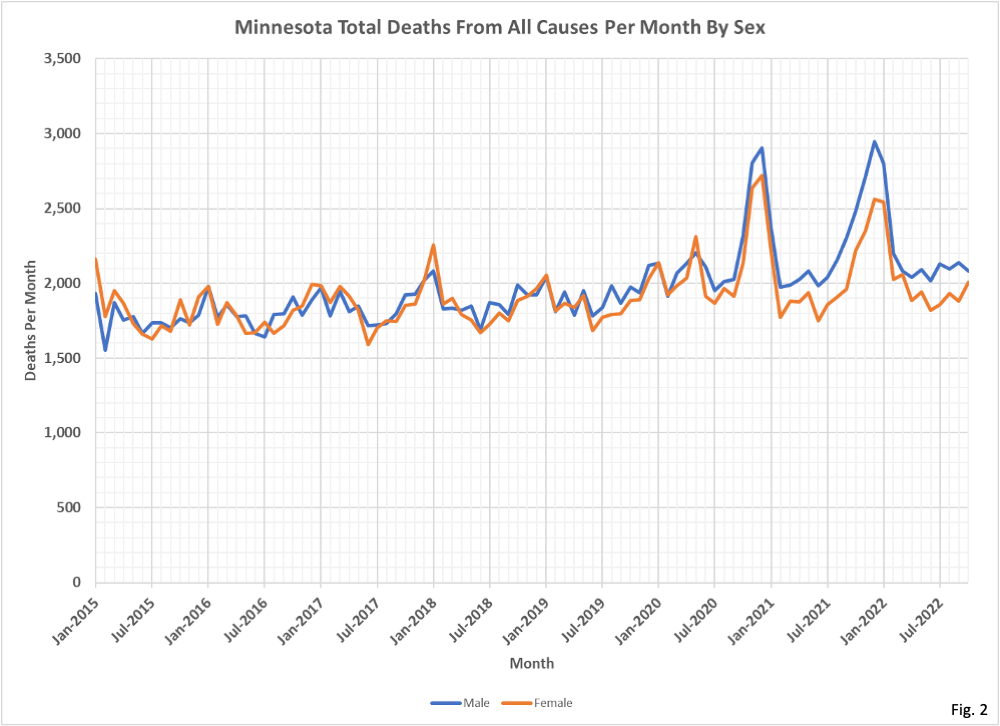
- Fig. 2, Minnesota Deaths From All Causes Per Month, By Sex: This chart displays the same data as Fig. 1, broken down by sex. It is interesting that the male and female deaths follow the same general trend and magnitude from the start of 2015 through July 2020. Starting in July 2020 deaths for males appear significantly greater each month than for females. This difference in male and female deaths continues even after the large spike in Covid-related deaths in late 2020 and late 2021 subsided, indicating that perhaps non-Covid deaths are greater for males than females since 2020. This will definitely be a topic of future investigation.
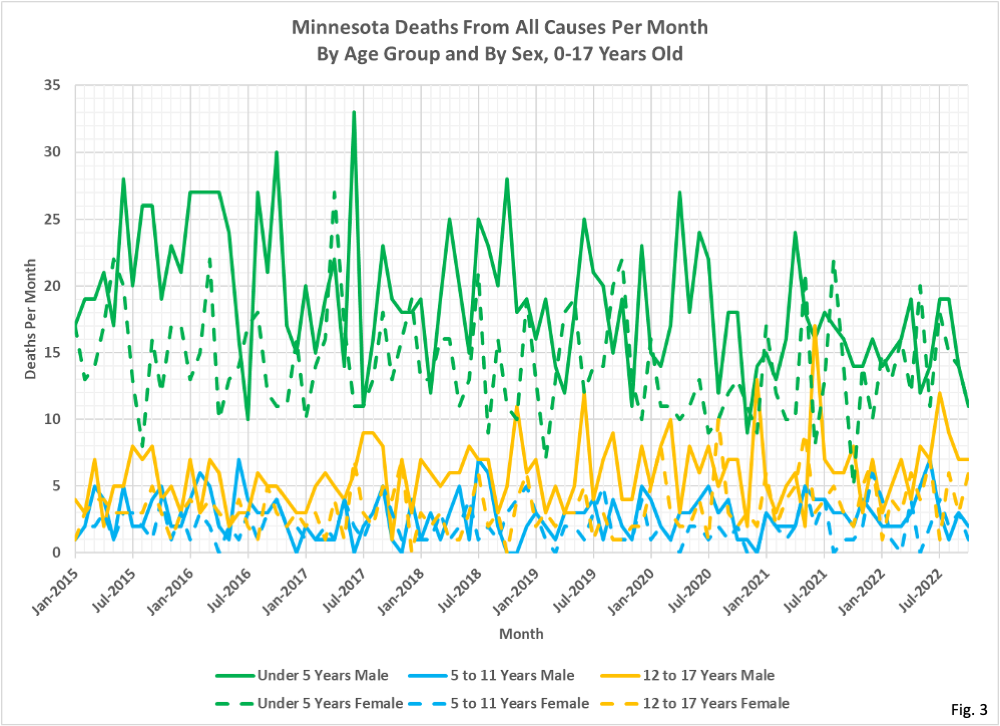
- Fig. 3, Minnesota Deaths From All Causes By Age Group and By Sex, 0-17 Years Old: Breaking down the death certificate data from Fig. 2 further, in Fig. 3 we have the number of deaths each month by age and by sex for the pediatric age groups. We are using the same age groups that MDH uses in reporting Covid deaths. We note that there are generally more male deaths than female deaths in these age groups each month. Note also that a majority of the deaths in the Under 5 age group actually occur at less than 1 year old. In fact, over the entire 2015-2022 time period, an average of 84% of the deaths in those under 5 years of age actually occur at less than 1 year of age. This seems like a shocking number of deaths for newborns in what is thought to be a relatively healthy state with a modern medical system. It does appear, however, that there is a downward trend in the number of deaths in the 0-5 year age group.
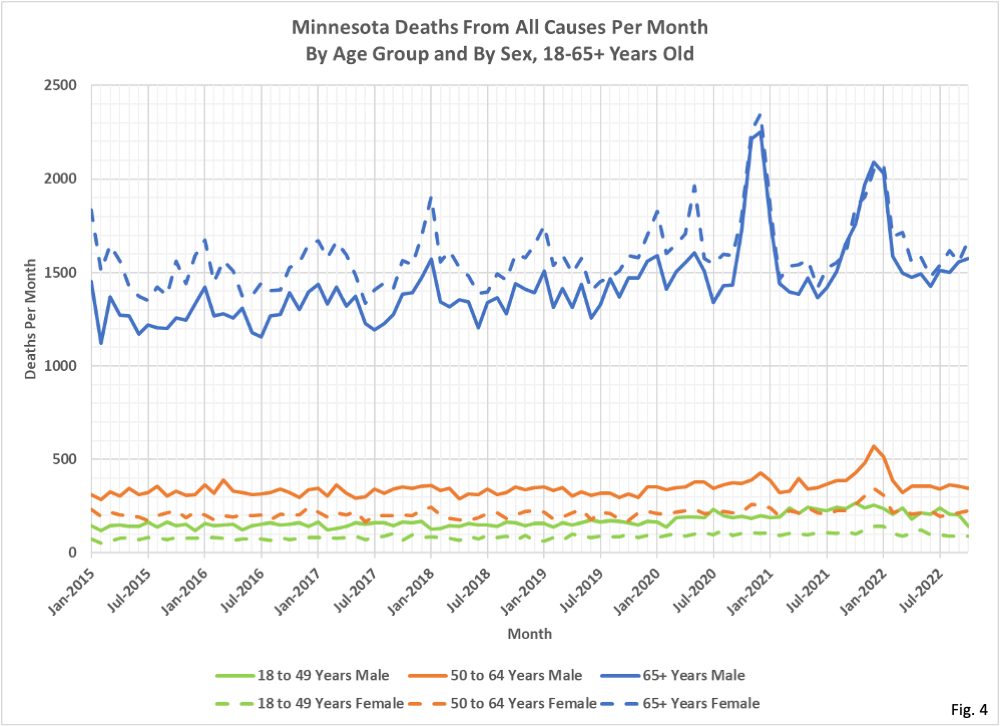
- Fig. 4, Minnesota Deaths From All Causes By Age Group and By Sex, 18-65+ Years Old: Finally, in Fig. 4 we display the number of deaths each month for those 18 and older, again using age groups used by MDH to report Covid data. We note that there are more male deaths than female deaths in the 18-49 and 50-64 age groups, but this reverses in the 65+ age group. There are more female deaths than male deaths in the 65+ age group mainly because the female 65+ population is much larger than the male population. More of the males died off at younger ages. Note, however, that during and after the two Covid-related spikes in late 2020 and late 2021 that there were almost equal numbers of deaths between the 65+ males and female groups, despite the male population being much smaller. This means that the per capita death rates for 65+ males was much higher than for females in 2020 through 2022. This will be another topic for future investigation.
- Note in Fig. 4 that there appears to be a seasonality effect in the numbers of deaths for those 65 and older, both male and female. Deaths tended to peak in January in 2015 through 2020, before Covid dominated the trend in deaths in the spring of 2020. The number of deaths appear to be lowest for the 65+ each year in June or July, also through 2020. This seasonality effect is not visually apparent in the younger age groups, but we will analyze seasonality in detail in the future.

Finally, someone makes a graph with many lines on it that are substantially different colors (blue, yellow, green) and design (solid, dotted). That means one can read the differences even though, in this case, the data is necessarily cramped since you’re using 8 years of monthly data, with a lot of variability. I appreciate that.
There appears to be a relatively stable increase in male deaths in both the 18-49 and 50-64 cohorts, regardless of COVID peaks, starting in January 2020. Some combination of overdose deaths and homicides, both of which seem to primarily affect males, especially in the 18-49 cohort? I understand that this is outside the scope of the typical analysis done here, but it may b worth a cursory analysis, since they may be confounding factors for younger male cohorts.