With the hubbub about a winter CV-19 wave, Dave and I thought it might be a good time to revisit the regional charts we have done in the past.

 Dave’s notes:
- This post is an update on regional cases that we last posted on 6/06/2022 here: https://healthy-skeptic.com/2022/06/06/regional-cases-june-4/. In todays post we update the data as of 12/8/2022, and add charts for hospitalizations and deaths by region. In general, no region of the US appears to be undergoing any dramatic increase in Covid activity, in contrast to several media reports we have seen recently. Hospitalizations are increasing, but are still much lower than levels seen as recently as July.
- Since we last posted on the topic of US regional Covid cases the CDC has revised its reporting data bases. Case data now comes from the data base “Weekly United States COVID-19 Cases and Deaths”, available here: https://data.cdc.gov/Case-Surveillance/Weekly-United-States-COVID-19-Cases-and-Deaths-by-/pwn4-m3yp. Hospitalization data is downloaded from the “COVID-19 Reported Patient Impact and Hospital Capacity” data base available here: https://healthdata.gov/Hospital/COVID-19-Reported-Patient-Impact-and-Hospital-Capa/g62h-syeh/data. Deaths data is from “Provisional COVID-19 Death Counts by Week Ending Date and State”, available here: https://data.cdc.gov/NCHS/Provisional-COVID-19-Death-Counts-by-Week-Ending-D/r8kw-7aab. We may in the future take the deaths data from the same database that case data is taken from.
- State population estimates used to calculate rates per 100k are taken from the CDC data file nst-est2019-01.xlsx, available here: https://www.census.gov/newsroom/press-kits/2019/national-state-estimates.html. We have recently been critical of the Minnesota Department of Health (MDH) for using 2019 population estimates in 2022, and we will ultimately need to update the state population estimates monthly or annually. Like MDH we never anticipated that COVID-19 would be a topic of interest in 2022, going into 2023.
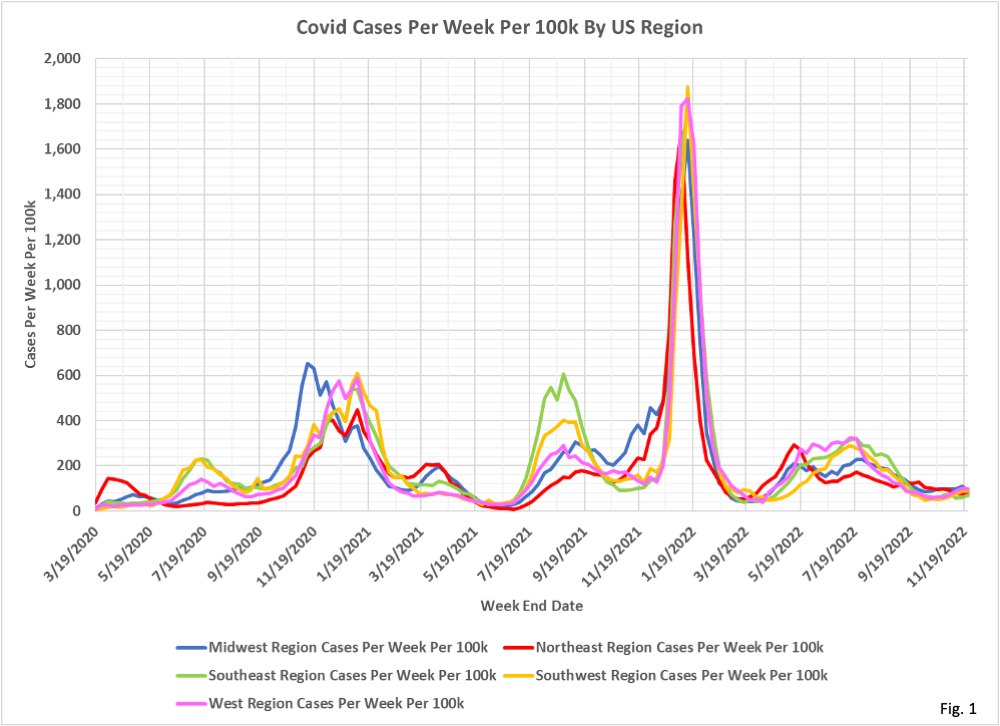
- Fig. 1, Covid Cases Per Week Per 100k by US Region: The Omicron wave in late 2021/early 2022 stands out in all regions.
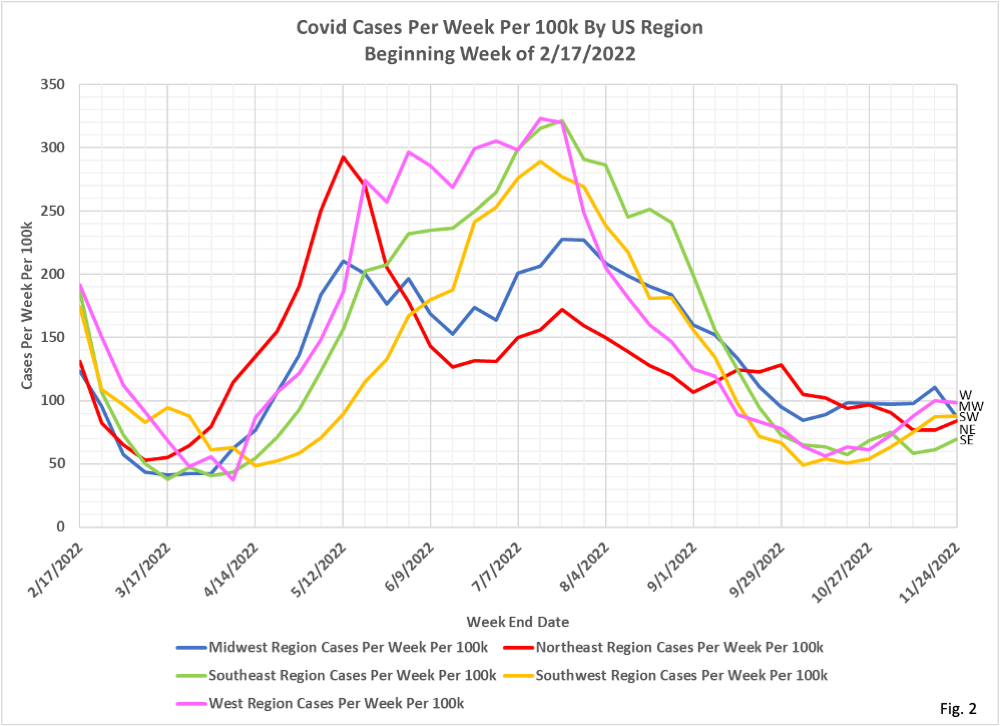
- Fig. 2, Covid Cases Per Week Per 100k by US Region, Beginning 2/17/2022: When we look at just recent months, we can see that current cases levels in all regions are lower than this past summer, and do not appear to increasing dramatically in any US region.
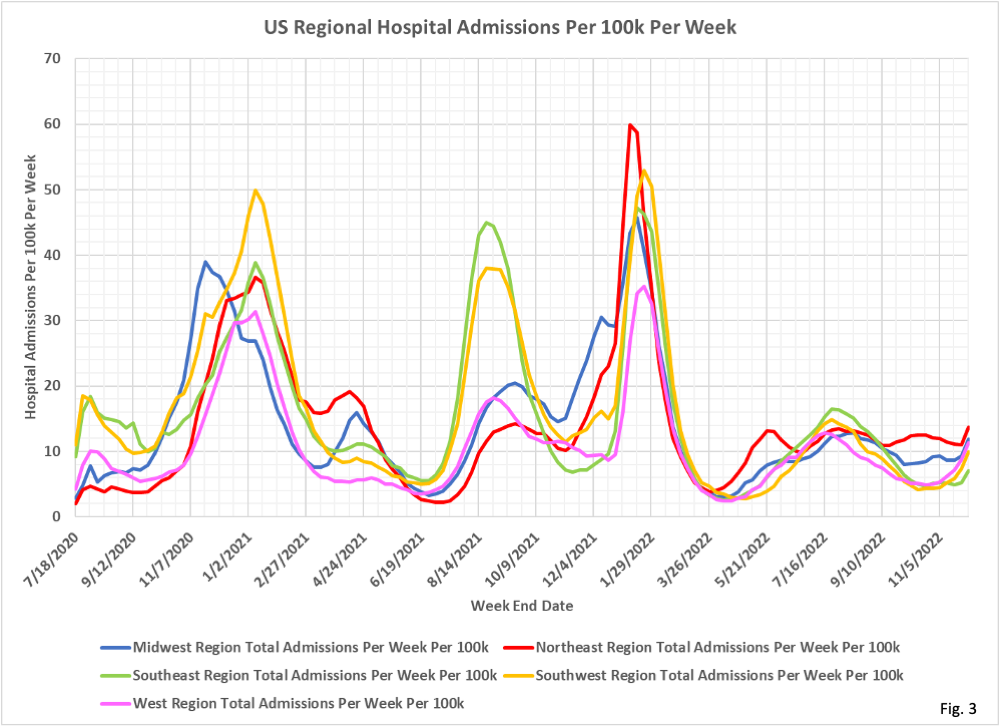
- Fig. 3, Covid Hospitalizations Per Week Per 100k by US Region: When looking at hospitalizations the Omicron wave in late 2021/early 2022 is proportionally less severe than earlier waves, comparing the peaks in the hospitalizations with the peaks in cases in Fig. 1.
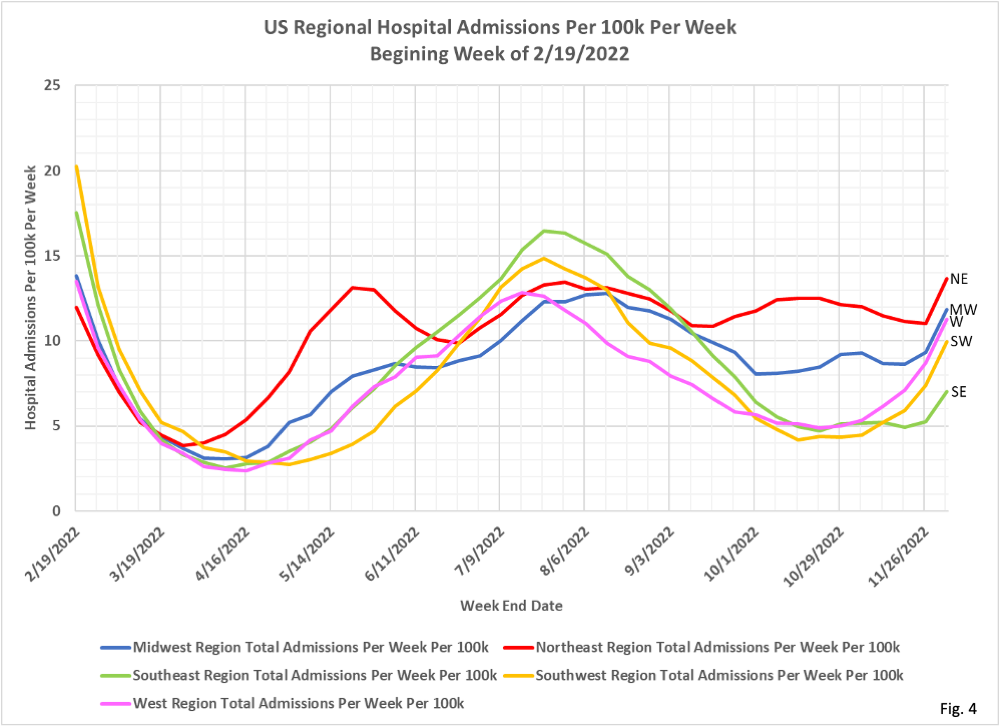
- Fig. 4, Covid Hospitalizations Per Week Per 100k by US Region, Beginning 2/19/2022: While hospitalizations are currently increasing in all regions, they have only reached the levels last seen in July 2022, and are far below the levels seen during the Omicron wave in early 2022.
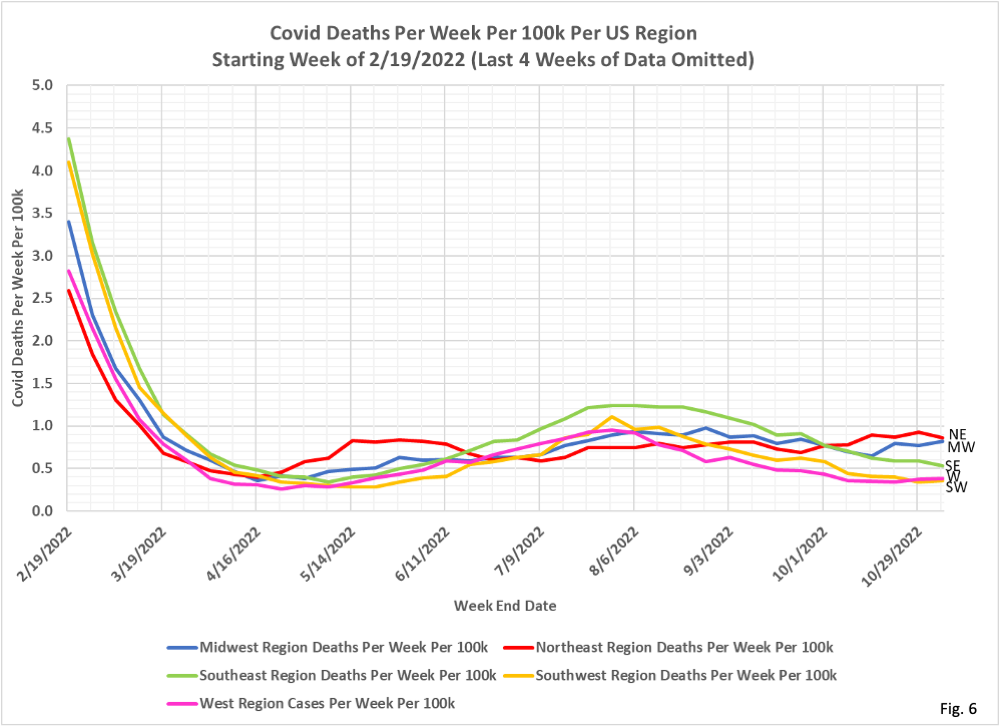
- Fig. 5, Covid Deaths Per Week Per 100k by US Region: Deaths per 100k in all regions have been consistently low in all regions since March 2022.
- Fig. 6, Covid Deaths Per Week Per 100k by US Region, Beginning 2/19/2022: No increase in Covid deaths observed through the week of 11/5/2022, the last week we are plotting.
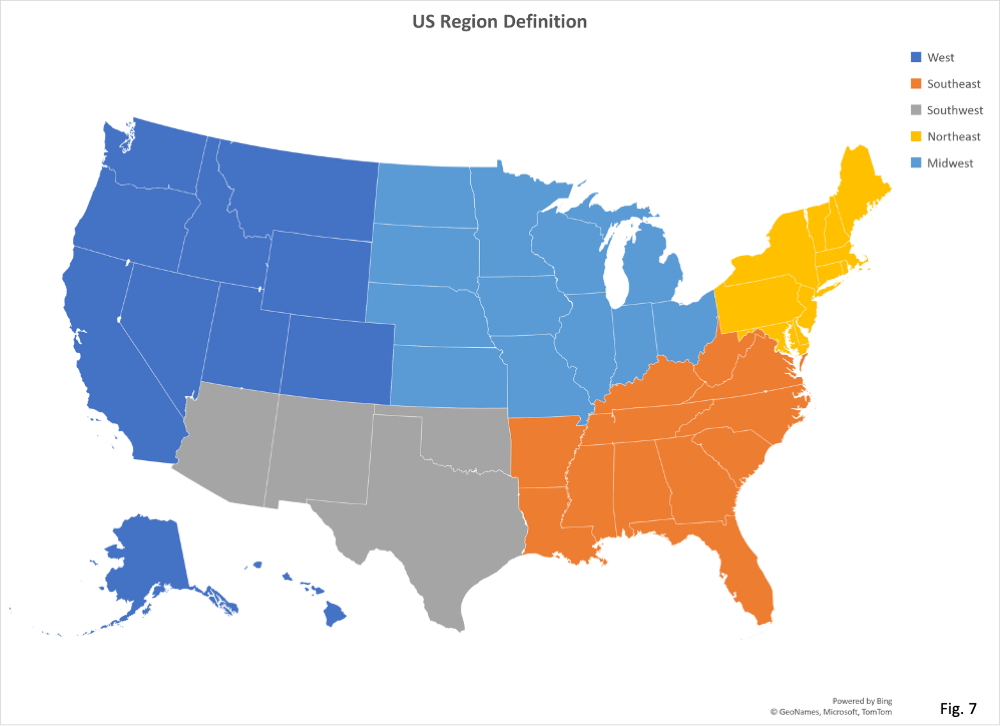
- Fig. 7, US Region Definitions: The CDC has various regional definitions for administration and for various diseases, including for COVID-19. These regions did not make complete sense to us, so we have taken the liberty of defining our own regions, as displayed here.
