Here is what the relative event rates would look like if the 2021 one-year Census population estimates were used for Minnesota instead of the five-year 2019 estimate that DOH uses. As we anticipated, the change for the 65 and over group is dramatic. In the October event data week, for example, (and which should be using 2022 data, which we will extrapolate to in a future post) the move from what is really a 2017 age 65 and over population estimate to a 2021 one takes the number of unvaccinated persons from about 62,000 to over 162,000. It takes the cases per 10o,000 people from 396 to 151, the hospitalizations from 71 to 27 and the deaths from 4.9 to 1.8. The case rate is now lower than that for vaxed population and equal to that for the boosted. The hospitalization rate is far lower that for the vaxed and almost equal to that of the boosted population. And the death rate goes from 4.9 to 1.8, equal to that for the vaxed group and below that of the boosted population.
If we look at the table for the first week in January, we see a large effect, but a more protective benefit from vax and boosters. Here the 2021 population is likely the best to use. We also can see just how large that Omicron wave was. Case rates in the unvaxed go from 1894 to 818, below the vaxed population but substantially above the boosted rate. Similarly, hospitalization rates go from 330 to 142, but are somewhat above the vaxed rate and far above the boosted rate. Deaths have a steep rate decline from 109 to 47, but remain well above the vaxed rate and many multiples of the boosted rate.
The difference in relative rates from the start of 2022 and the fourth quarter is itself quite dramatic and reflects the rapid lessening of effectiveness of both vax and boosters. As you would expect, since boosting tends to be much more recent, the vaxed only rate drops much faster than the boosted rate. An interesting confounder is the relative rates of prior infection, but DOH, even though it has the data, steadfastly refuses to release it.

 Dave’s notes:
1. Nothing in this discussion is meant to imply that the Minnesota Department of Health (MDH) is intentionally distorting or misleading the public in its presentation of Covid data. However, the population assumptions used for calculating the vaccine breakthrough statistics can have a massive impact on calculated Covid case, hospitalization, and death rates per 100k, mainly for the 65+ age group. In this post we examine the result of using the 2021 US Census Bureau population estimate for Minnesota, which we believe to be correct for this analysis, instead of 2019 US Census Bureau estimate as used by MDH.
2. In a recent post we describe the two US Census Bureau population estimate types, the 5-Year estimate as used by MDH, and the 1-Year estimate which we believe is the most appropriate for the purpose of calculating unvaccinated populations in 2021 and 2022. MDH calculates the unvaccinated population in each age group by taking the age group population from the 2019 US Census Bureau 5-Year estimate and subtracting the vaccinated and the boosted populations, as explained in the Data Definitions section of the Vaccine Breakthrough web page (https://www.health.state.mn.us/diseases/coronavirus/stats/vbt.html). For the 65+ age group, which is vaccinated or boosted to a very large degree, the resulting unvaccinated population is very small. Therefore, even relatively small variations in the assumed baseline population of the 65+ age group will have a very large impact on the calculated size of the unvaccinated population, since all variations in the baseline population will flow through to the calculated unvaccinated population.
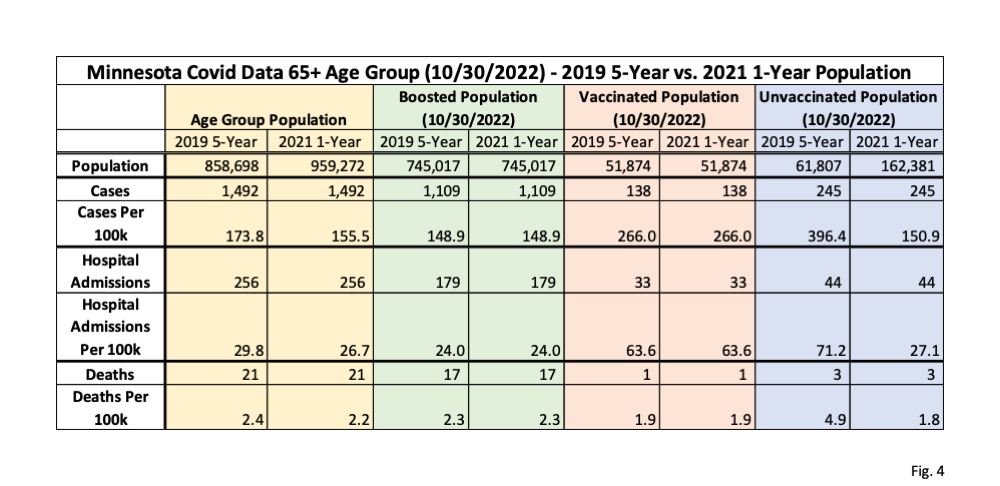
3. MDH states on their Vaccine Breakthrough Data web page (https://www.health.state.mn.us/diseases/coronavirus/stats/vbt.html) that the 2019 US Census Bureau American Community Survey (ACS) 5-year estimate is used as the population basis for Minnesota. As we explain in a recent post the 2019 ACS 5-year estimate is based on data collected from 2015 to 2019. It is effectively an average population estimate of the 2015-2019 time period, not a population estimate for the year 2019 based on 2015-2019 data. Because the 65+ population has increased almost linearly since 2010 the ACS 5-Year estimate effectively is an estimate of the 65+ population in the middle of 2017, and is significantly lower than the 2021 ACS 1-Year estimate. The 2021 ACS 1-Year population estimate is in fact a population estimate for the calendar year 2021. In the charts above we examine how the use of the 2021 ACS 1-Year estimate instead of the 2019 ACS 5-Year affects the calculated breakthrough rates. The 65+ unvaccinated population, using the 2019 ACS 5-Year population and subtracting the vaccinated and boosted population, was 61,807 on 10/30/2022. However, using the 2021 ACS 1-Year population for the 65+ age group as a basis, the unvaccinated population was actually 162,381, an increase of 100,574, or an increase of 163% (these numbers shown in Fig. 4). This increase in the unvaccinated population then causes the rates per 100k for cases, vaccinations, and deaths for the 65+ population to be significantly lower than previously thought, as shown in the three charts above. Because the unvaccinated populations are relatively large for the 18-49 and 50-64 age groups using the 2019 ACS 5-Year data, the change to the 2021 ACS 1-Year population estimates has a relatively insignificant effect on the rates per 100k for these groups.
4. Data for these charts is taken from the data file “vbtadultcirates.xlsx”, downloaded from the Vaccine Breakthrough web page (https://www.health.state.mn.us/diseases/coronavirus/stats/vbt.html) on 11/22/2022. A newer version of this file was published by MDH on 12/01/2022 but we have not yet incorporated it into our analysis. The rates in this file, calculated by MDH using the 2019 ACS 5-Year population estimate, for the unvaccinated, vaccinated, and boosted are plotted without modification. The rates per 100k using the 2021 ACS 1-Year population estimate are calculated by subtracting the vaccinated and unvaccinated populations, available from “vbtadultcirates.xlsx”, from the 2021 ACS 1-Year 65+ population, and dividing into the weekly number of cases, hospitalizations, or deaths listed in “vbtadultcirates.xlsx”, and multiplying by 100,000. The 2021 ACS 1-Year population estimate is obtained from the US Census Bureau web site (https://data.census.gov/table?q=S0101&tid=ACSST1Y2021.S0101), selecting Minnesota for the 2021 ACS 1-Year estimate, for Table S0101. The data for the 2019 ACS 5-Year estimate can be downloaded from the same web site, selecting 2019: ACS 5-Year Estimates from the pull down menu.
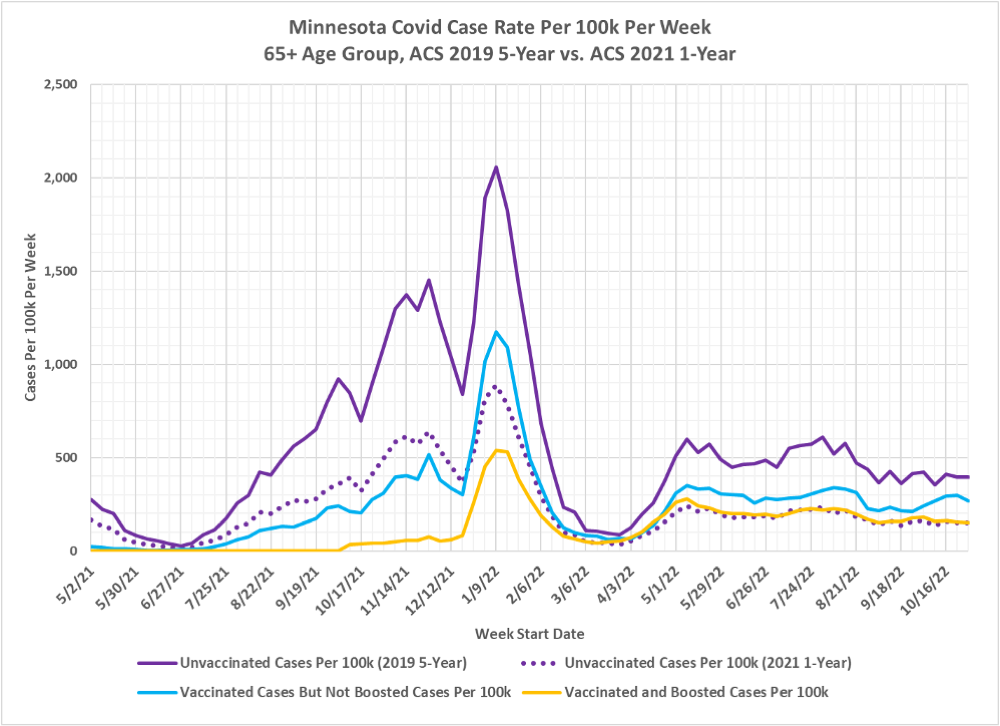
5. Fig. 1, Minnesota Covid Cases Per 100k Per Week, 2019 5-Year 2021 1-Year Population Estimates, 65+ Age Group: This chart displays the cases per 100k per week for the 65+ age group. The three solid lines are taken from the MDH data file “vbtadultcirates.xlsx” and plotted without modification. The dotted purple line is our recalculated cases per 100k per week using the 2021 ACS 1-Year population estimate. The vaccinated and boosted rates are unaffected by the underlying population assumption, since the number of people vaccinated is known from MDH vaccination records databases. For the most recent week shown, the week of 10/30/2022, the unvaccinated rate using the 2021 1-Year population is approximately 62% lower than the MDH rate. In other words, we believe that the MDH case rate per week for the 65+ age group is incorrectly inflated by a factor of 1.61 over the correct case rate calculated using the 2021 ACS 1-Year population estimate (the 1.61 inflation factor found as 1/62%). In earlier weeks, when the unvaccinated population was larger, the change from 2019 ACS 5-Year population to the 2021 ACS 1-Year population has less impact.
6. We can see in Fig. 1 that for much of 2021 that the case rates for vaccinated and for boosted people were much lower than the unvaccinated case rates. Around the start of 2022 the vaccinated but not boosted population starts to have higher case rates, and starting around March of 2022 the unvaccinated and the boosted have very similar case rates. A major confounding factor in this analysis is the unknown effect of natural immunity from people who were both vaccinated and infected with Covid-19, or infected multiple times whether vaccinated or not.
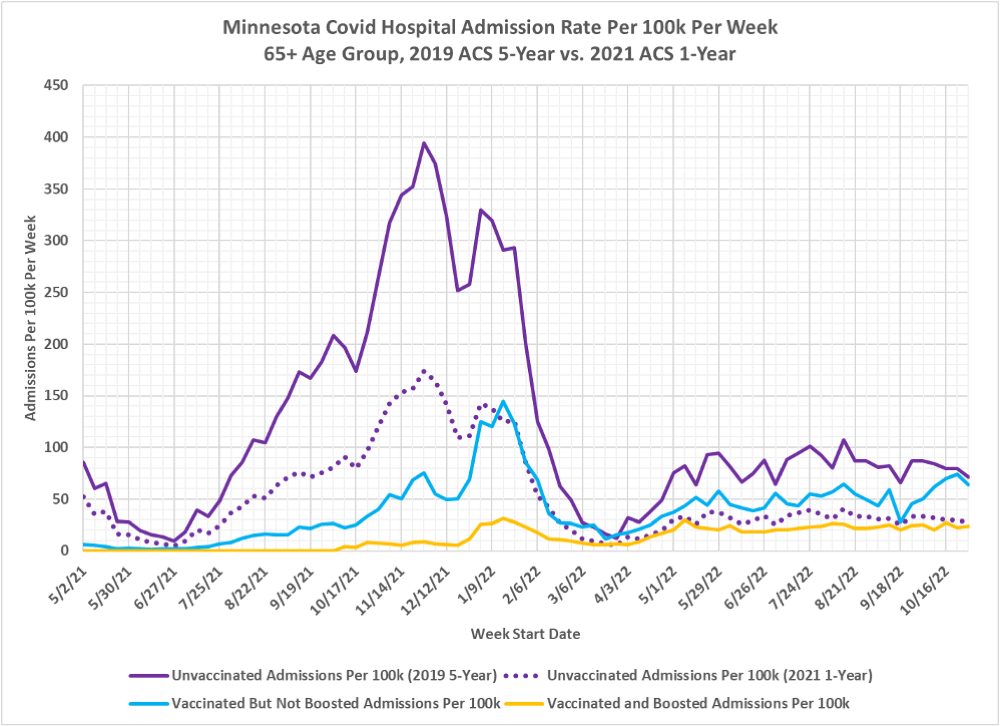
7. Fig. 2, Minnesota Covid Hospital Admissions Per 100k Per Week, 2019 ACS 5-Year and 2021 ACS 1-Year Population Estimates, 65+ Age Group: Similar to the case rates in Fig. 1, the change from the 2019 ACS 5-Year population estimate as used by MDH to the 2021 ACS 1-Year population causes a roughly 60% reduction in the rate of hospitalizations per 100k for the 65+ unvaccinated age group. Vaccination and/or boosting still is shown to result in a lower rate of hospitalization for much of 2021, but in 2022 the benefit of vaccination and boosting is minimal. The hospitalization rates for the unvaccinated and for the boosted are very similar for much of 2022.
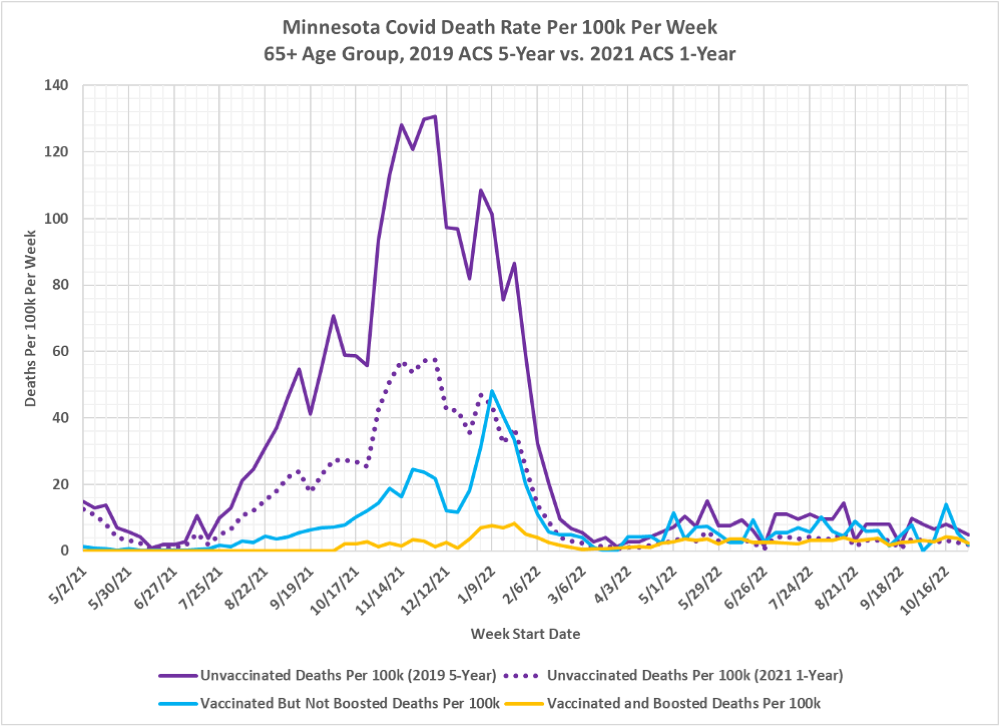
8. Fig. 3, Minnesota Covid Deaths Per 100k Per Week, 2019 ACS 5-Year and 2021 ACS 1-Year Population Estimates, 65+ Age Group: The change from the 2019 ACS 5-Year population estimate as used by MDH to the 2021 1-Year population estimate for the unvaccinated 65+ death rates per 100k is much the same as seen for cases and hospitalizations, lowered by approximately 60% over most time period being charted. Since April of 2022 the unvaccinated and vaccinated death rate is largely equivalent. The boosted death rate is still lower than for the vaccinated and unvaccinated for the early part of the pandemic, but since March 2022 the gap between the three subgroups has narrowed greatly. And the death rates for the unvaccinated and for the boosted are almost identical.
9. Fig. 4, Minnesota Covid Data 65+ Age Group, 10/30/2022, 2019 ACS 5-Year vs. 2021 ACS 1-Year: This table displays the population and Covid data for the 65+ age group for the week of 10/30/2022, as found in the data file “vbtadultcirates.xlsx”, downloaded from the MDH Vaccine Breakthrough web page on 11/24/2022: https://www.health.state.mn.us/diseases/coronavirus/stats/vbt.html. The overall age group populations using the 2019 ACS 5-Year estimate and the 2021 ACS 1-Year are shown at the top of the yellow columns. The boosted and vaccinated populations are taken from “vbtadultcirates.xlsx”, and the resulting unvaccinated population is calculated by subtracting these from the overall population total. Cases, hospitalizations, and deaths are all taken from “vbtadultcirates.xlsx” for the week of 10/30/2022. The rates per 100k are calculated by dividing the cases, hospitalizations, or deaths by the population size, and then multiplying by 100,000. Note that the rates per 100k we calculated for the 2019 ACS 5-Year population estimate matches the rates published in “vbtadultcirates.xlsx”. This data table matches the end point on 10/30/2022 as plotted in Fig. 1, 2, and 3.
10. The critical point in Fig. 1 is to compare the rates per 100k for the unvaccinated using the 2019 population estimate, as used by MDH, with the rates per 100k which result from using the 2021 population estimate. These are shown in the highlighted purple columns. Note that the unvaccinated population size increased from 61,807 using the 2019 ACS 5-Year estimate to 162,381 using the 2021 ACS 1-Year estimate. This results in a dramatically lower calculated rate per 100k for the unvaccinated using the 2021 population estimate. The cases rate per 100k, for example drops from 396.4 per 100k using the 2019 ACS 5-Year population estimate, to 150.9 per 100k using the 2021 ACS 1-Year population estimate. Meanwhile the rates per 100k for the boosted and vaccinated groups are unaffected by the difference in overall population size estimate, as shown in the columns highlighted in green and pink, because the size of the vaccinated and the boosted population come from MDH vaccination data bases.
11. Note that the 65+ age group is highly affected by the change in estimated overall population because it is highly vaccinated. The resulting unvaccinated population for the 65+ age group is very small, so the change in population size has a very large percentage impact on the rates per 100k. Because the 65+ age group has been increasing at a linear rate since 2010 the use of the 2019 ACS 5-Year population estimate (effectively a measure of the what the population was in 2017) is a lot lower than the 2021 ACS 1-Year population estimate, which actually matches the time period where we start calculating the size of the unvaccinated population.
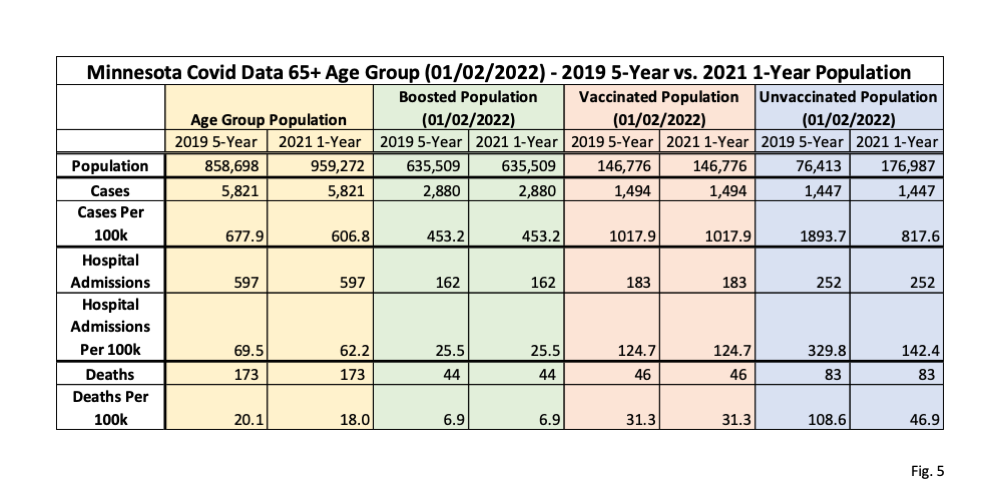
12. Fig. 5, Minnesota Covid Data 65+ Age Group, 01/02/2022, 2019 ACS 5-Year vs. 2021 ACS 1-Year Population Estimates: Here we repeat the data table in Fig. 1, but using data from the week of 01/02/2022, the first week that the 2021 ACS 1-Year population estimate could be considered valid. Compared to Fig. 1, we can see the unvaccinated population is somewhat larger than on 10/30/2022, so the increase in unvaccinated population using the 2021 ACS 1-Year population estimate is proportionally slightly smaller than on 10/30/2022, but is still significant.
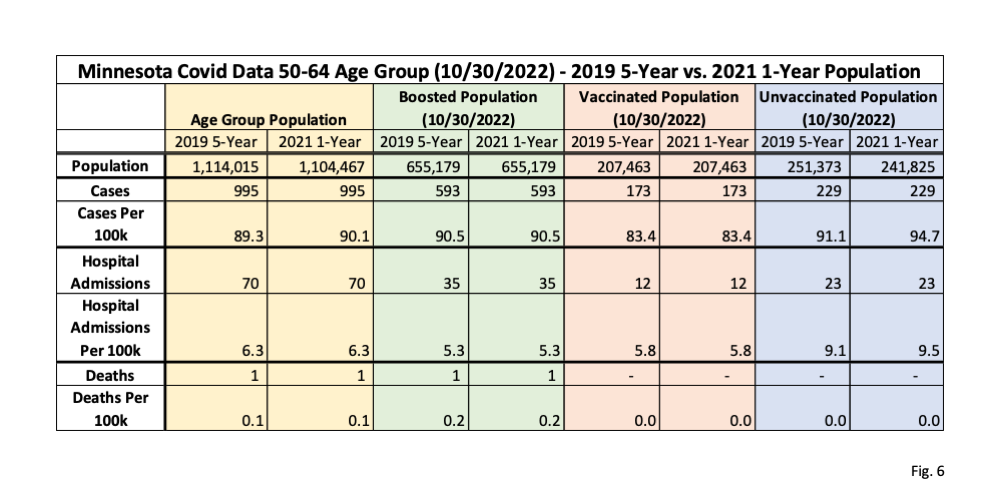
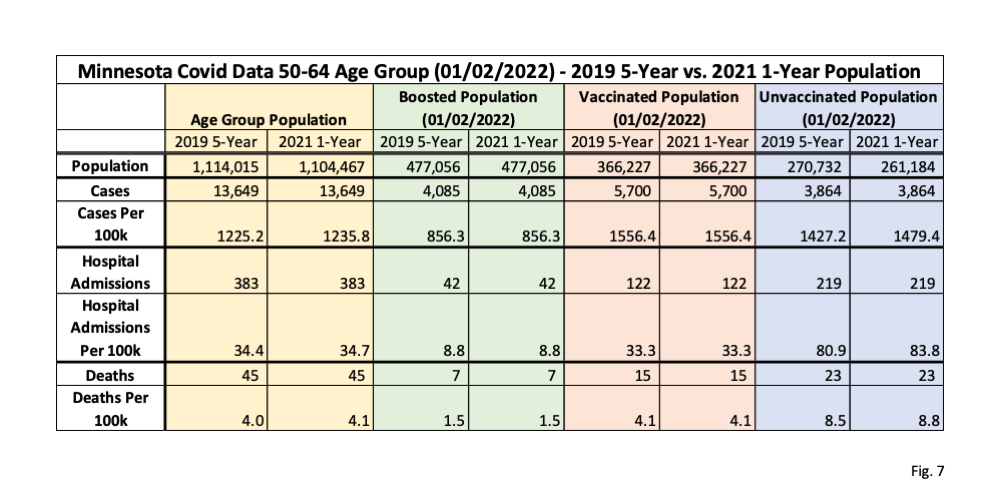
13. Fig. 6 and 7, Minnesota Covid Data 50-64 Age Group, 10/30/2022 and 01/02/2022, 2019 ACS 5-Year vs 2021 ACS 1-Year Population Estimates: In these two tables we display the comparison of using the 2019 ACS 5-year population estimate as used by MDH and the 2021 ACS 1-Year population, estimate as favored by us, for the 50-64 age group. In contrast to the 65+ age group, we can see that the 50-64 age group overall population actually went down by 9,548, which then causes the size of the unvaccinated group to go down by the same amount. Because the unvaccinated population is relatively large, compared to the 65+ age group, this decrease in unvaccinated population estimates causes the rates per 100k using the 2021 ACS 1-Year population estimate to go up very slightly compared to 2019, as shown in the purple columns.
14. Fig. 8 and 9, Minnesota Covid Data 18-49 Age Group, 10/30/2022 and 01/02/2022, 2019 ACS 5-Year and 2021 ACS 1-Year Population Estimates: In these two data tables we display the impact of using the 2019 ACS 5-Year population estimate as used by MDH vs. the 2021 ACS 1-Year population estimate for the 18-49 age group. This age group increases by 39,853 using the 2021 ACS 1-Year population estimate (yellow columns), which increases the unvaccinated group size by the same amount, and therefore lowers the unvaccinated rates per 100k by a very slight amount (purple columns). Because this age group has a very large unvaccinated population the increase in population size from the 2019 to the 2029 estimate estimates has a very small impact on the resulting rates per 100k.
15. Fig. 10, Comparison of ACS 1-Year and ACS 5-Year Population Estimates for Minnesota: Here we plot the ACS 1-Year and ACS 5-Year population estimates for Minnesota for the 3 adult age groups. Note that the 65+ age group population, shown in red, has been increasing at an almost perfect linear rate since 2010. Since the 2019 ACS 5-Year population estimate is an average of data collected from 2015 through 2019, this means that this is effectively an estimate of the 65+ population of the 65+ age group in 2017. In contrast, the 2021 ACS 1-Year population, which we argue is most correct for our purposes, is an estimate based on data collected in calendar year 2021. We can also see that the ACS 5-Year estimates lag the ACS 1-Year estimates by about 2 years for the 65+ age group. This is the reason why MDH’s use of the 2019 ACS 5-Year population estimate leads to incorrect results; there is a mismatch between the population average of 2015-2019 to the actual population in 2021 needed to accurately calculate the size of the unvaccinated 65+ population. In contrast, the 18-49 and 50-64 age groups do not have strong consistent trends, so these age groups are relatively unaffected by the choice of population estimates. In addition, the unvaccinated populations of the 18-49 and 50-64 are larger than for the 65+ age group, so a discrepancy in population size has much less of an impact of the rates per 100k for the unvaccinated in these age groups.

WOW! You forgot to add the apology to all of your readers – to whom you’ve been shilling these obviously (1) unnecessary, (2) ineffective, and most importantly (3) UNSAFE vaccines for over a year. You’d get on your high horse, cherry pick your arguments, and absolutely REFUSE to look outside your silly little datasets (despite many of them being obviously useless). Now here you are admitting, essentially, that the vaccines are minimally useless and probably dangerous.
The fact that you not only MISSED this point for over a year, but were an absolute ass when it came to recommending them and responding to your (much smarter and more informed) posters who pointed out your mistaken position, should result in you *NEVER* doing this again.
This is for Danny Glover, or whatever his real name is, and all the other vaccine imbeciles. First of all it is apparent that this dunce doesn’t actually read, and is incapable of understanding, what I write. I am not going to bother responding to lunatics like this who spend their entire life on conspiracy theories and have an unshakeable confidence in their ignorance.
You wouldn’t even have this data if it weren’t for Dave Dixon’s digging, and my willingness to spend my own money to fight DOH and publish more accurate data. So go somewhere else with your infantile bullshit.