You will all recall the wailing and gnashing of teeth over hospital capacity and utilization as it related to CV-19. One obvious fact is that Little Timmy and the DOH never spent a dime to increase that capacity.
 Dave’s notes:
- This post is an update of the hospital utilization charts we last published on 11/07/2022 here: https://healthy-skeptic.com/
2022/11/07/hospital-bed-use- during-the-epidemic/ . In today’s post we have added 2 weeks of additional data. We have also deleted the pediatric and adult bed capacity, utilization, and available charts, Fig. 5 through Fig. 9 of the 11/07 post. The underlying data in these figures frankly doesn’t make sense, so we are going forego these charts for now We have also added in a new Fig. 5, which is a detail chart for Covid ICU and Covid Non-ICU beds in use. - Starting 6/30/2022 MDH reports hospital utilization and capacity in two data files, hcdsource.csv and hcapacity.csv, both available on the hospitalizations and capacity page of the Situation Update for COVID-19 web page https://www.health.state.mn.
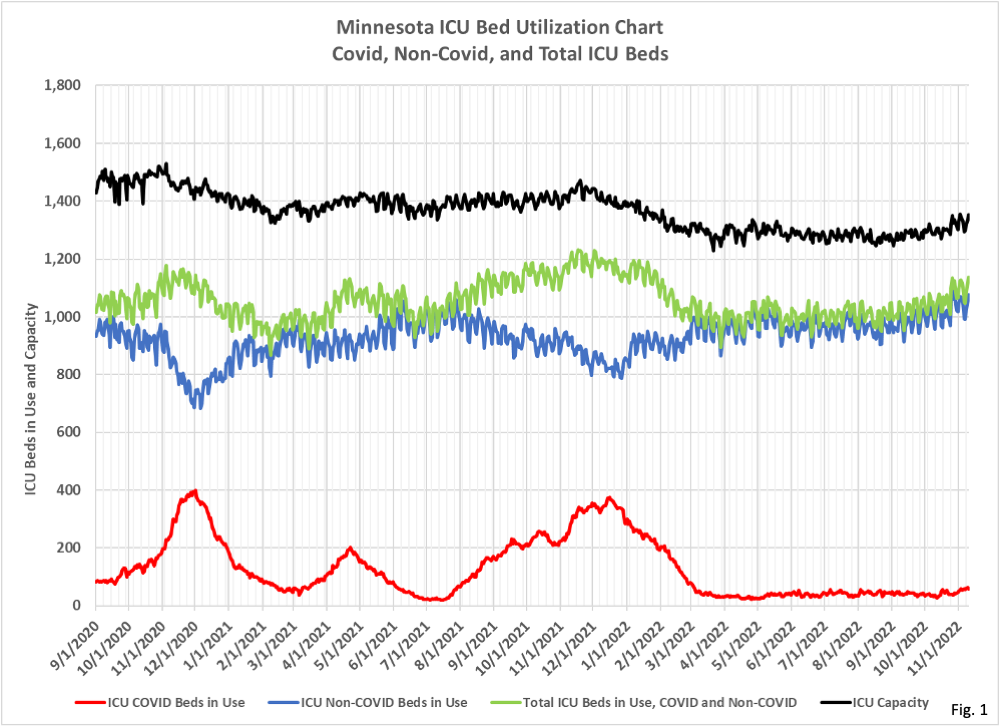
us/diseases/coronavirus/stats/ hosp.html. The file “hcdsource.csv” contains daily data for the number of beds capacity, occupied, and available, for ICU and Non-ICU categories, for Covid and Non-Covid categories, and for each region of Minnesota and statewide totals. We are unable to reconcile the data in “hcapacity.csv”, which was the source for the data in the pediatric and adult capacity and available charts. The data may very well be accurate, we just are unable to fully understand it. - Fig. 1, ICU Bed Capacity and Utilization: This chart displays the daily ICU beds occupied for Covid patients (red curve), non-Covid patients (blue curve), total ICU beds (green curve), and total ICU capacity as reported in hcdsource.csv (black curve). Note that every time Covid hospital beds increase, non-Covid beds decrease, undoubtedly an effect of incidental Covid infections for people admitted for something else, which we have noted several times. It is also interesting to note that total ICU capacity as reported by MDH is lower now than on 9/1/2020, indicating no money was spent on increasing capacity. Since the last time we published these charts roughly 2 weeks ago there has been a slight uptick in both Covid ICU beds in use and in Non-Covid ICU beds in use.
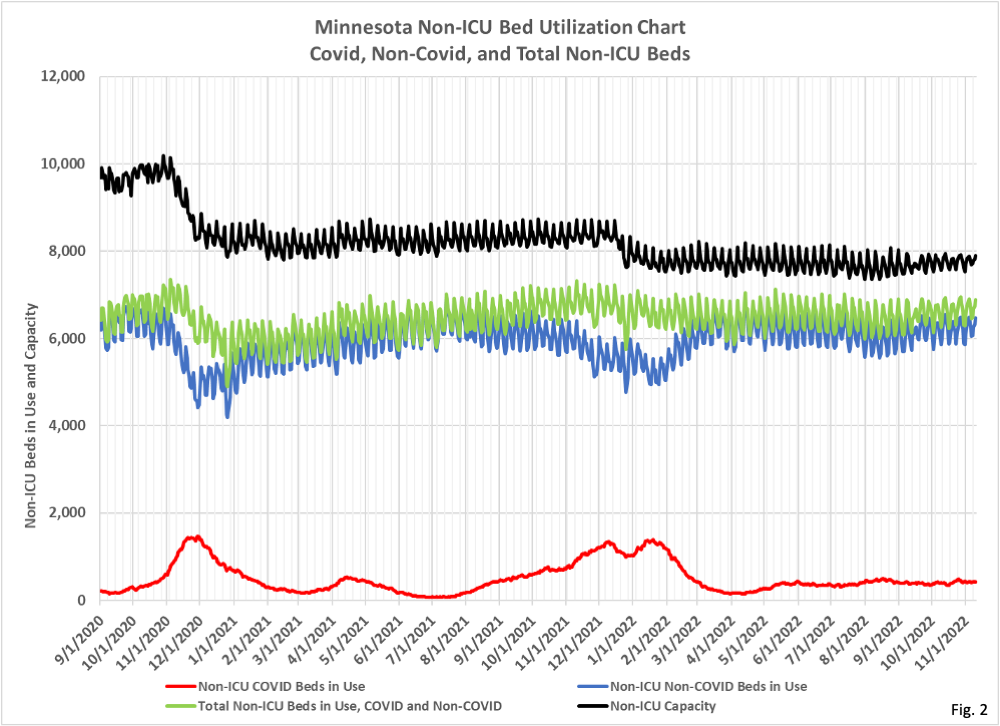
- Fig. 2, Non-ICU Capacity and Utilization: This chart is identical to the ICU chart in Fig. 1, just showing Non-Covid bed utilization and capacity. The general features of this chart are similar to those in Fig. 1. Non-Covid beds drop every time Covid beds surge, and overall capacity is lower now than on 9/1/2020. Note also that total beds in use dropped during the surge in cases and Covid hospitalizations in late 2020 and early 2021. This must have been due to a combination of hospital avoidance by patients, and deferred elective surgery scheduling by hospitals. This same sort of reduction in overall utilization was not seen during the Omicron surge in late 2021/early 2022. While ICU usage has risen slightly in the last two weeks Non-ICU usage has been relatively consistent.
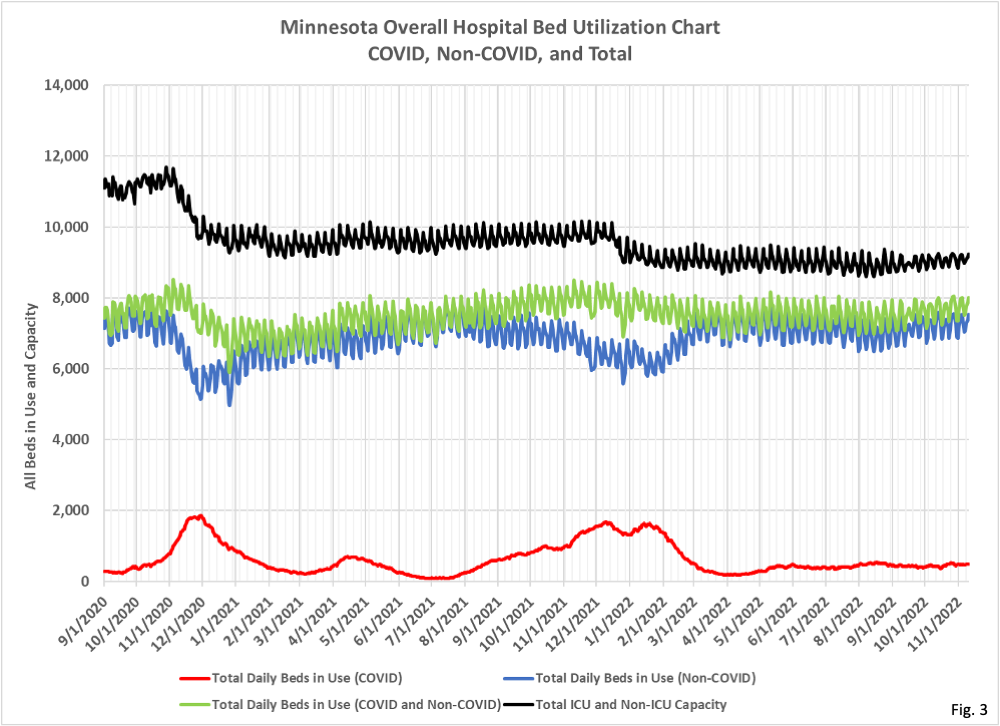
- Fig. 3, Total Capacity and Utilization: This chart displays the totals of the ICU and Non-ICU capacity and utilization data displayed in Figs. 1 and 2. Since the number of Non-ICU beds used and capacity is larger than ICU, this chart largely mirrors the Non-ICU chart in Fig. 2.
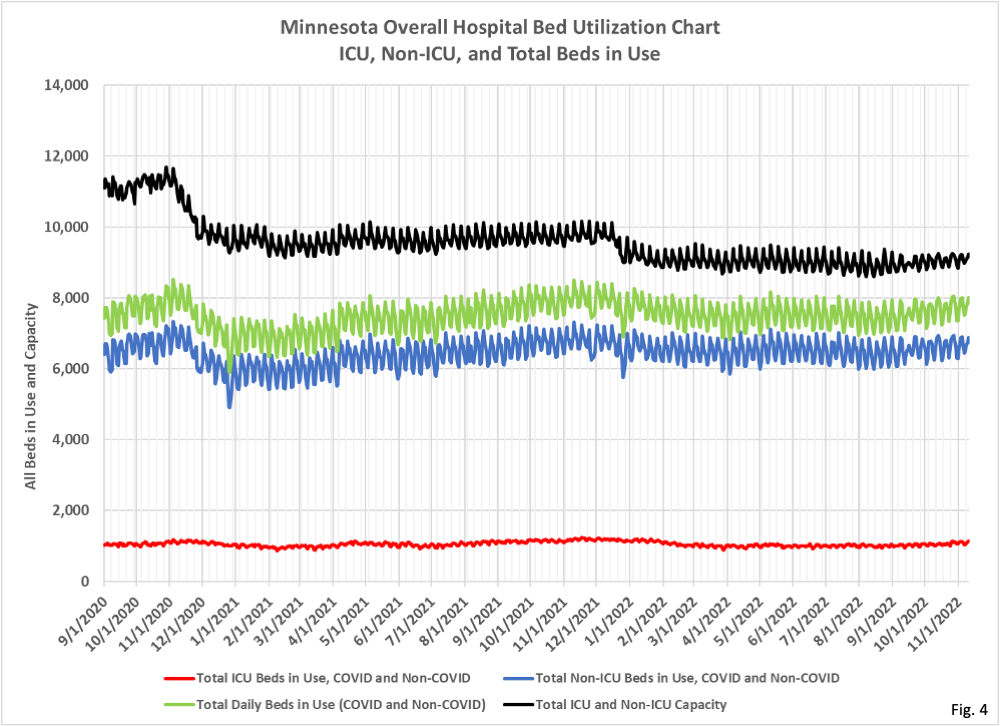
- Fig. 4, Total Capacity and Utilization for ICU and Non-ICU: This chart displays much of the same information as the first three charts, except that this time we are lumping Covid and Non-Covid beds together. The total ICU beds in use (red curve) is remarkably stable regardless of the current state of the Covid pandemic. There is no evidence that ICU bed utilization increased during the major surges we have had in Covid cases several times. Similarly, Non-ICU bed usage also seems relatively stable, generally decreasing during times of high Covid cases as elective surgeries are deferred, or as patients avoid needed hospitalization.
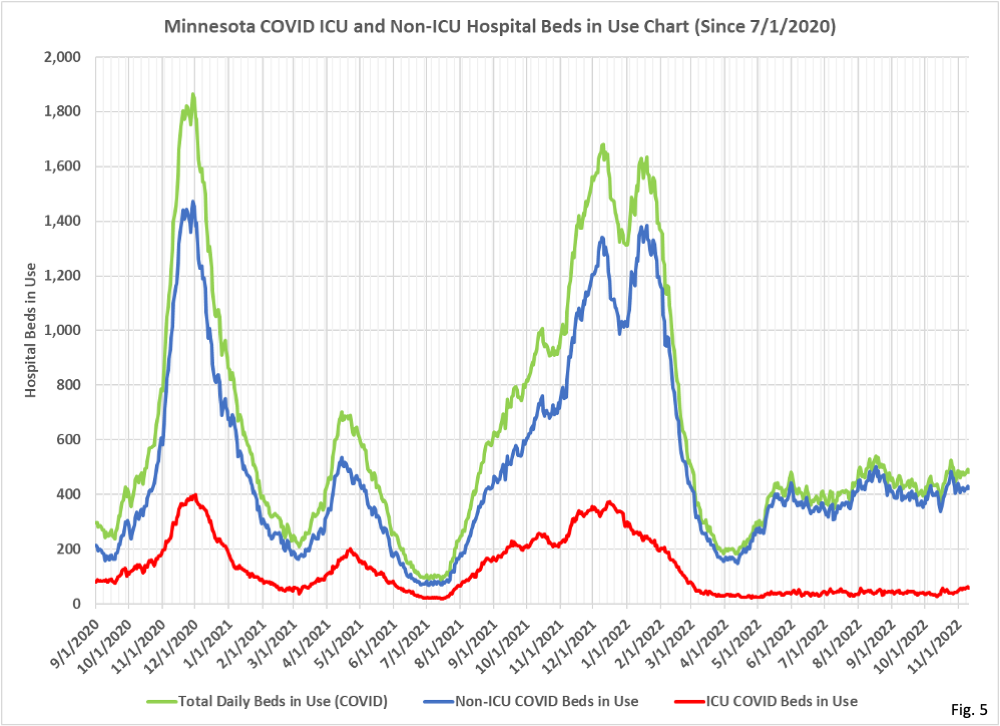
- Fig. 5, Covid ICU and Non-ICU Bed Utilization: This chart shows the detail of the Covid ICU beds in use and Covid Non-ICU beds in use over time. There is the slightest of upticks in ICU beds the last 2 weeks while Non-ICU bed usage is relatively stable.
