I want you to look at the population rate charts for this group carefully. There has never been any meaningful protection from getting infected and modest, at best, protection against hospitalization in this age group.
 Dave’s notes:
- The following charts show how vaccination status affects the risk of testing positive or being hospitalized with Covid for the 5-11 age group. In general, for the 5-11 age group, vaccination does not appear to offer any protection against testing positive for Covid, and perhaps minimal protection against being hospitalized with Covid. It is also important to note that there is not an increase in cases or hospital admissions apparent in the data in recent weeks, either for the unvaccinated or vaccinated. Note also that MDH does not publish data for this age group who have been boosted. Presumably, cases among the boosted are lumped in with the vaccinated. As of 11/12/2022 there were 209,417 people in this age group who were fully vaccinated, and 15,574 people in this age group considered up to date on boosters. It is unclear why MDH chooses not to publish at least case or hospitalization data separately for the boosted group.
- The following charts illustrate the Covid cases and hospitalizations for the 5-11 age group. The Minnesota Department of Health (MDH) does not publish breakthrough death data or booster data for the 5-11 age group. The underlying data for these charts was published on 11/17/2022, with data ending the week of 10/23/2022.
- This post is an update of the breakthrough charts for the 5-11 age group most recently published on 10/31/2022 here: https://healthy-skeptic.com/
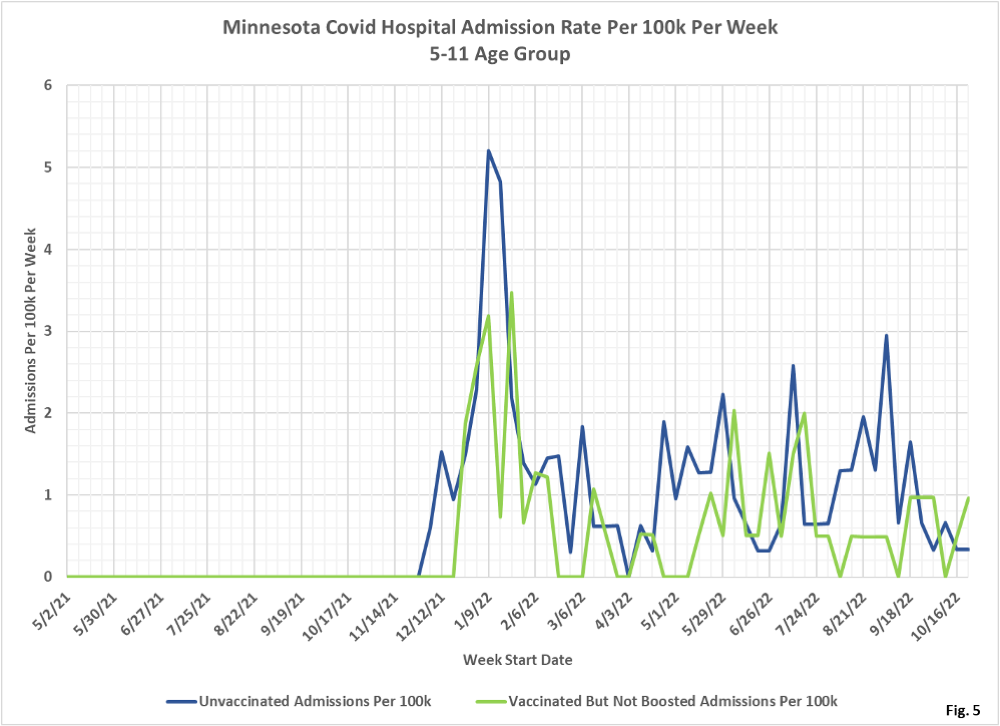
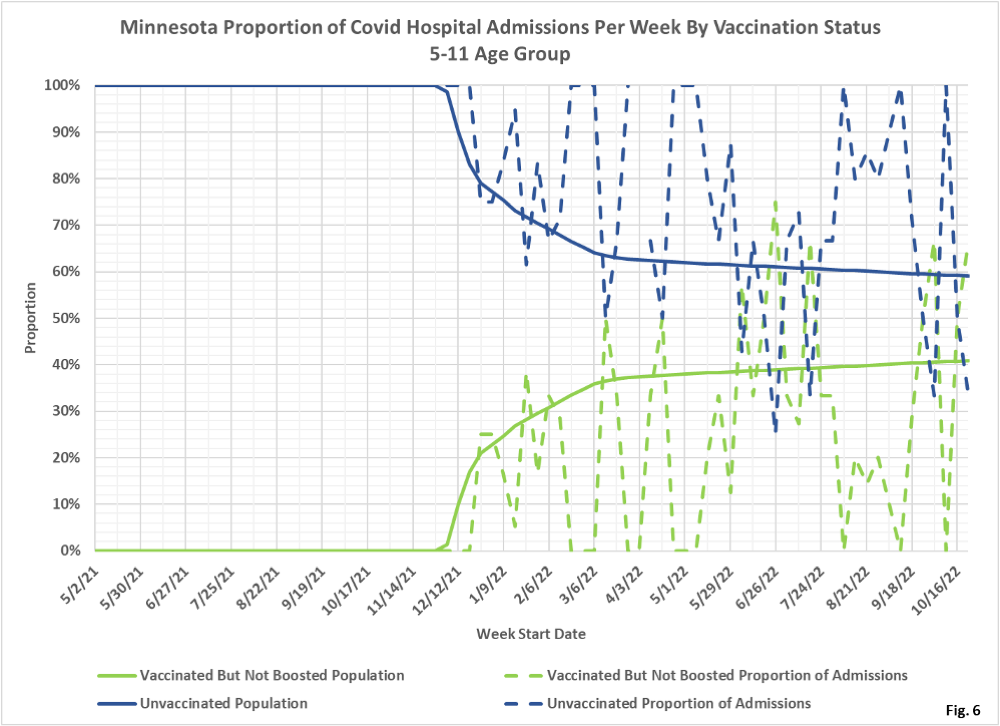
2022/10/31/breakthrough- events-october-27-ages-5-to- 11/. - There are 6 charts in this set, 3 charts each for cases and hospital admissions. Each set of 3 charts consists of the actual events per week (cases or admissions); the rate per 100k each week, and the proportion of events compared to the proportion of the vaccinated or unvaccinated population.
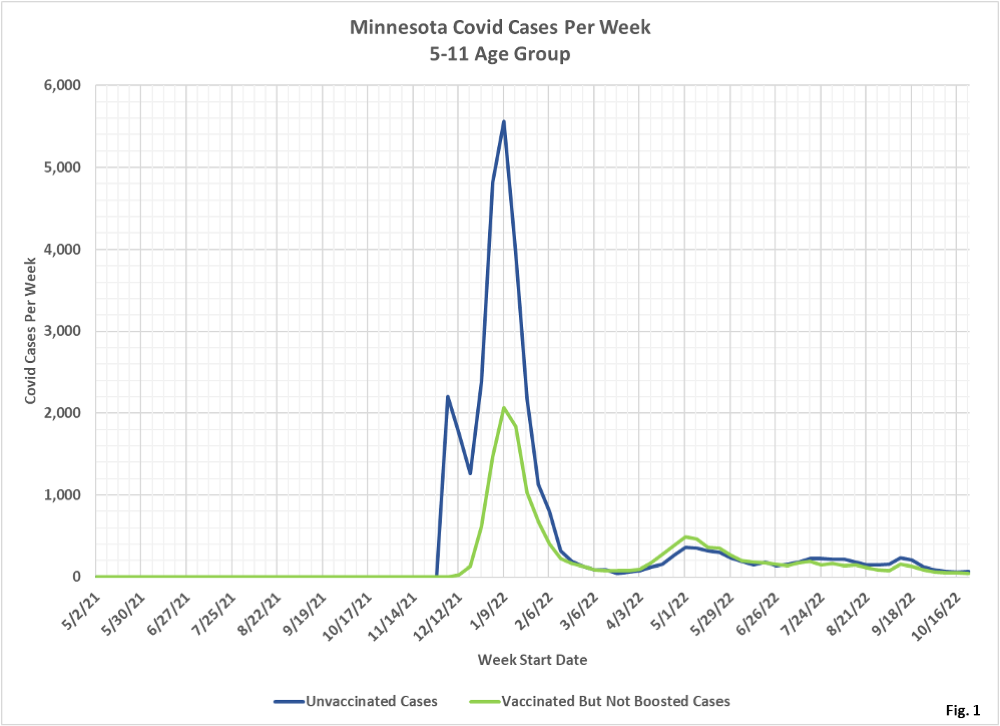
- Fig. 1: This chart plots the cases in the 5-11 age group per week among the unvaccinated and the vaccinated but not boosted populations each week. The number of Covid cases among these two groups continue to be very similar, with the number of unvaccinated cases being slightly higher than vaccinated cases for the past several months.
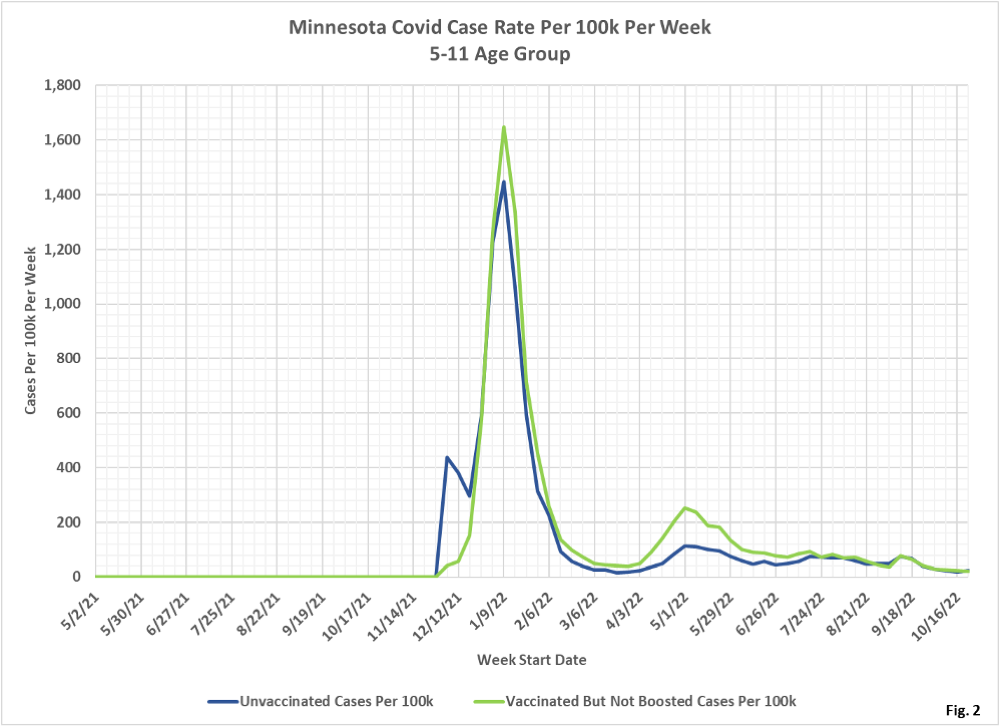
- Fig. 2: This chart displays the case rates per 100k for each subgroup in the 5-11 age group. The cases per 100k for each group have been virtually identical for the past 5 months, meaning that vaccination is immaterial for a 5-11 year old testing positive for Covid.
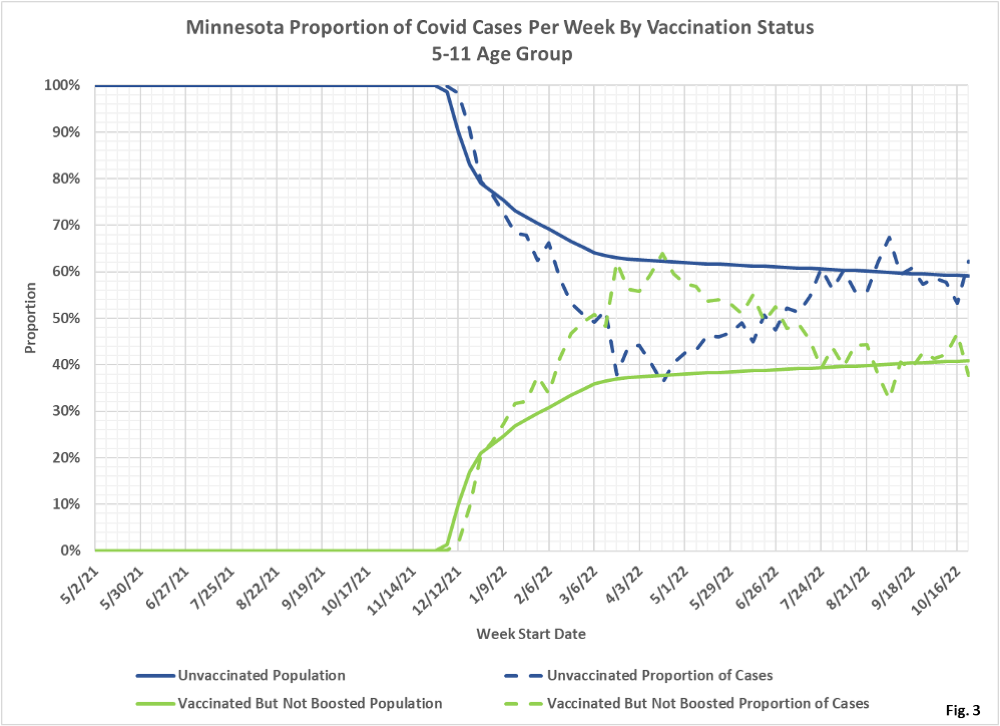
- Fig. 3: This chart displays the proportion of the 5-11 population who are unvaccinated (solid blue) and who are vaccinated but not boosted (solid green). For each population group we also display the proportion of cases each week (dashed lines of same color). Note that for the first half of 2022 the vaccinated had a much higher proportion of cases than the proportion of the age group that was vaccinated. For example, on 4/17/2022, the vaccinated made up 38% of the age group population, but accounted for 64% of the cases for that week. Since then the proportion of cases has equalized to the proportion of vaccination. For the most recent data, for the week of 10/23/2022, the vaccinated made up 41% of the age group and also accounted for 38% cases. A person in this age group is equally likely to test positive for Covid whether they are vaccinated or not.
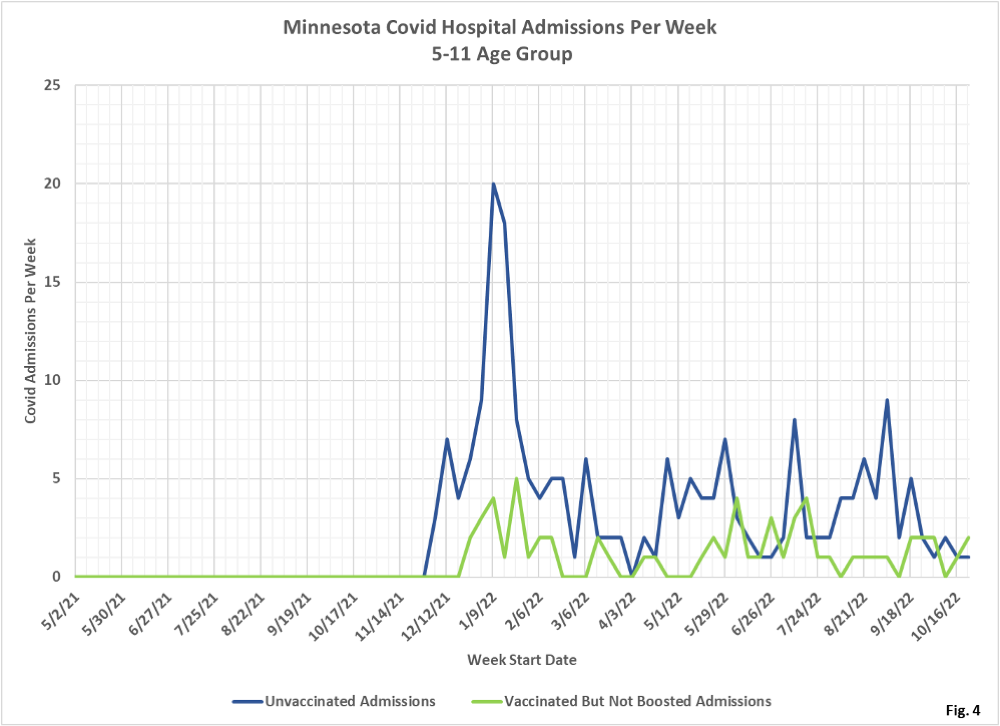
- Fig. 4-6: These charts display the hospital admissions, hospital admission rates per 100k, and hospital admissions proportions for the 5-11 age group, in an identical format to the case charts in Fig. 1 through Fig. 3. The vaccinated have generally had lower numbers of admissions throughout the pandemic than the unvaccinated, with some overlap in the curves. The absolute numbers of admissions for Covid are quite small with 1 unvaccinated Covid admission and 2 vaccinated Covid admissions for the week of 10/23/2022 (Fig. 4). Similarly, the admissions rate per 100k for the unvaccinated is generally higher than the rate for the vaccinated, although for the most recent data point the vaccinated have a slightly higher rate of hospitalization than the unvaccinated (Fig. 5). Fig. 6 shows that the small number of admissions makes it difficult to compare the proportion of admissions to the proportion of vaccinations. Generally it appears that being vaccinated does reduce the proportion of admissions, but there are very few admissions so the data is not easy to decipher. Note as well recent reports in the StarTribune on 8/25/2022 here COVID-19 levels stubbornly stagnant in Minnesota (startribune.com) that 50% to 75% of all Covid admissions were admitted for something else. There is no reason to doubt that this applies to the 5-11 age group as well.
- All data is obtained from the Minnesota Department of Health (MDH) Vaccine Breakthrough Weekly Update web site https://www.health.state.mn.
us/diseases/coronavirus/stats/ vbt.html. A data file on this site, vbtpedscirates.xlsx, contains all of the age group data. - MDH defines the fully vaccinated (what we have termed vaccinated but not boosted) as those who have not received a booster after completing their primary vaccination series, and had been vaccinated at least 14 days prior to testing positive.
