Similarly to younger children, there is essentially no benefit from vax for older children and hasn’t been for months.
 Dave’s notes:
- The following charts show how vaccination status affects the risk of testing positive or being hospitalized with Covid for the 12-17 age group. In general, for the 12-17 age group, vaccination appears to offer very modest protection against testing positive for Covid or for being hospitalized with Covid. The Minnesota Department of Health (MDH) does not publish breakthrough death data or booster data for the 12-17 age group. The underlying data for these charts was published on 11/17/2022, with data ending the week of 10/23/2022.
- This post is an update of the breakthrough charts for the 12-17 age group most recently published on 10/31/2022 here: https://healthy-skeptic.com/
2022/10/31/breakthrough- events-october-27-ages-12-to- 17/. - There are 6 charts in this set, 3 charts each for cases and hospital admissions. Each set of 3 charts consists of the actual events per week (cases or admissions); the rate per 100k each week, and the proportion of events compared to the proportion of the vaccinated or unvaccinated population.
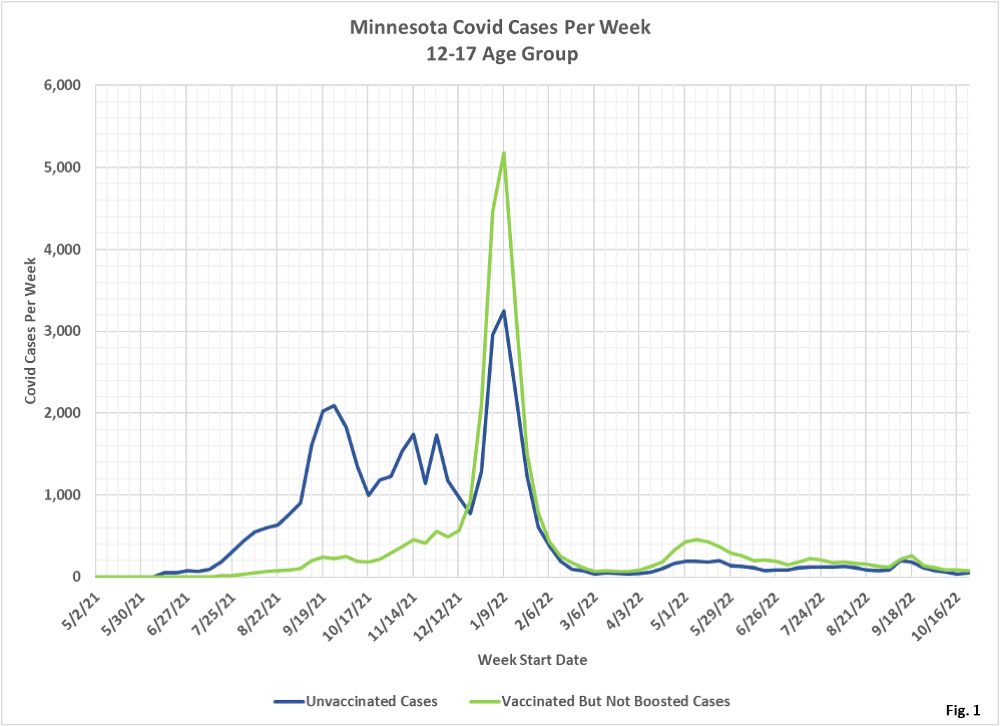
- Fig. 1: This chart plots the cases in the 12-17 age group per week among the unvaccinated and the vaccinated but not boosted populations each week. The number of Covid cases among these two groups continue to be very similar, with the number of cases for the vaccinated being slightly higher than cases for the unvaccinated for almost a year. This group achieved 50% vaccination rates in September 2021, so it is not surprising that there may be more cases among the larger vaccinated population.
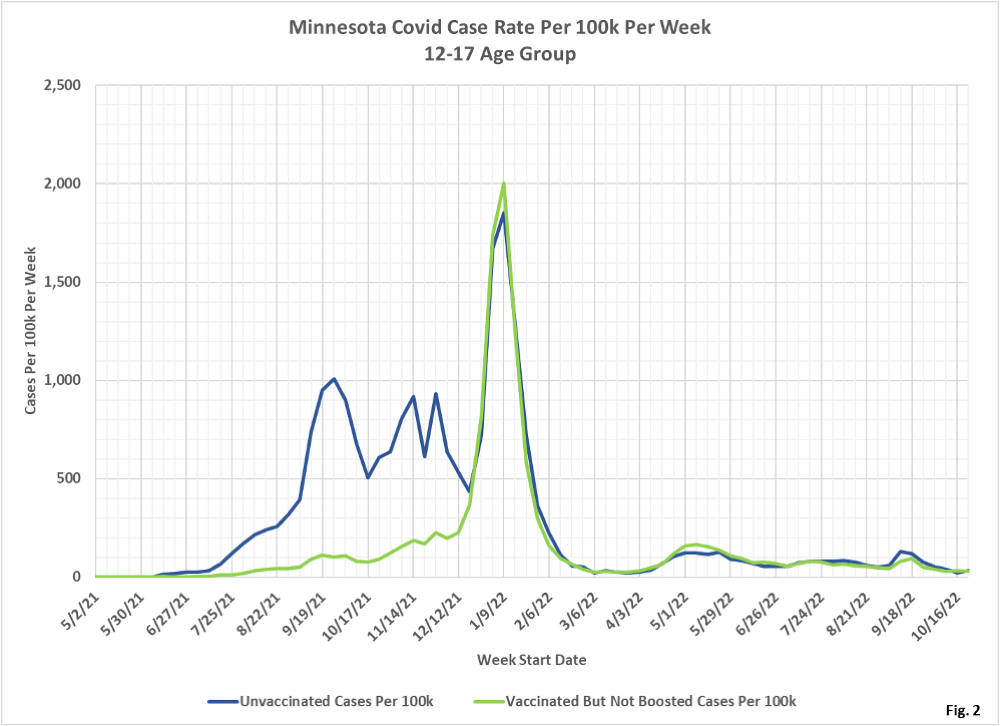
- Fig. 2: This chart displays the case rates per 100k for each subgroup in the 12-17 age group. The cases per 100k for the vaccinated and unvaccinated have been virtually the same since December 2021.
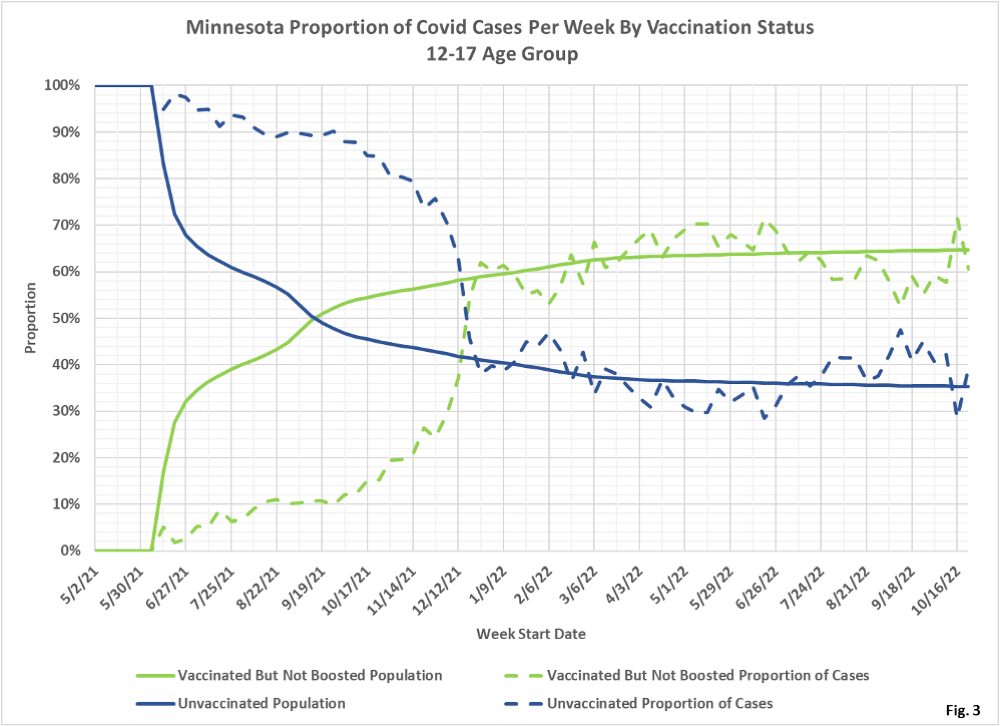
- Fig. 3: This chart displays the proportion of the 12-17 population who are unvaccinated (solid blue) and who are vaccinated but not boosted (solid green). For each population group we also display the proportion of cases each week (dashed lines of same color). Until December 2021 vaccination did offer protection against testing positive for this age group. Note that for the second half of 2021 the unvaccinated proportion of cases was much lower than the proportion of the vaccinated in this age group, meaning that vaccination did appear to offer protection against testing positive for Covid. For example, on 10/17/2021, the vaccinated made up 54% of this age group, but accounted for 15% of the cases for that week. Since December 2021 the proportion of cases has roughly tracked the proportion of vaccination, meaning that vaccination status has not affected the rate of testing positive since then For the most recent data, for the week of 10/23/2022, the vaccinated made up 65% of the age group and but only accounted for 61% cases. This indicates a very slight benefit to being vaccinated at best, more likely within the range of error for this data set.
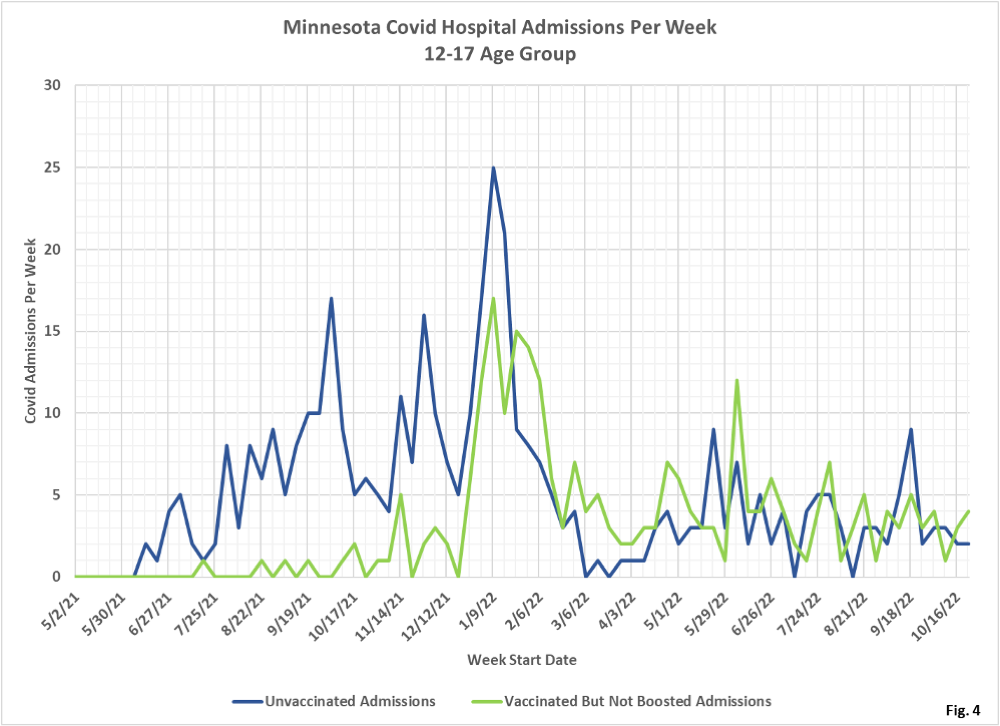
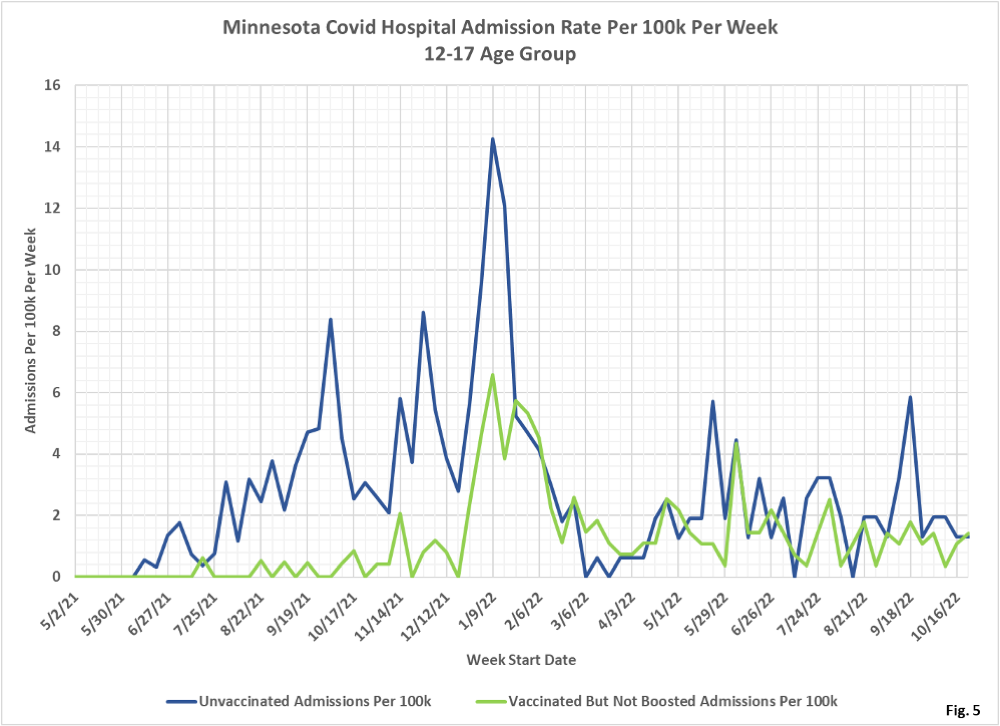
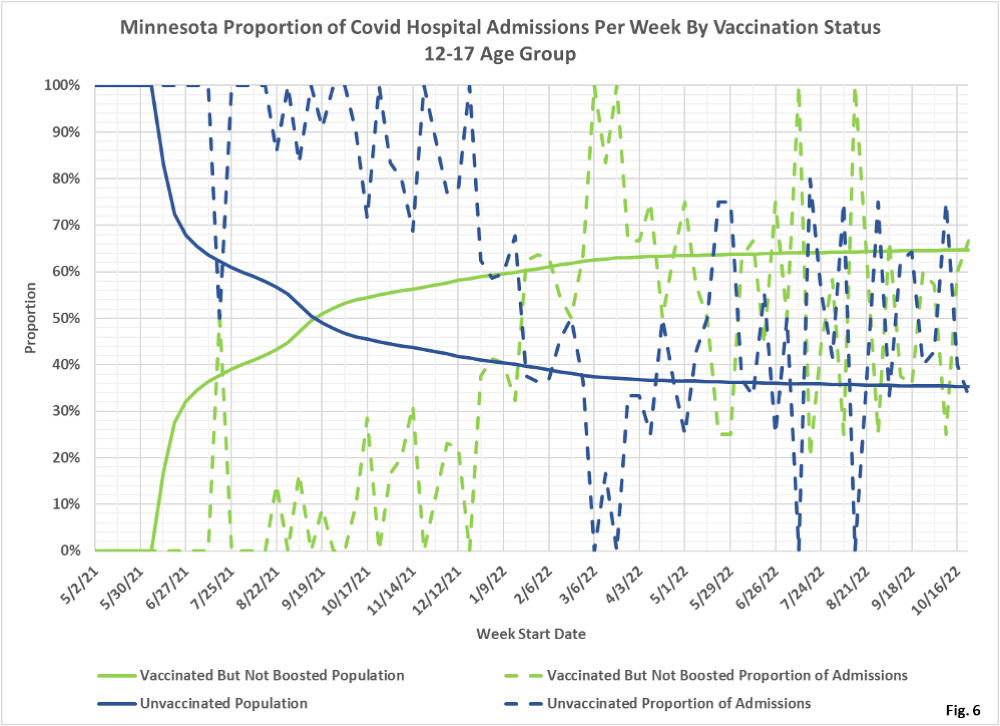
- Fig. 4-6: These charts display the hospital admissions, hospital admission rates per 100k, and hospital admissions proportions for the 12-17 age group, in an identical format to the case charts in Fig. 1 through Fig. 3. The unvaccinated have had very similar numbers of admissions to the vaccinated throughout 2022, with lots of overlap in the curves, although the unvaccinated did have an outlier in high admissions for the week of 9/18/2022. The absolute number of admissions for Covid per week are very small, with 4 vaccinated Covid admissions the week of 10/23/2022, and 2 unvaccinated Covid admissions (Fig. 4). The admissions rate per 100k for the unvaccinated is generally higher than the rate for the vaccinated for the past several weeks (Fig. 5). Fig. 6 shows that the small number of admissions makes it difficult to compare the proportion of admissions to the proportion of vaccinations. Generally it appears that being vaccinated does reduce the proportion of admissions, but there are very few admissions so it is hard to see clearly. Note as well recent reports in the StarTribune on 8/25/2022 here COVID-19 levels stubbornly stagnant in Minnesota (startribune.com) that 50% to 75% of all Covid admissions were admitted for something else. This applies to the 12-17 age group as well.
- All data is obtained from the Minnesota Department of Health (MDH) Vaccine Breakthrough Weekly Update web site https://www.health.state.mn.
us/diseases/coronavirus/stats/ vbt.html. A data file on this site, vbtpedscirates.xlsx, contains all of the age group data. - MDH defines the fully vaccinated (what we have termed vaccinated but not boosted) as those who have not received a booster after completing their primary vaccination series, and had been vaccinated at least 14 days prior to testing positive.
