These charts are a complement to the age group charts in the breakthrough series and we have further broken them out by vax status. The age structure is designed to help you see what age groups are affected by the epidemic. In general, young people had the highest rates of cases, older people accounted for most of the hospitalizations, and the very old were disproportionately represented in the death count. What you see now is that older people account for almost all events, which I think in part is due to their greater use of health care, resulting in mandatory testing, resulting in positive tests, incidental hospitalizations, etc.
 Dave’s notes:
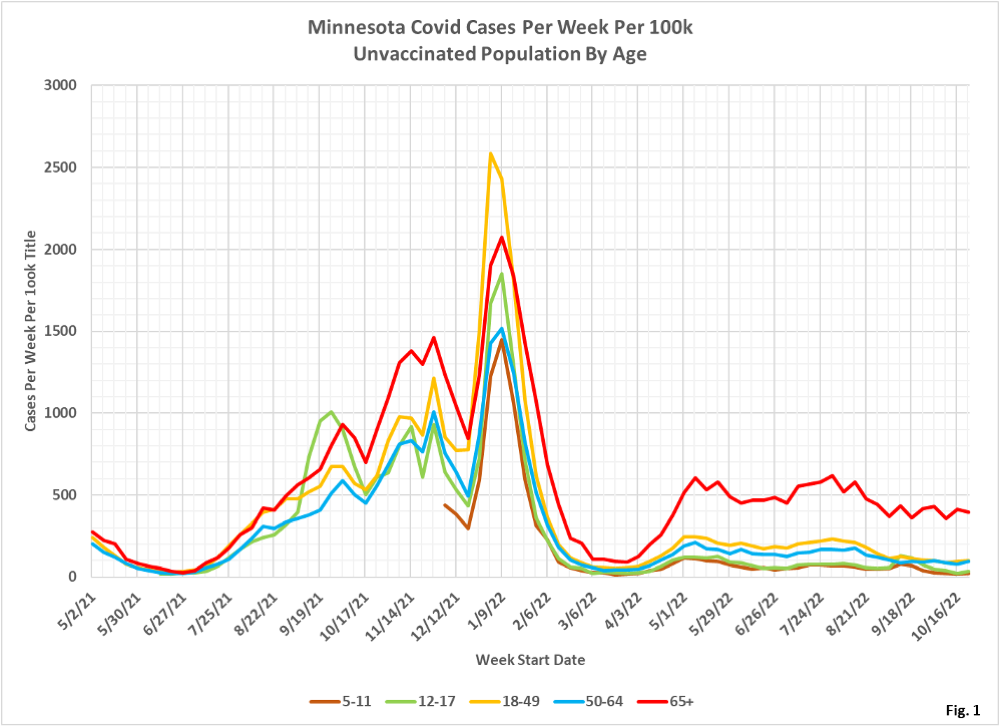
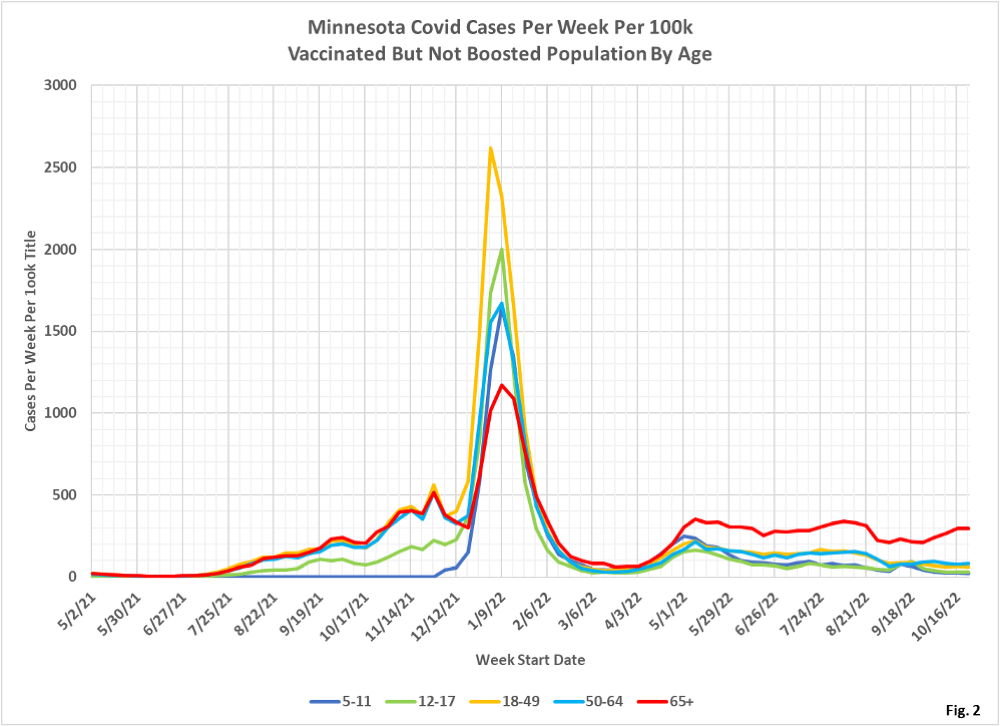
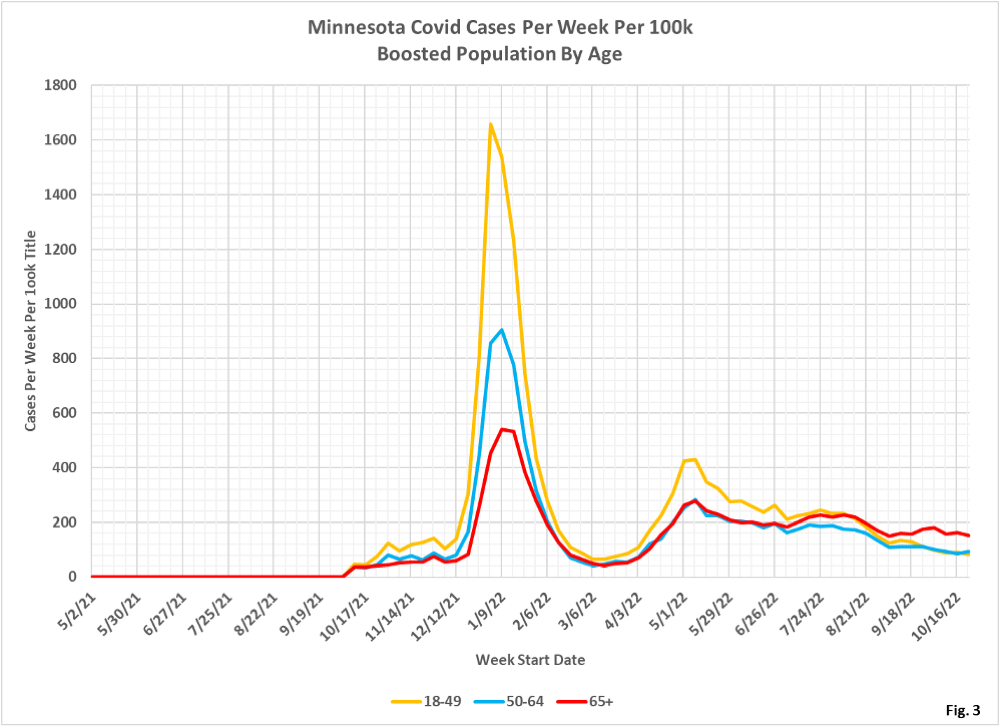
1. These age structure charts display the rates per 100k of Covid cases, hospital admissions, and deaths in Minnesota, with a separate chart for each vaccination status. These charts quantify the risk to an individual
in each age group of each vaccination status. In the past we have plottedage structure charts for each age group as a whole, most recently here on10/16/2022:
https://healthy-skeptic.com/2022/10/16/age-structure-charts-population-rates/.
2. The data for the charts on cases comes from the vaccine breakthroughdata files “vbtpedcirates.xlsx” and “vbtadultcirates.xlsx”, published by theMinnesota Department of Health (MDH) on the Vaccine Breakthrough Data webpage here: https://www.health.state.mn.us/diseases/coronavirus/stats/vbt.html. The
data in these data files are plotted without modification. Note that deathdata and booster data for the 5-11 and 12-17 age groups is not published byMDH. Case data for the unvaccinated and vaccinated for the 5-11 age group
starts on 12/5/2021, and for the 12-17 age group on 6/13/2021. Data for theother age groups start on 5/2/2021.
3. Fig. 1, 2, and 3: Covid Cases Per 100k Per Week, for theUnvaccinated, Vaccinated, and Boosted Populations: A common feature for all three vaccination statuses is that the 18-49 age group had the highest rates of cases during the Omicron surge in the winter of 2021/2022. It is peculiar too that the boosted 18-49 age group also had the highest rates of cases per 100k at the start of our new normal in April and May of 2022. Since May, for the unvaccinated and vaccinated, the 65+ age group has clearly the highest rates. In recent weeks the boosted 65+ also has the highest rates. Kevin points out that we do not have any data on the rates of multiple boosters. It is possible that the 65+ age group has the highest rates of multiple boosters, which tended to lower the case rate for some period of time, but booster effectiveness may now be waning.
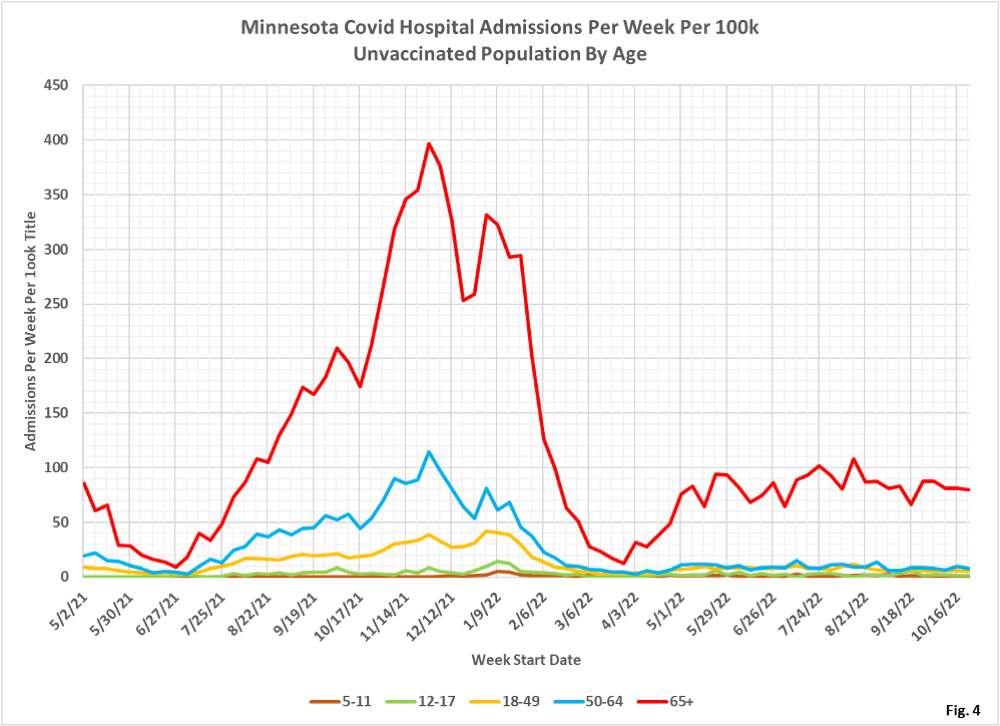
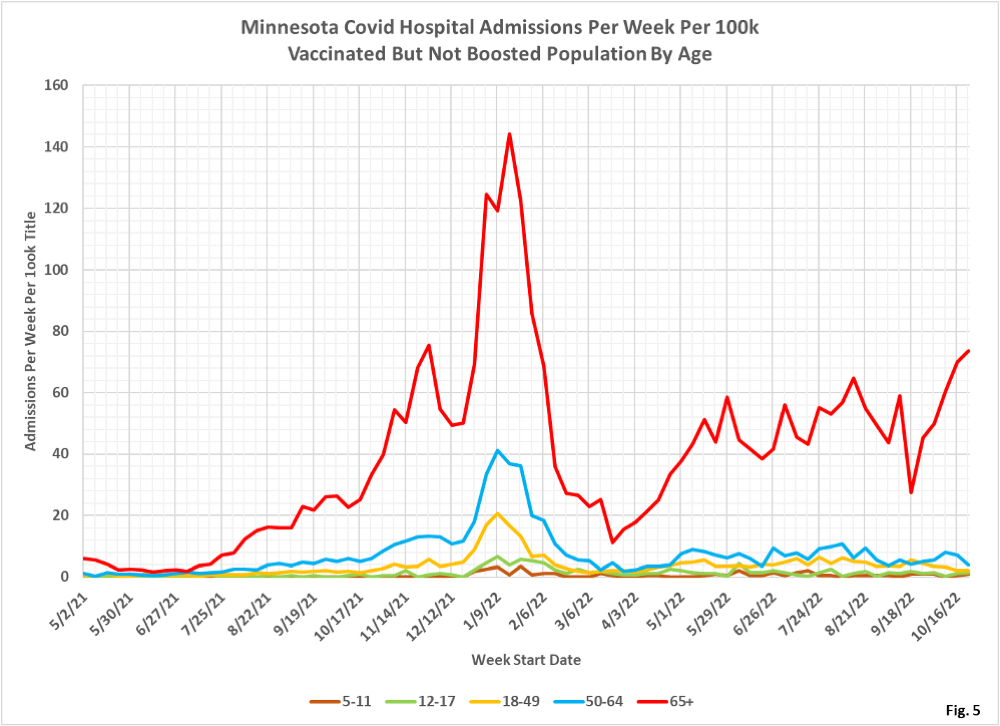
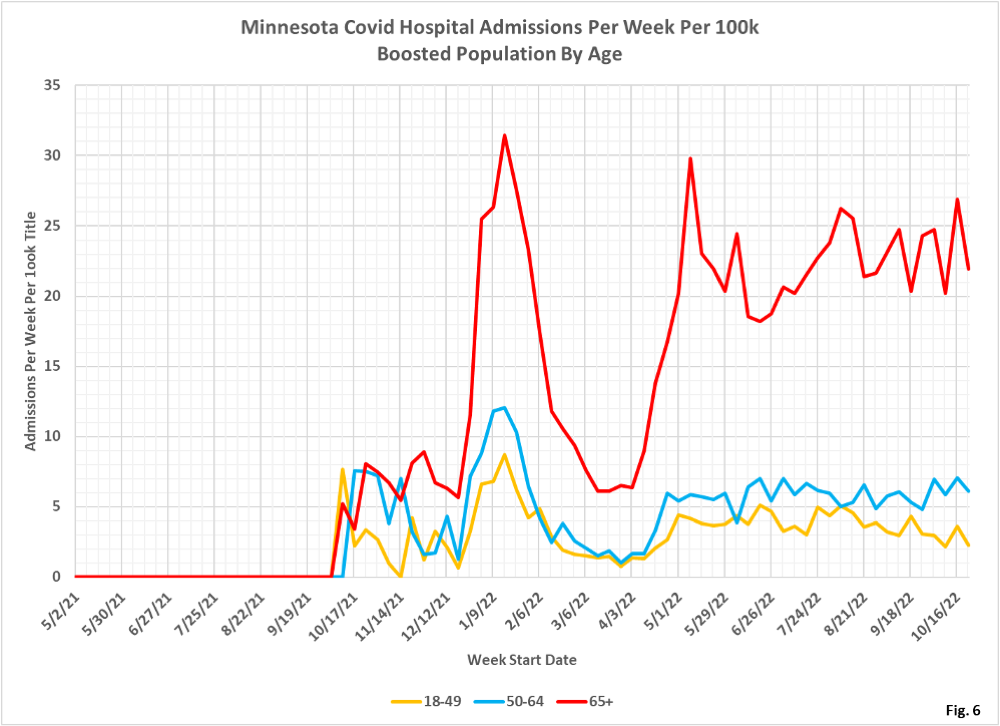
4. Fig. 4, 5, and 6: Covid Admissions Per 100k Per Week, for the Unvaccinated, Vaccinated, and Boosted Populations. The 65+ population clearly is most at risk for hospitalization, regardless of vaccination
status. Note that the scale of the vertical axis varies for the three vaccination status charts. The boosted admission rates per 100k are clearly much lower for all age groups during the Omicron surge, but in recent monthsthe advantages of vaccination and boosting seem to have waned for all age groups except the 65+.
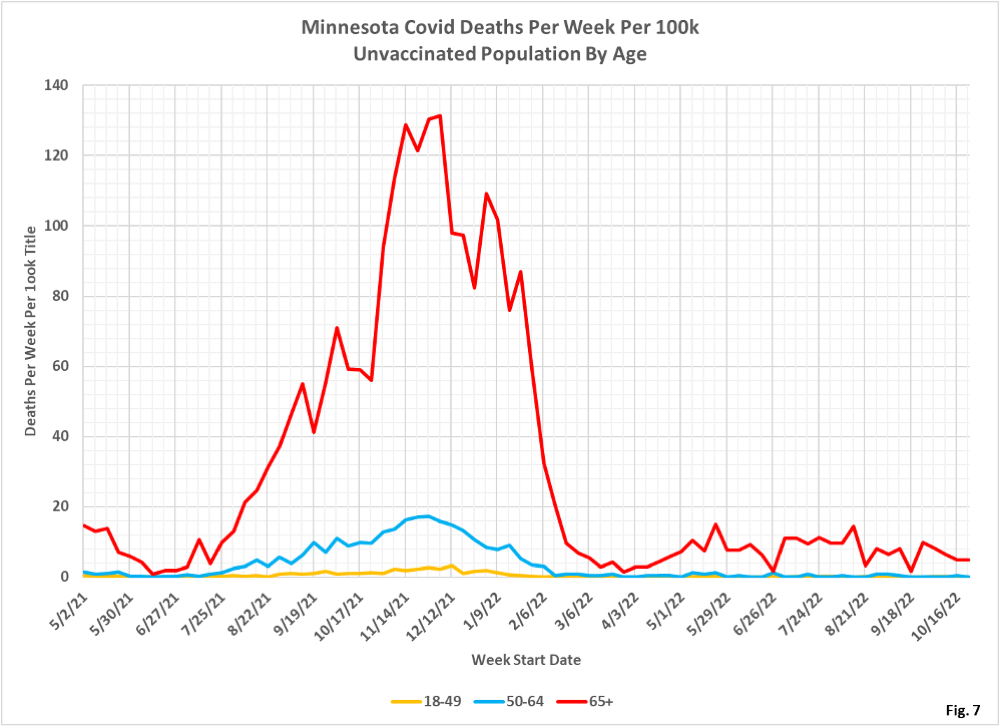
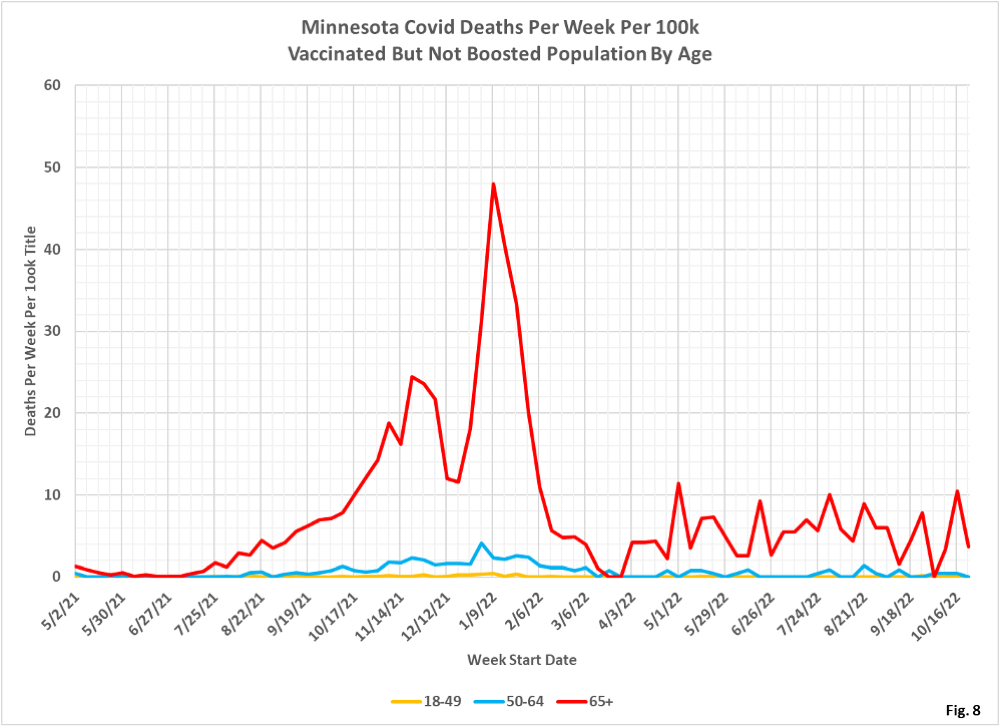
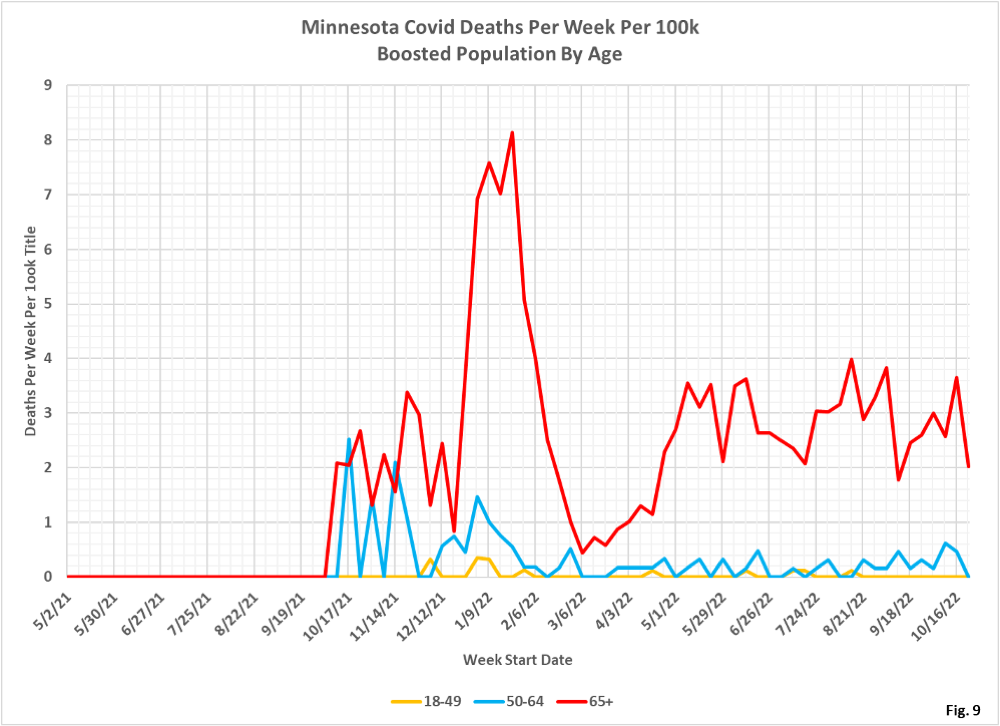
5. Fig. 7, 8, and 9: Covid Deaths Per 100k Per Week for the Unvaccinated, Vaccinated, and Boosted Populations. As we have known since the very beginning of the pandemic, the 65+ age group is most at risk of death from Covid, regardless of vaccination status.
