Very clear at this point that boosting makes no difference and that over time we are seeing rates of all events converge across the unvaxed, vaxed and vaxed and boosted subgroups. As Dave notes, MDH appears to have some issues around using age-adjustment, which seems to me to be unnecessary.
 Dave’s notes:
- This post is an update to the Covid vaccination breakthrough data table and charts for the overall Minnesota population last published on 11/07/2022 here: https://healthy-skeptic.com/
2022/11/07/breakthrough- events-november-3/#comment- 30470. This week’s update adds data through the week ending 10/16/2022, published by the Minnesota Department of Health (MDH) on 11/10/2022. In addition, we have made a change to the population basis for these overall population charts. In the past we have used total data for all ages 5 and above as the basis for these charts. Starting this week we are only using data for the adult age groups, 18 and above. There are several reasons for this change. First, MDH does not publish data on boosted children in the 5-11 and 12-17 age groups. We have attempted to set up the charts to accurately calculate rates per 100k using the applicable population sizes, but as more and more young people are boosted it becomes a concern that the rates per 100k charts may be unintentionally skewed. Second, MDH on the Vaccine Breakthrough web page (https://www.health.state.mn. us/diseases/coronavirus/stats/ vbt.html) separate their charts between pediatric and adult. By switching these charts to adult we are matching the population MDH uses. In particular, note the graphic MDH publishes for Adult Age Adjusted Cases, Hospitalizations, and Deaths. By comparing this graphic to our Fig. 6, 9, and 12 it is apparent that MDH’s age adjustment process has a large impact on the portrayed rates per 100k. We intend to investigate MDH’s age adjustment process in the future, and to understand why there are such dramatic differences between adjusted and unadjusted rate charts, especially for hospitalizations. It is also possible in this case that MDH does not need to perform any age adjustment process at all, since the breakthrough data set is less than 2 years long. There is more work to be done on this issue. - The breakthrough data files are available from MDH here, https://www.health.state.mn.
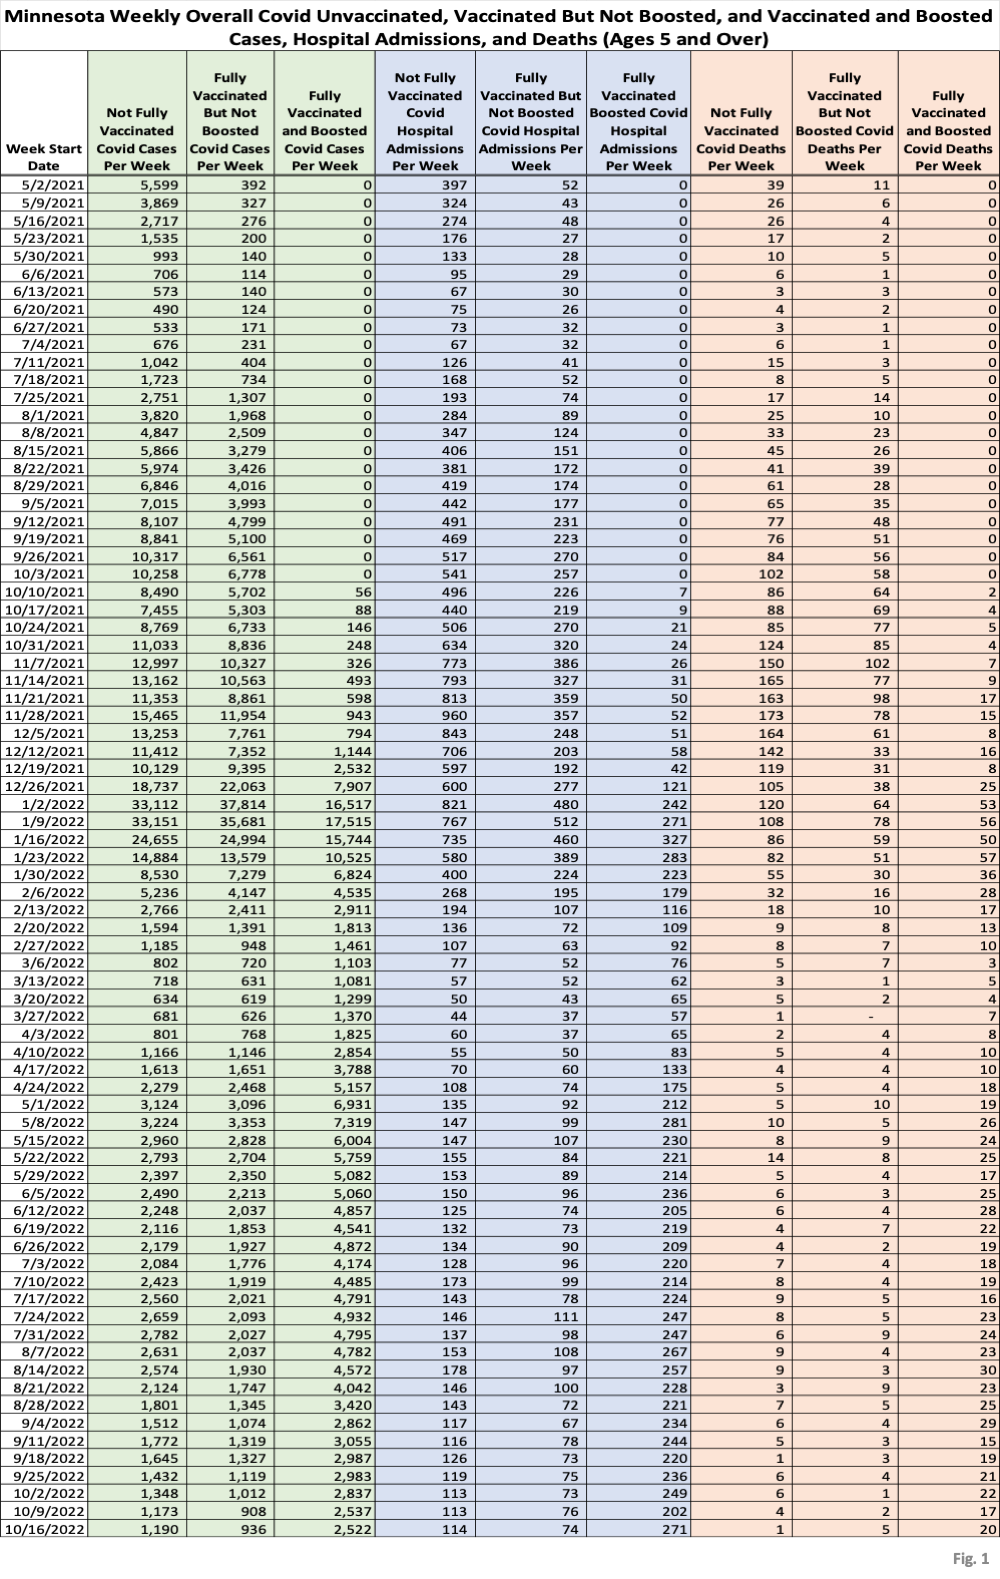
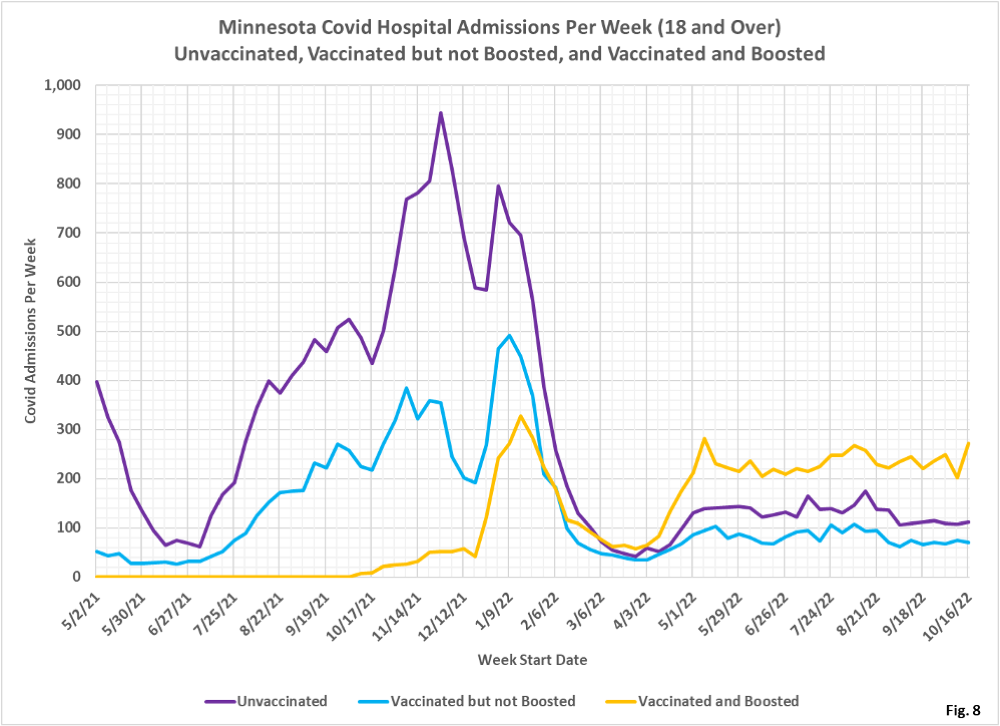
us/diseases/coronavirus/stats/ vbt.html , in the notes under the graphic images. - Fig. 1: This table displays the total cases, hospital admissions, and deaths that occurred each week among the unvaccinated, vaccinated but not boosted, and vaccinated and boosted populations. Data through the week of 10/16/2022 has been added this week. There was a very slight uptick in cases for the unvaccinated and vaccinated populations, and a slight decline in cases for the boosted. There was a fairly large increase in the number of hospital admissions for the boosted, the most since 5/8/2022 actually, while hospital admissions for the unvaccinated and vaccinated were little changed.
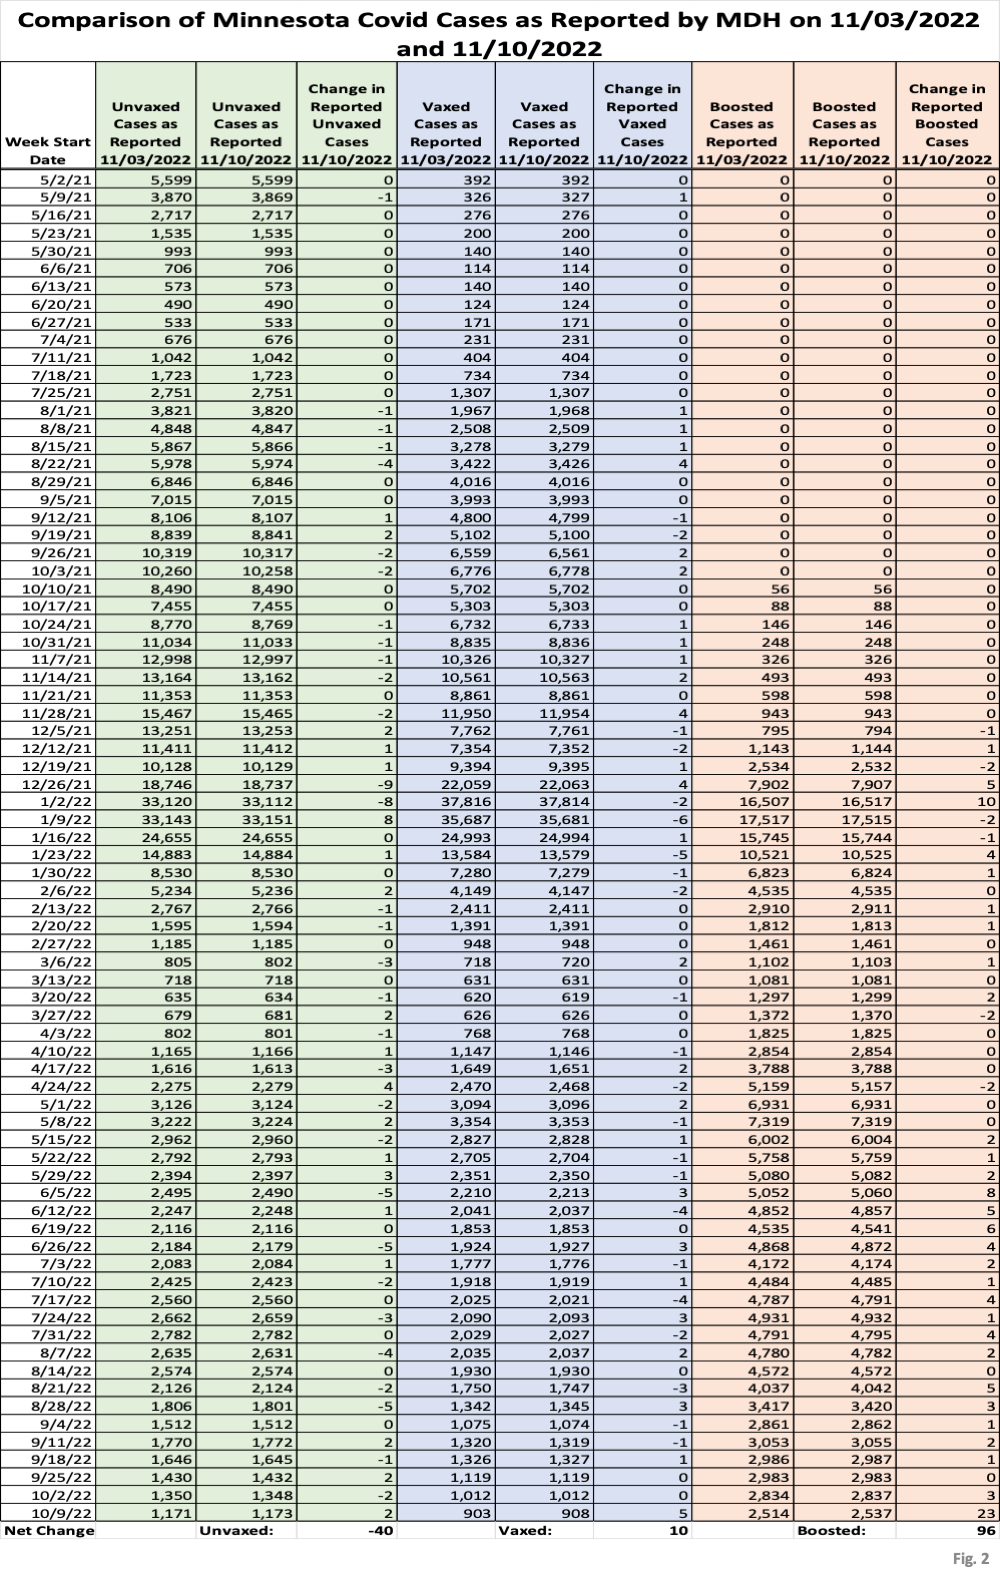
- Fig. 2: This data table displays the numbers of cases among the unvaccinated, vaccinated, and boosted, as published by MDH on 11/03/2022 and on 11/10/2022, as well as the net change each week. While there are changes in the data each week, the net change over the whole range in dates are a small decrease in the number cases among the unvaccinated (-40 cases), an increase in cases among the vaccinated (+10 cases), and an increase in cases among the boosted population (+96 cases). The magnitude of changes to cases in past weeks is very small.
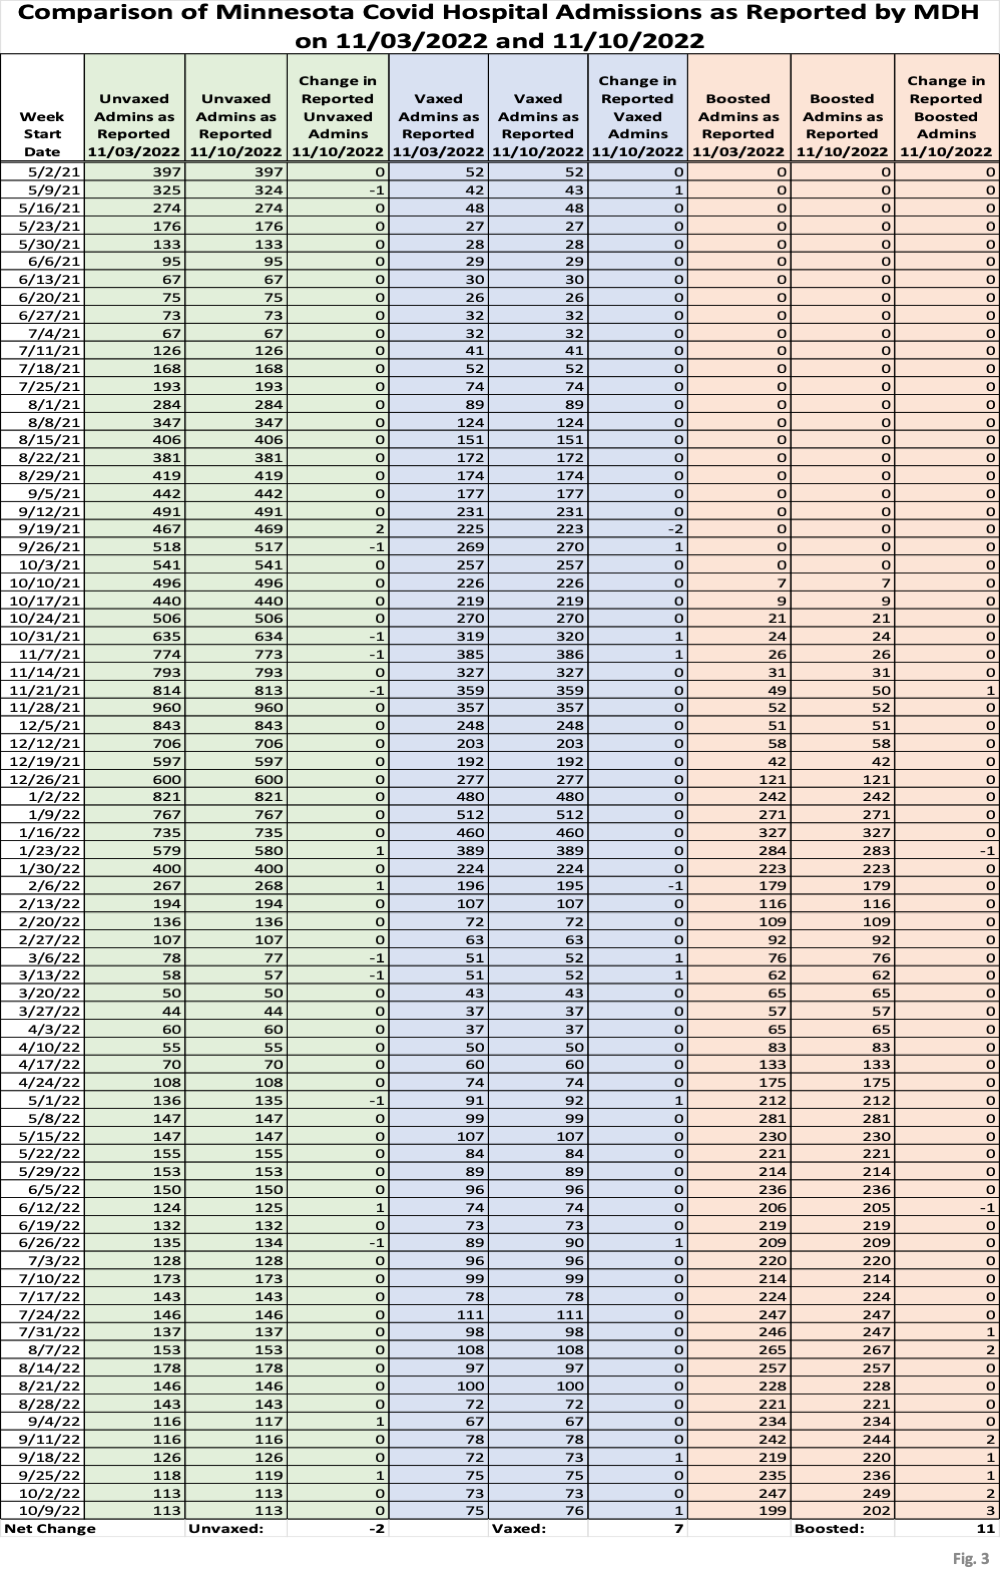
- Fig. 3: This data table displays the numbers of hospital admissions among the unvaccinated, vaccinated, and boosted each week as published on 11/03/2022 and 11/10/2022, in the same format as for cases in Fig. 2. The magnitude of the revisions is even smaller than the changes made to past cases. There were 11 hospital admissions added to those who were boosted, mainly in the more recent week’s data.
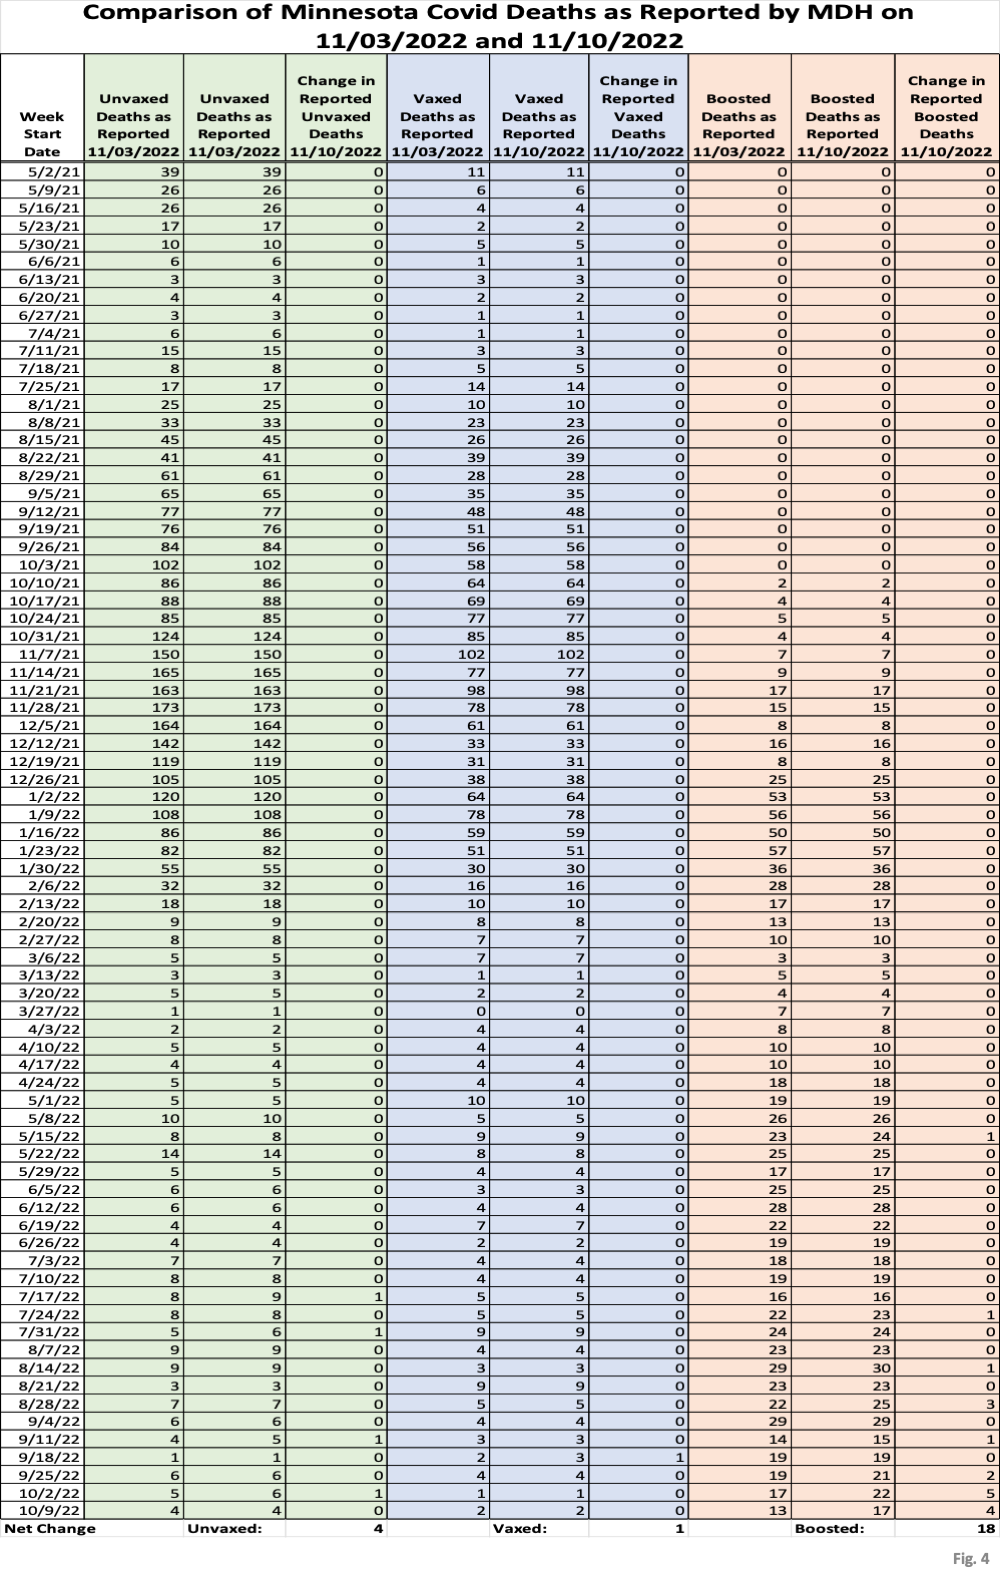
- Fig. 4: This data table displays the numbers of deaths among the unvaccinated, vaccinated, and boosted, as reported by MDH on 11/03/2022 and 11/10/2022. Revisions to older death records remain relatively rare, with the changes to past weeks’ being additions of deaths as the data is updated. It seems to me that the checking algorithm that updates older cases and hospitalizations should also eventually catch changes to older deaths. So far that isn’t really happening, but deaths are much more rare than cases or hospitalizations, so this may not be unexpected.
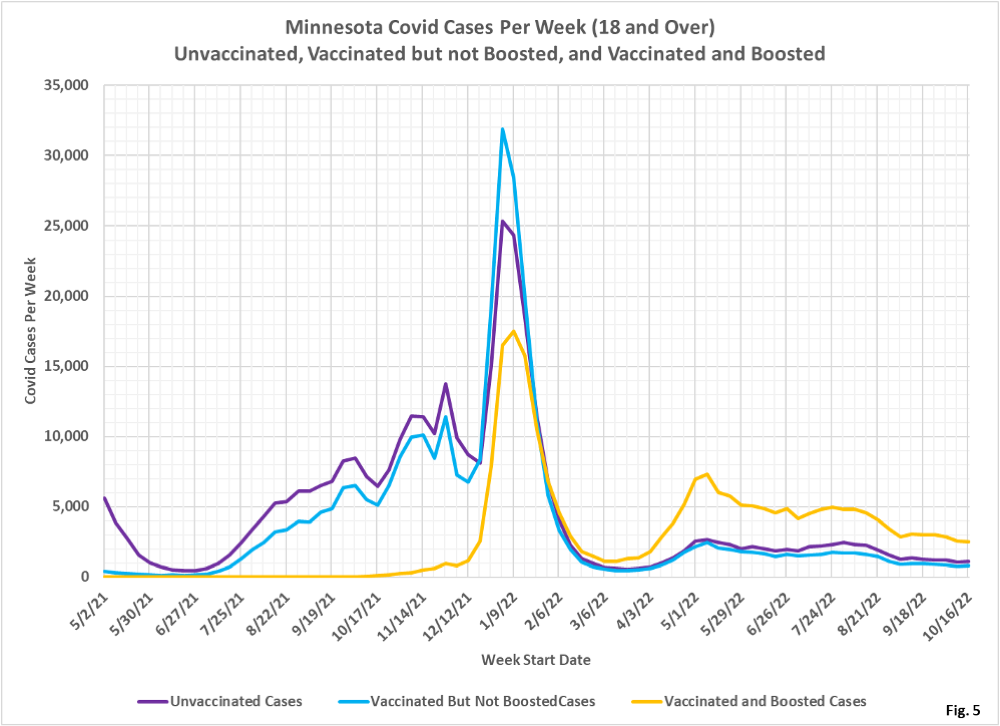
- Fig. 5: This chart simply plots the cases among the unvaccinated, vaccinated but not boosted, and vaccinated and boosted populations each week, as found in the data table in Fig. 1. Cases continue to fall very slowly, with the slight increase in cases not really visible given the magnitude of weekly cases.
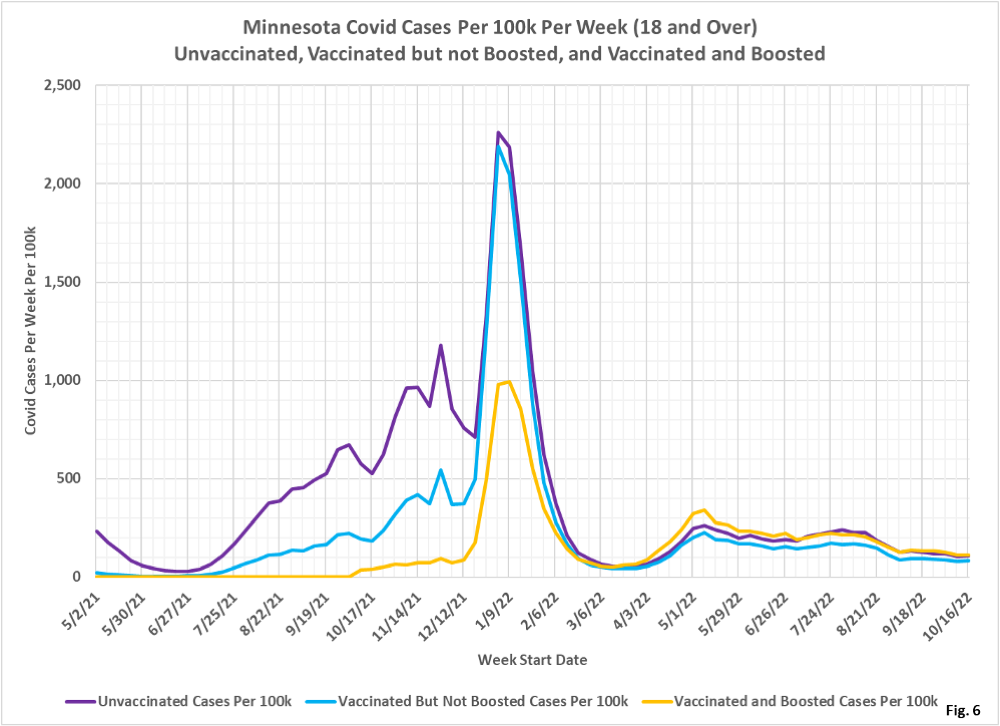
- Fig. 6: This chart displays the case rates per 100k for each group. When considered on an overall adult population basis the boosted have the highest rate per 100k of testing positive in recent data, followed closely by the unvaccinated, and then the vaccinated being the lowest. The boosted end up with the highest overall case rate due to the higher boosted case rates in the 18-49 and 50-64 age groups.
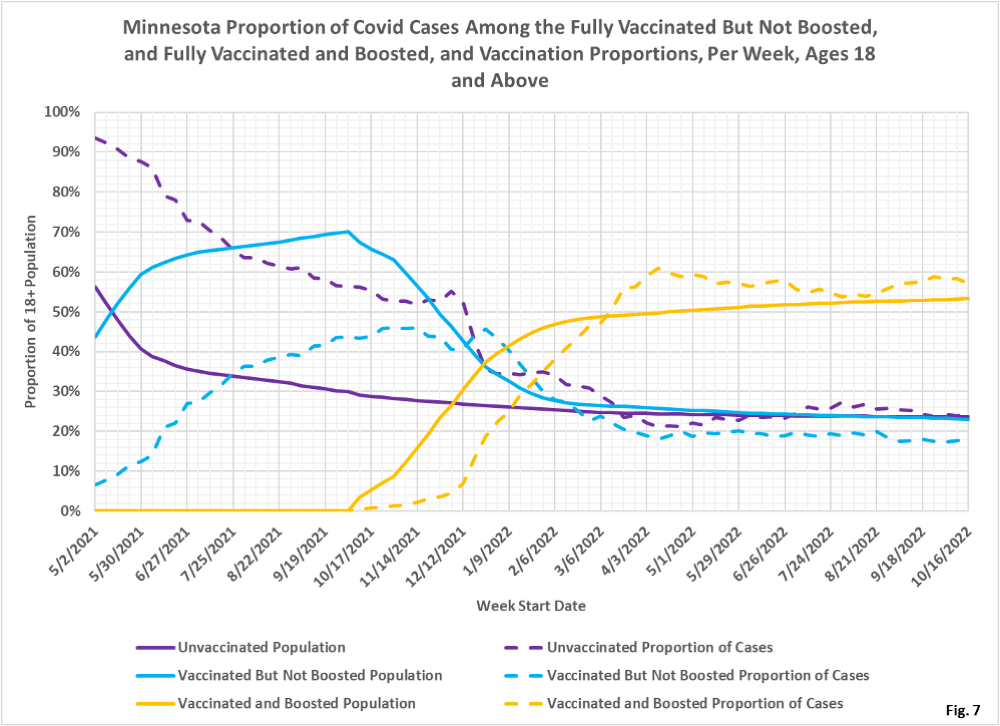
- Fig. 7: This chart displays the proportion of the 5 and over population who are unvaccinated (solid purple), vaccinated but not boosted (solid blue), and vaccinated and boosted (solid gold). For each population group we also display the proportion of cases each week (dashed lines of same color). The way to interpret this chart is to compare the proportion of breakthroughs to the proportion of vaccinations for each group. Whenever the dashed breakthrough proportion line is below the solid vaccination line of the same color, then that category is underrepresented for population, and when the dashed line is above the solid line of the same color then that category is overrepresented. For the week of 10/16/22 the boosted made up 54% of the adult population but accounted for 57% of the cases, while the vaccinated but not boosted made up 23% of the population but only accounted for 18% of the cases. The unvaccinated made up 23% of the adult population and also accounted for 23% of the cases. Since 3/6/2022 the boosted have had a higher proportion of cases than the proportion boosted, meaning that all things being equal boosting has not reduced the chances of an individual testing positive. One major unknown is the numbers of each age group who also have had a prior infection, whether logged in MDH’s data base or not. If the unvaccinated tend to be more likely to have protection from prior infection than the boosted then that may explain why the boosted have a higher case rate.
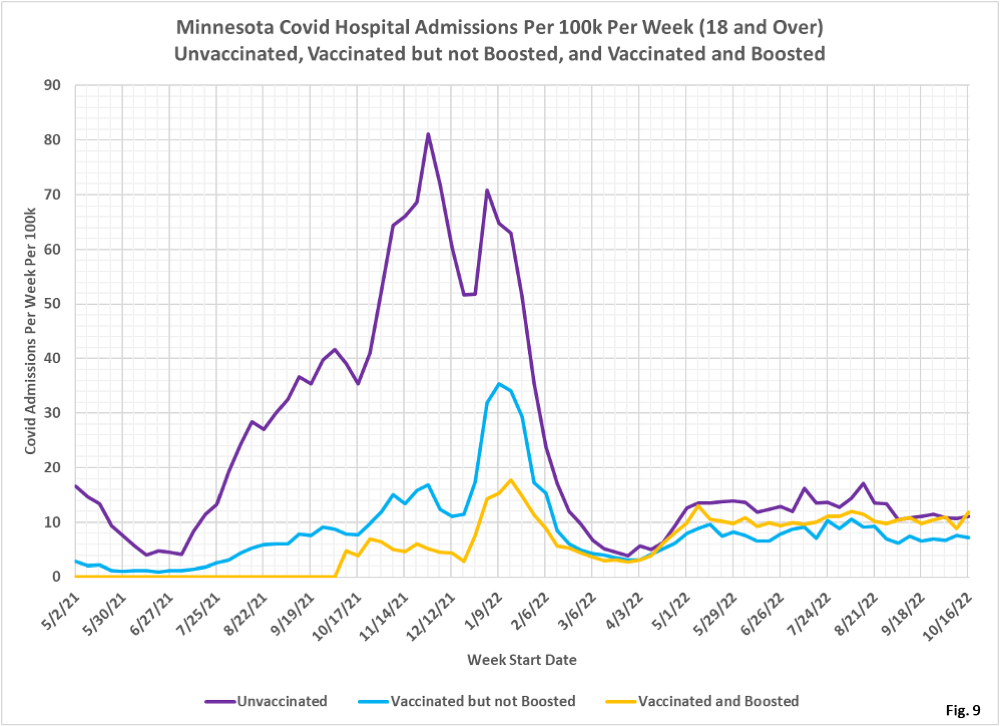
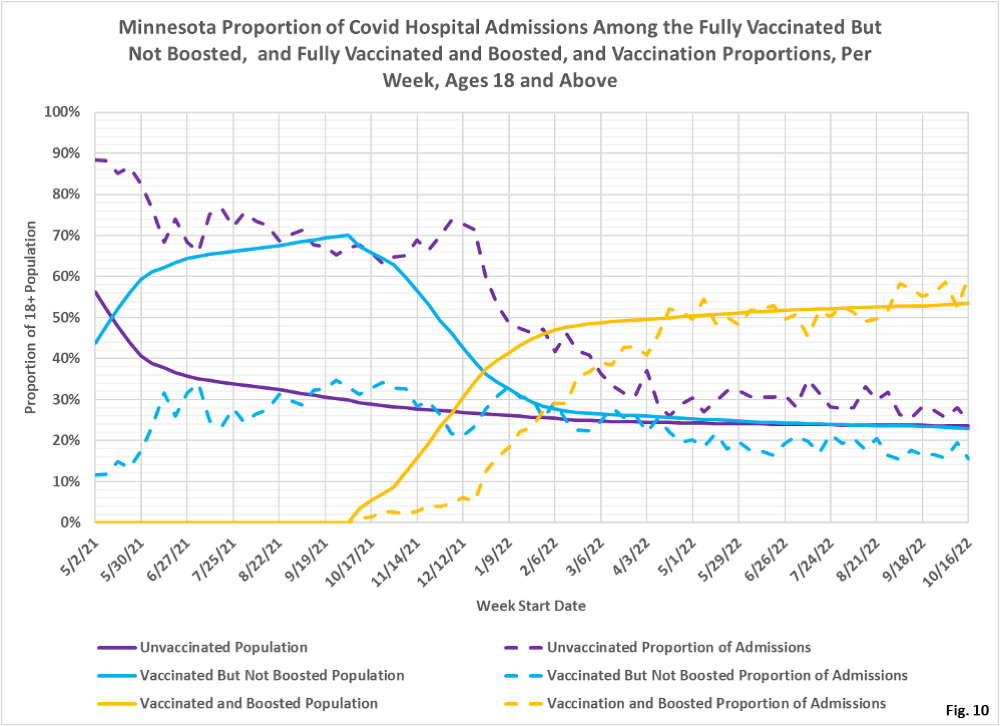
- Fig. 8-10: These charts display the hospital admissions, hospital admission rates per 100k, and hospital admissions proportions for the adult population, in an identical format to the case charts in Fig. 5 through Fig. 7. Fig. 8 shows that admissions rose considerably among the boosted for the week of 10/16/2022, after dropping the week before. The relatively constant numbers of admissions continues to seem remarkable. Fig. 9 shows the boosted have slightly higher rate of hospitalization per 100k for the week of 10/16/2022, while the vaccinated but not boosted have the lowest hospitalization rate, and the unvaccinated in the middle. Fig. 10 shows that the unvaccinated made up 23% of the population the week of 10/09/2022 and accounted for 25% of the admissions, while the vaccinated but not boosted made up 23% of the population but only accounted for 15% of the admissions, and the boosted made up 53% of the overall population and accounted for 60% of admissions. The proportion of weekly admissions for the boosted have basically matched the proportion of the adult population that is boosted since 4/17/2022, while the vaccinated have fewer admissions than the proportion of the population that is vaccinated.
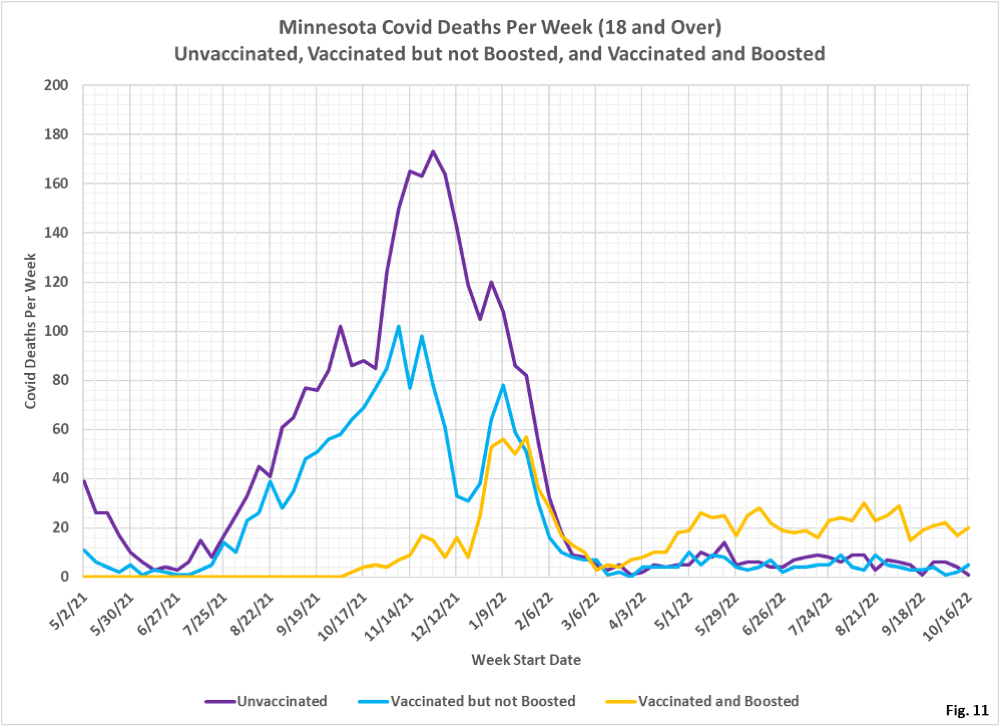
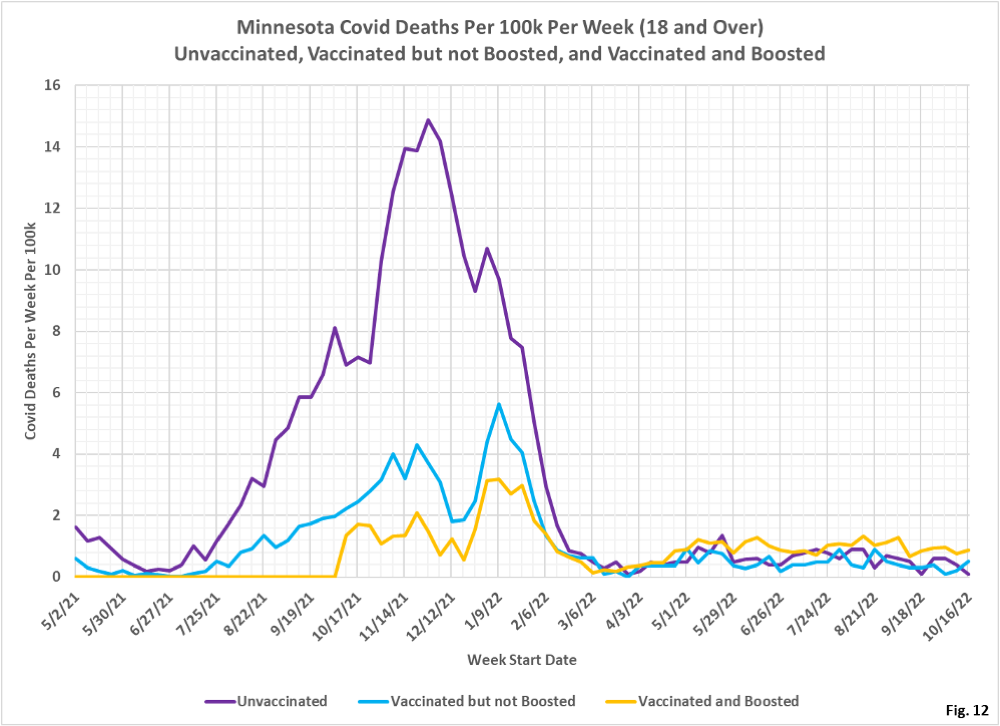
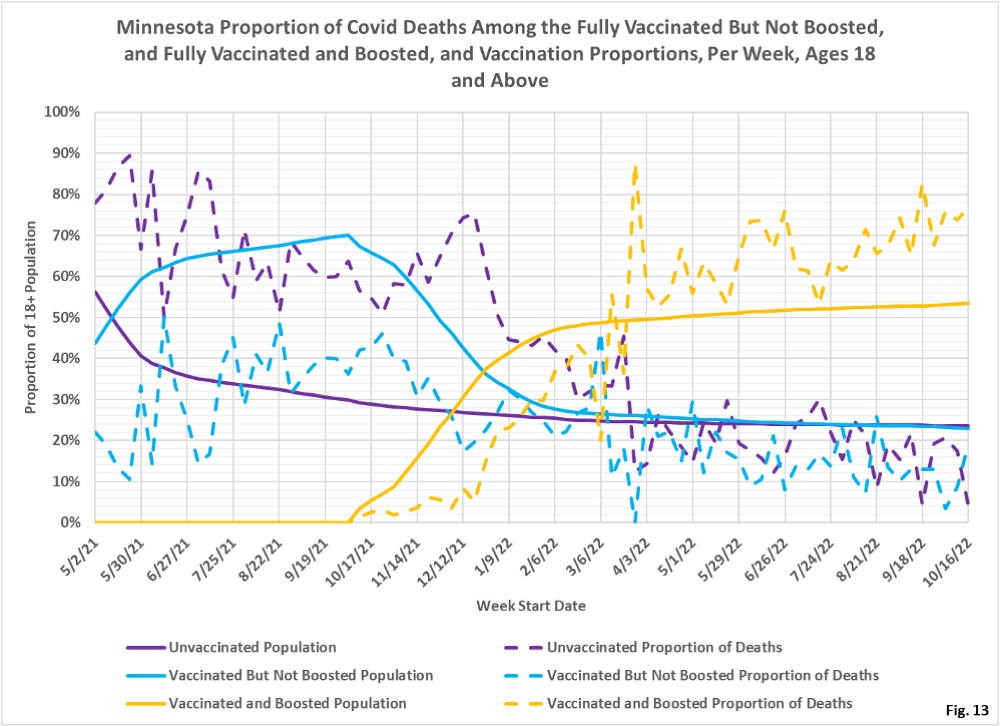
- Fig. 11-13: These charts display the deaths, deaths rates per 100k, and deaths proportions for the adult population, in an identical format to the case charts in Fig. 5 through Fig. 7. There have been more deaths every week among the boosted for many months. (Fig. 11). The death rates per 100k have also been highest among the boosted for many months, influenced by the death rates for the elderly who have had booster shots (Fig. 12). For the week of 10/16/2022, the boosted make up 53% of the adult population but account for 77% of the weekly deaths, while the unvaccinated make up 23% of the population but account for only 4% of the deaths, while the vaccinated made up 23% of the population but accounted for only 19% of the deaths (Fig. 13).
- MDH defines the fully vaccinated (what we have termed vaccinated but not boosted) as those who have not received a booster after completing their primary vaccination series, and had been vaccinated at least 14 days prior to testing positive.
- MDH defines the boosted as those who have received any additional vaccination shots after completing their primary vaccination series, and also received the booster at least 14 days prior to testing positive. In addition, booster doses were only counted after 8/13/2021, the date the CDC first began recommending booster shots.
