There are age-related effects in the data, as well as some issues about relative testing rates across ages and incidental hospitalization variation by age, but boosting in particular looks pretty ineffective after a short time.
Dave’s notes:
- This post is an update to the Covid vaccination breakthrough data table and charts for the overall Minnesota population published on 10/31/2022 here: https://healthy-skeptic.com/
2022/10/31/breakthrough- events-october-27/. This week’s update adds data through the week ending 10/09/2022, published by the Minnesota Department of Health (MDH) on 11/03/2022. The revisions to the older data have really settled down as we get further past the changes to the data processing algorithm MDH made starting on 10/06/2022. - The breakthrough data files are available from MDH here, https://www.health.state.mn.
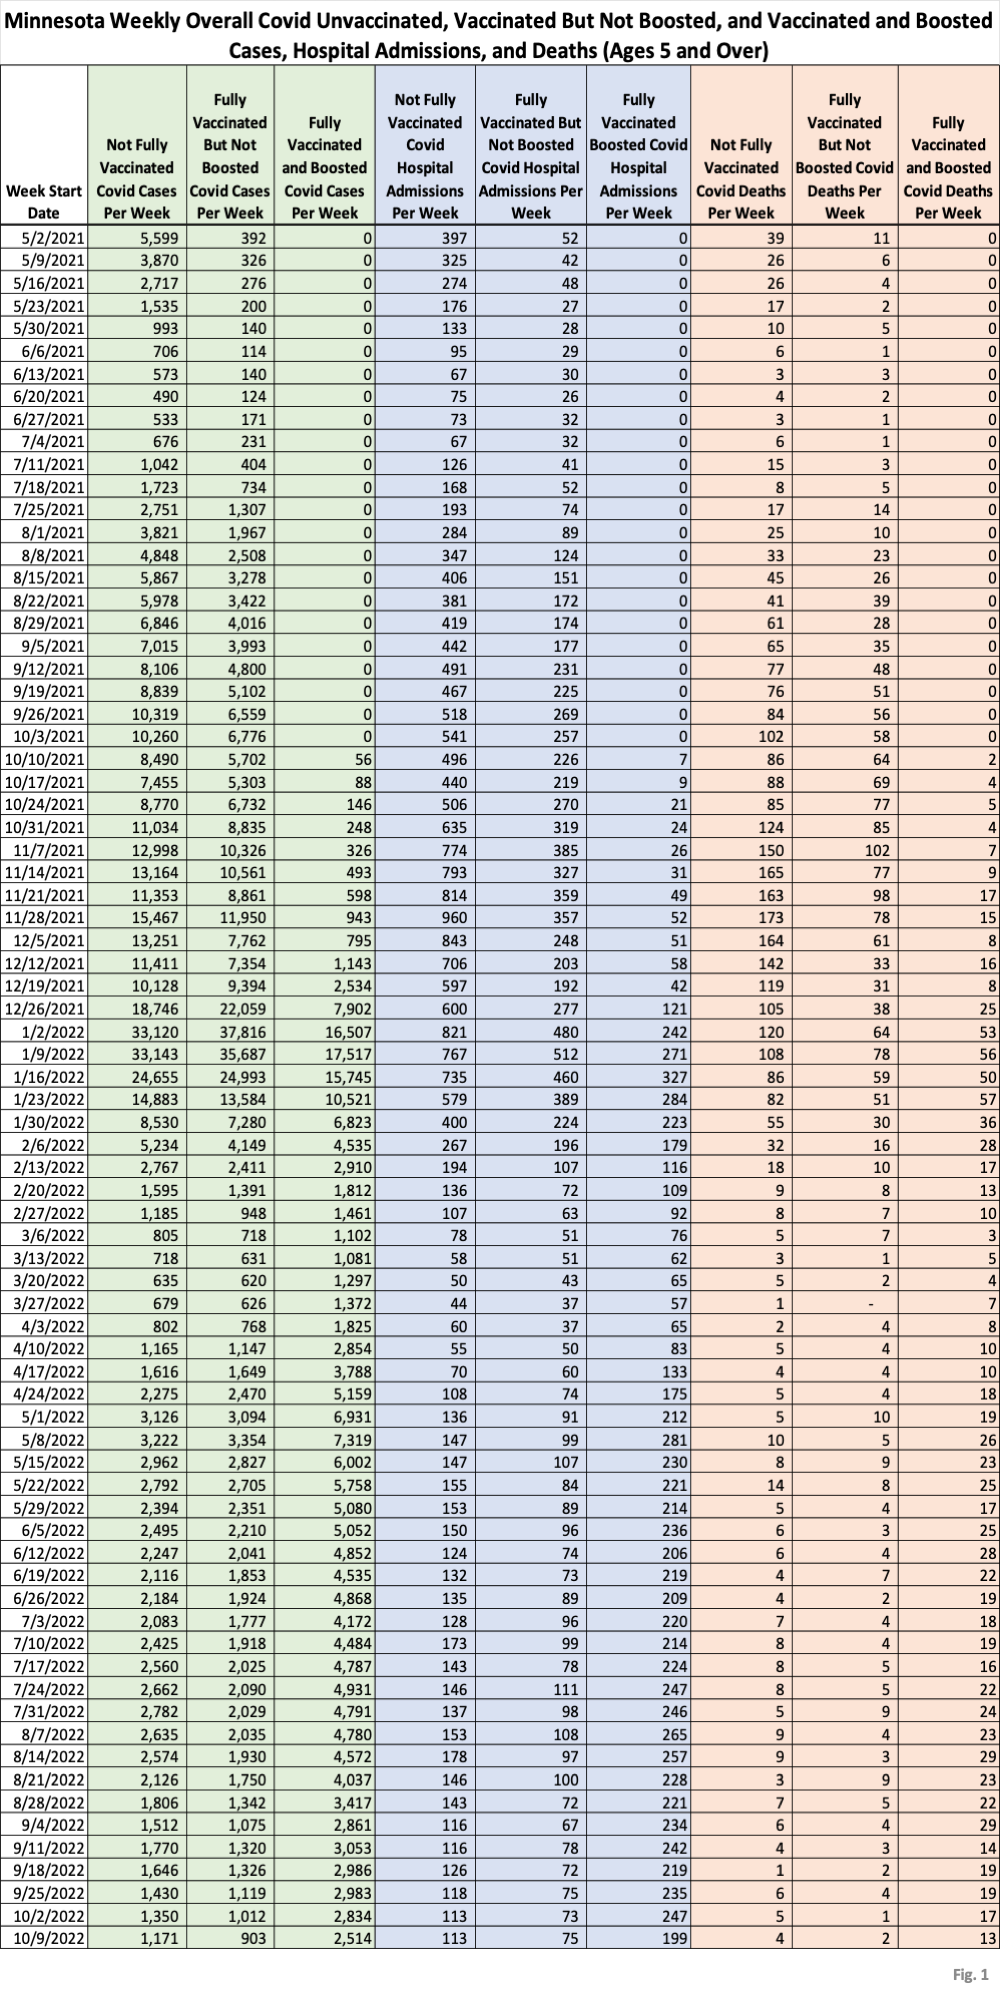
us/diseases/coronavirus/stats/ vbt.html , in the notes under the graphic images. - Fig. 1: This table displays the total cases, hospital admissions, and deaths that occurred each week among the unvaccinated, vaccinated but not boosted, and vaccinated and boosted populations. Data through the week of 10/09/2022 has been added this week. The very gradual reduction in cases, hospital admissions, and deaths that we have seen for several months continues. It is really remarkable how linear the decrease is. Also notable is that there is no hint of a rise in cases as winter approaches, although this Fall in Minnesota has been very mild.
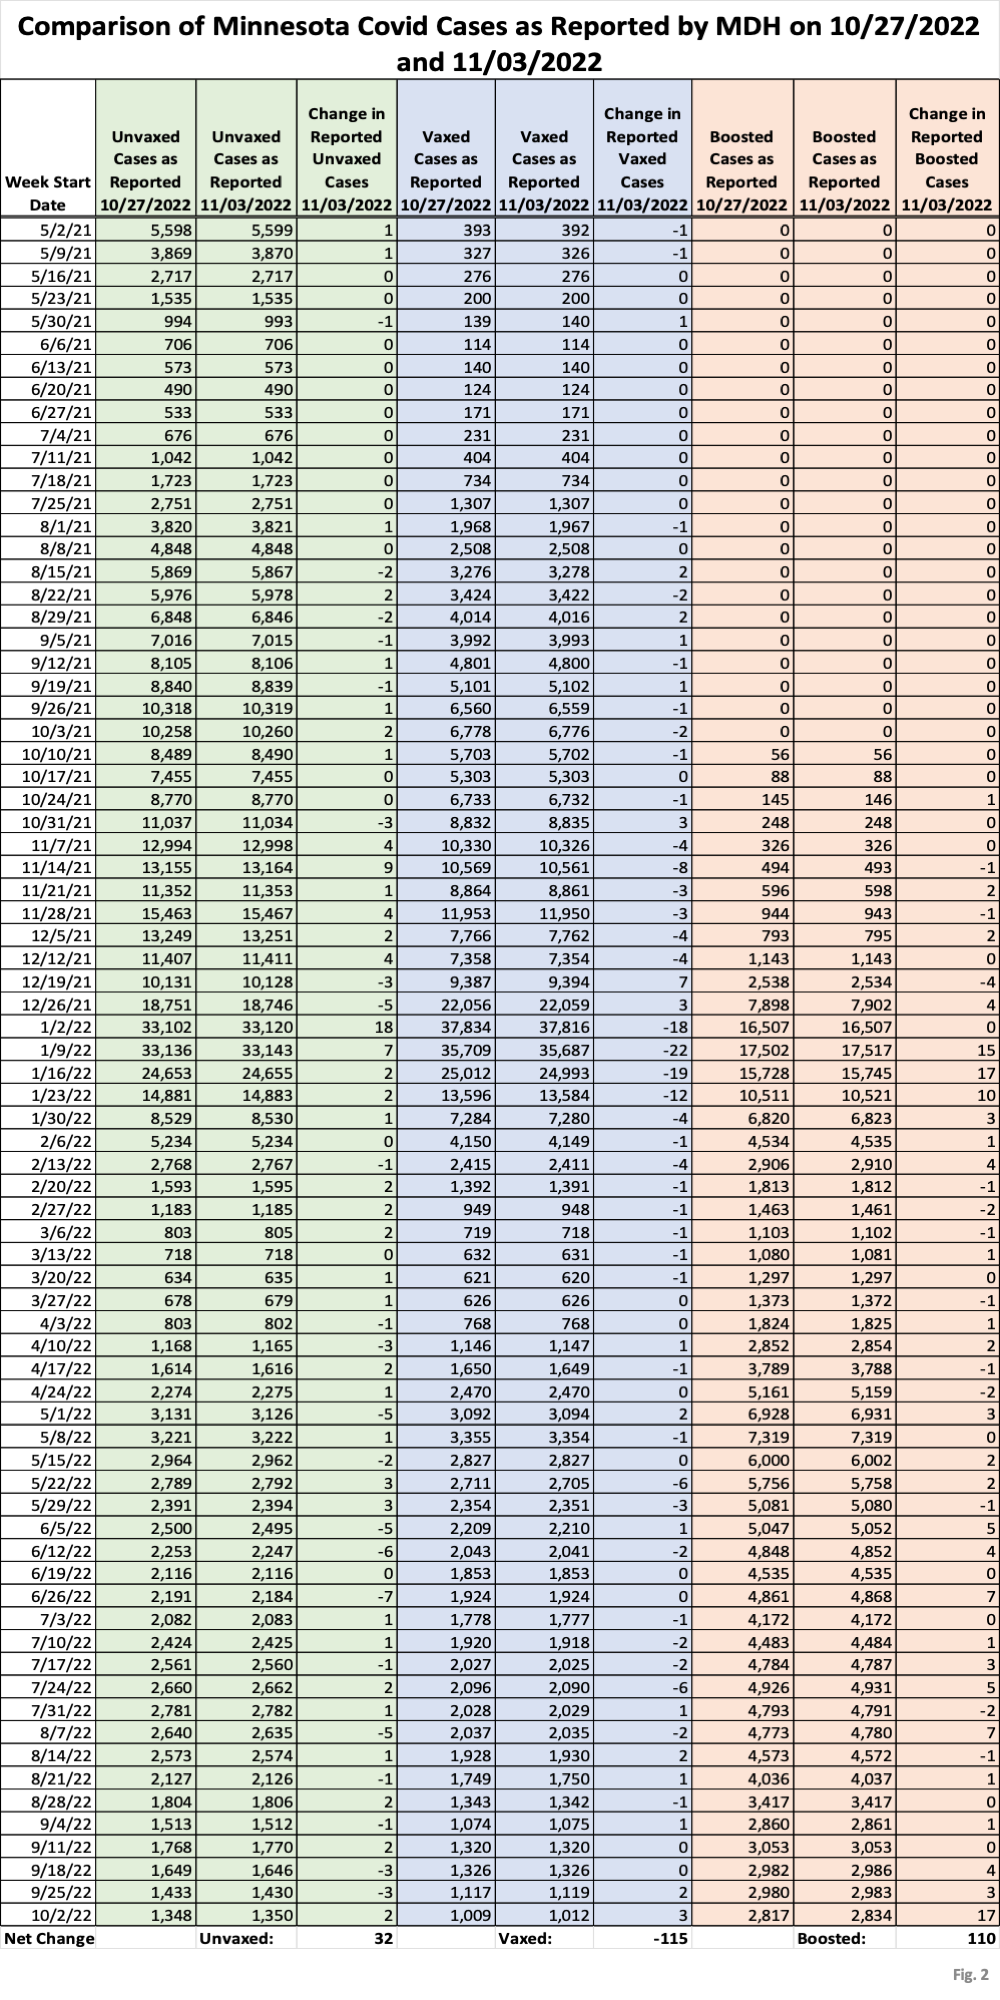
- Fig. 2: This data table displays the numbers of cases among the unvaccinated, vaccinated, and boosted, as published by MDH on 10/27/2022 and on 11/03/2022, as well as the net change each week. While there are changes in the data each week, the net change over the whole range in dates is a small increase in the number cases among the unvaccinated (+32 cases), a decrease in cases among the vaccinated (-115 cases), and an increase in cases among the boosted population (+110 cases). The magnitude of changes to cases is roughly half the magnitude of the prior week’s changes.
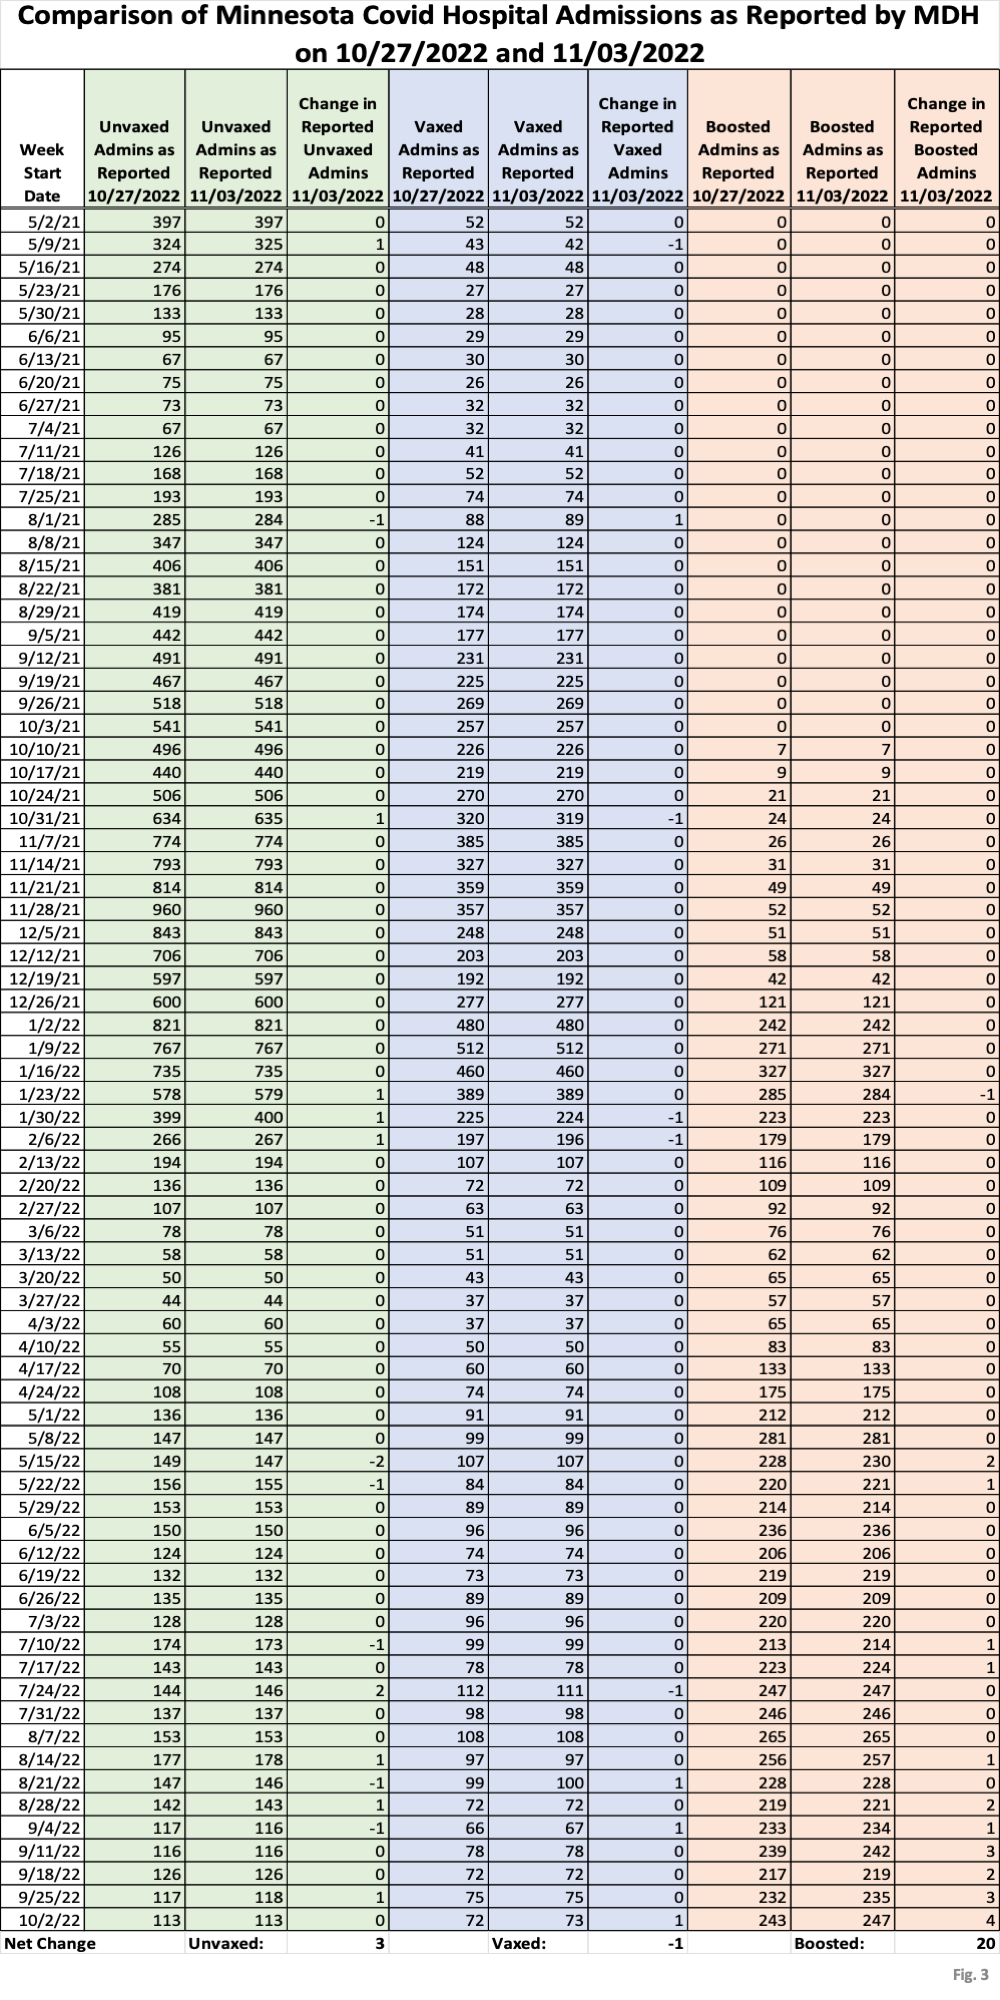
- Fig. 3: This data table displays the numbers of hospital admissions among the unvaccinated, vaccinated, and boosted each week as published on 10/27/2022 and 11/03/2022, in the same format as for cases in Fig. 2. The magnitude of the revisions is even smaller than the changes made to past cases. There were 20 hospital admissions added to those who were boosted, mainly in the more recent weeks’ data.
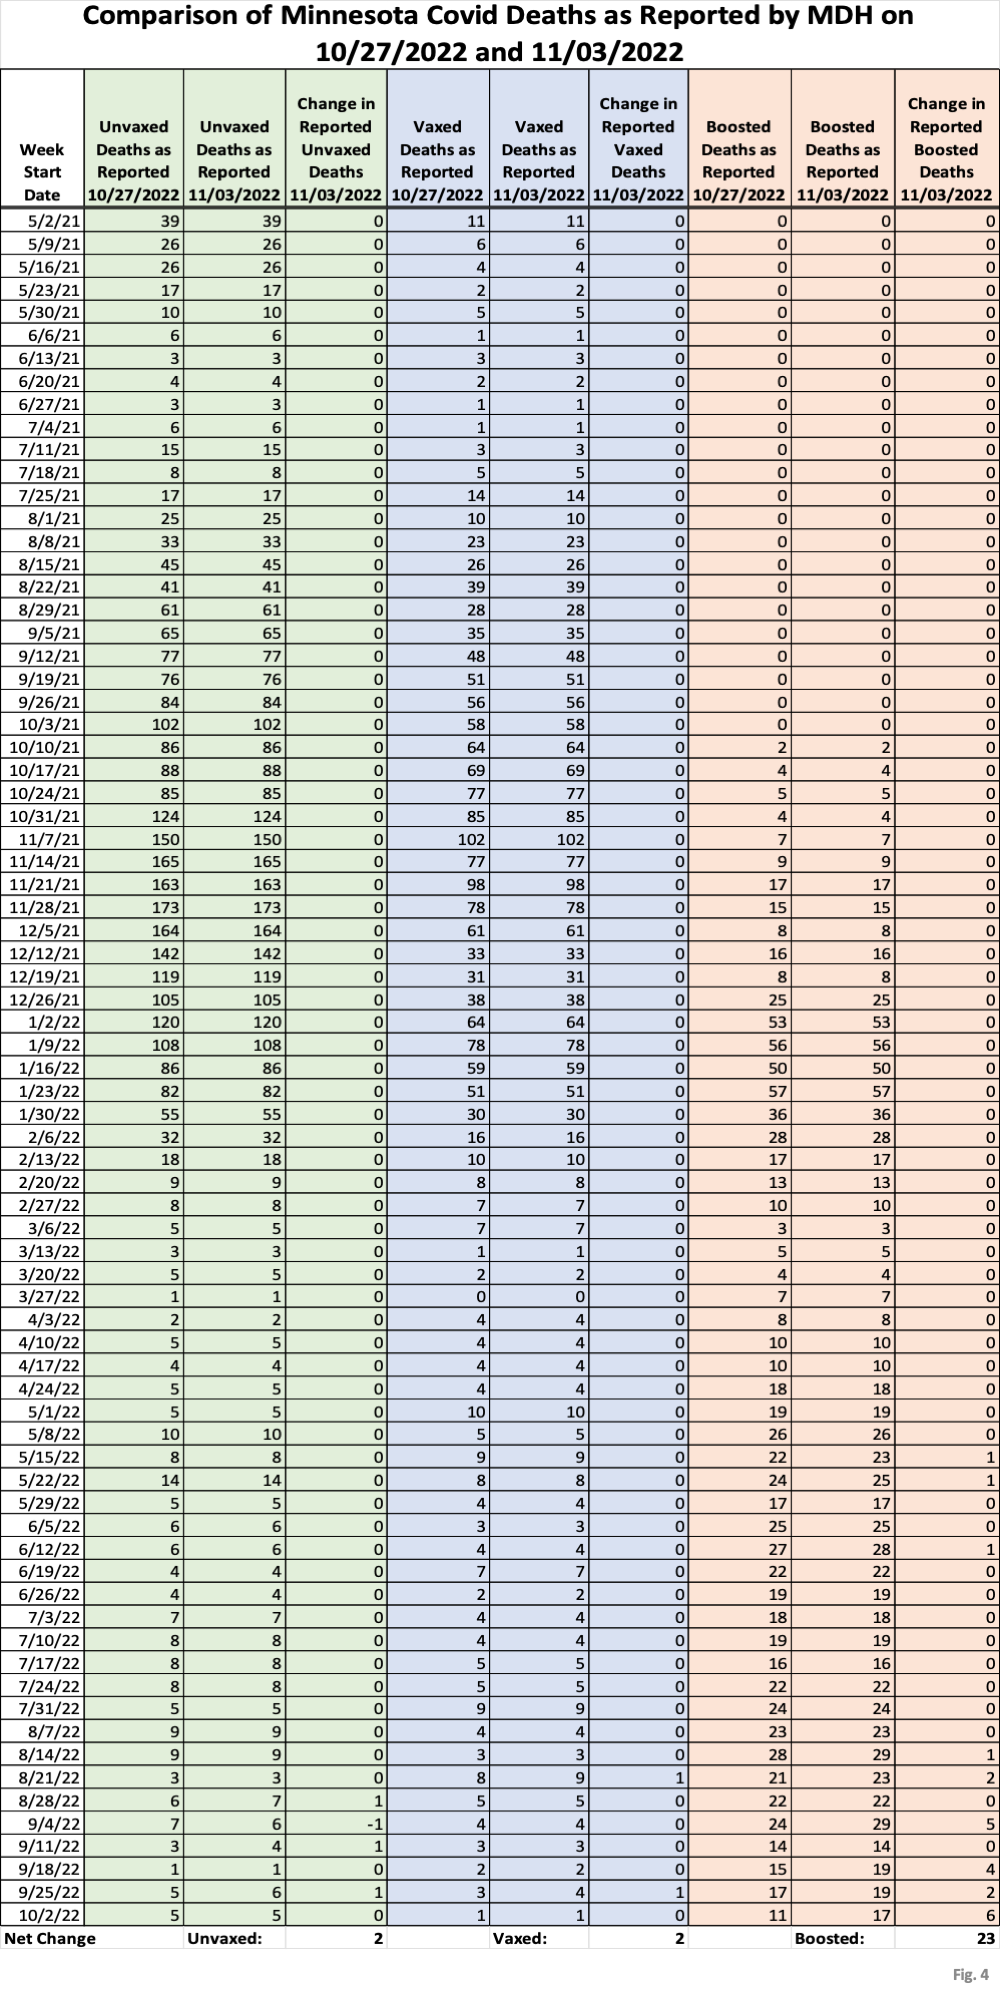
- Fig. 4: This data table displays the numbers of deaths among the unvaccinated, vaccinated, and boosted, as reported by MDH on 10/27/2022 and 11/03/2022. Revisions to older death records were relatively rare, with most of the 20 added boosted deaths occurring in more recent weeks, meaning that these are newly added death records, and not revisions to past data.
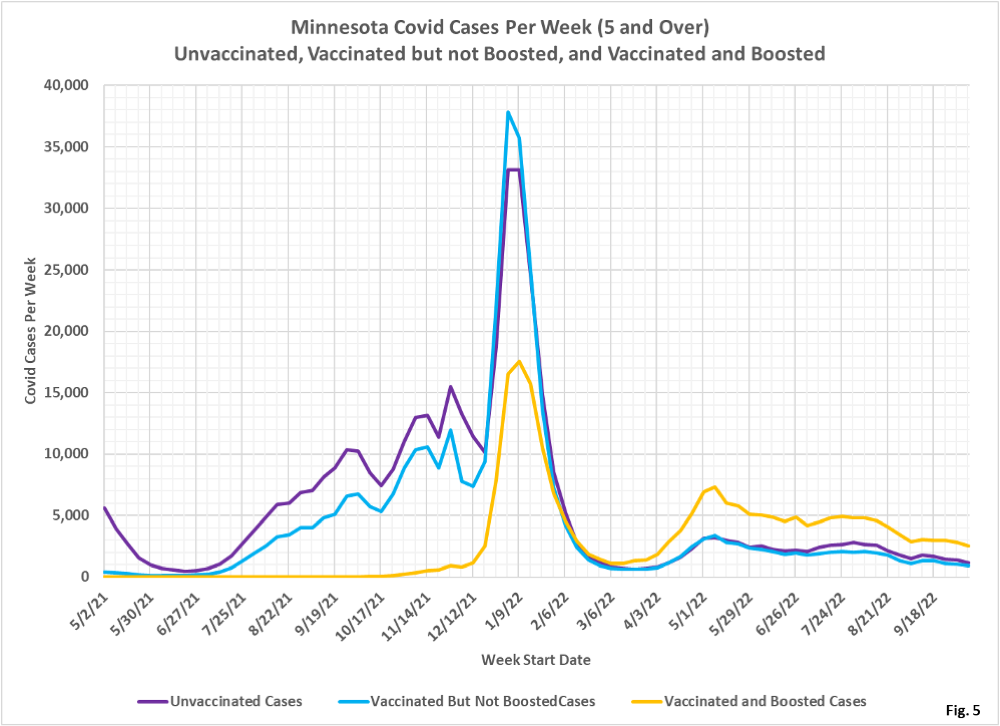
- Fig. 5: This chart simply plots the cases among the unvaccinated, vaccinated but not boosted, and vaccinated and boosted populations each week, as found in the data table in Fig. 1. Cases continue to fall very slowly.
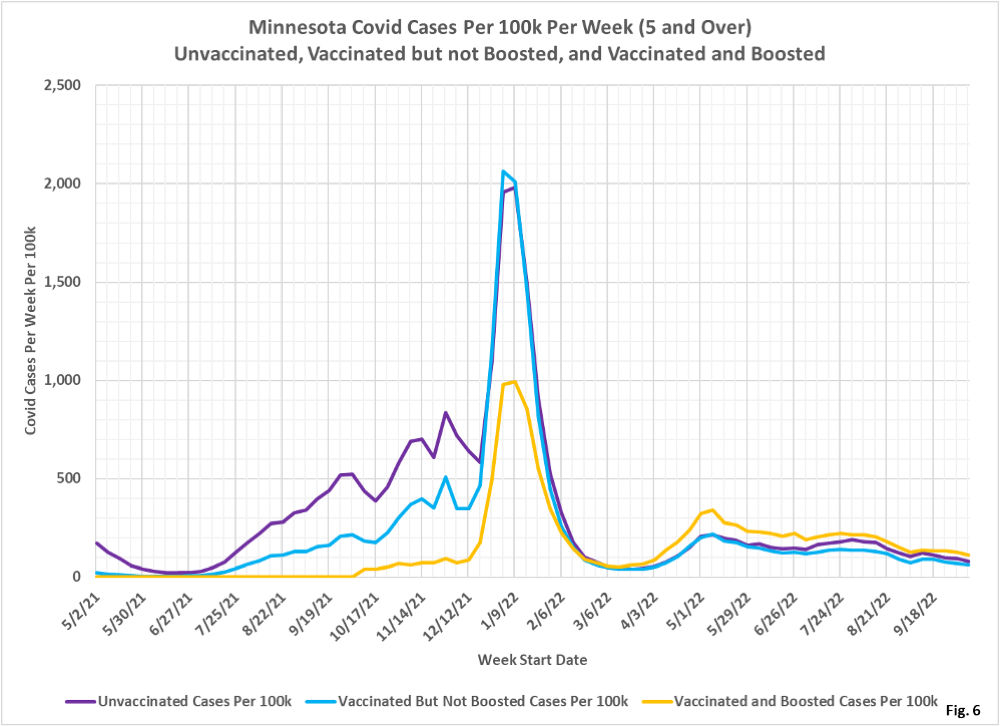
- Fig. 6: This chart displays the case rates per 100k for each group. When considered on an overall population basis the boosted have the highest rate per 100k of testing positive in recent data, followed by the unvaccinated, and then the vaccinated being the lowest. The boosted end up with the highest overall case rate due to the higher boosted case rates in the 18-49 and 50-64 age groups.
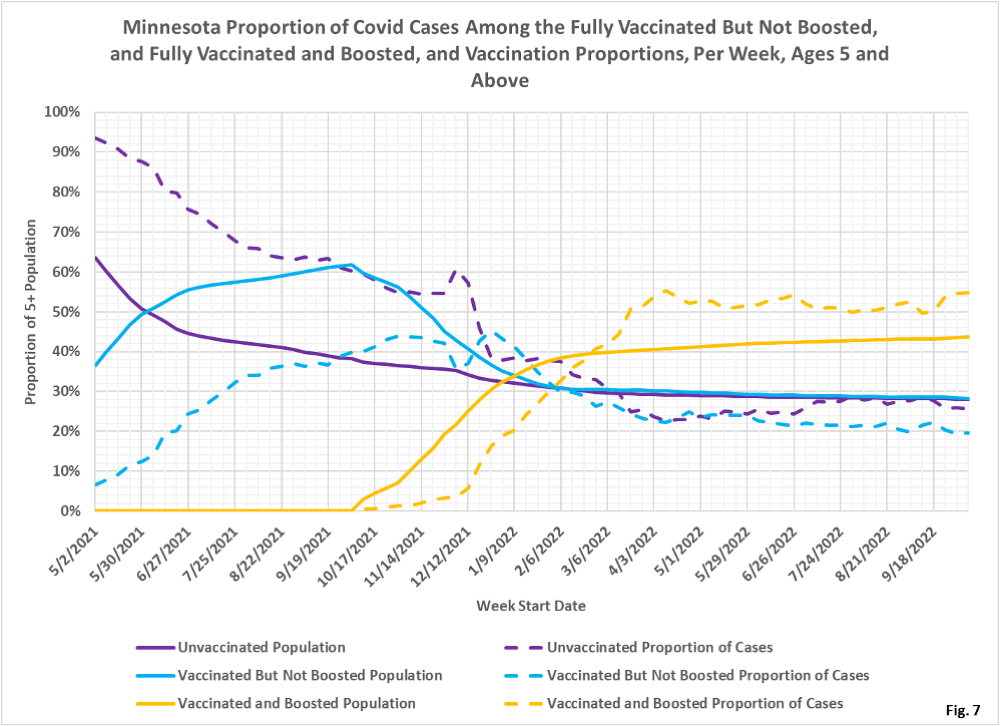
- Fig. 7: This chart displays the proportion of the 5 and over population who are unvaccinated (solid purple), vaccinated but not boosted (solid blue), and vaccinated and boosted (solid gold). For each population group we also display the proportion of cases each week (dashed lines of same color). The way to interpret this chart is to compare the proportion of breakthroughs to the proportion of vaccinations for each group. Whenever the dashed breakthrough proportion line is below the solid vaccination line of the same color, then that category is underrepresented for population, and when the dashed line is above the solid line of the same color then that category is overrepresented. For the week of 10/09/22 the boosted made up 44% of the overall population but accounted for 55% of the cases, while the vaccinated but not boosted made up 28% of the population but only accounted for 20% of the cases. The unvaccinated accounted for 28% of the population and accounted for 26% of the cases.
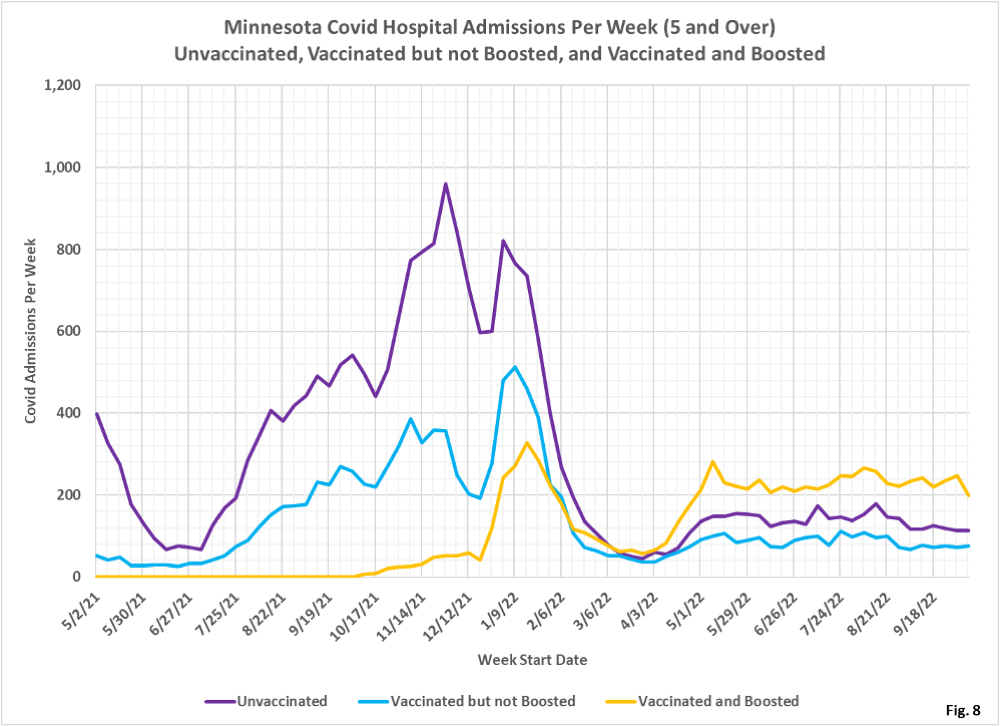
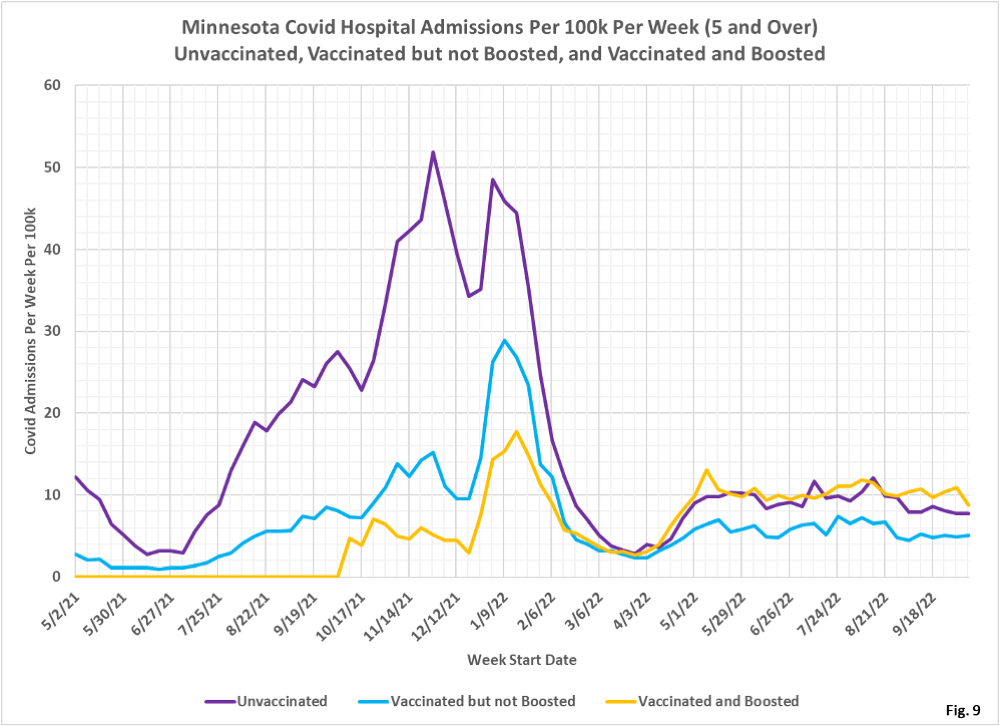
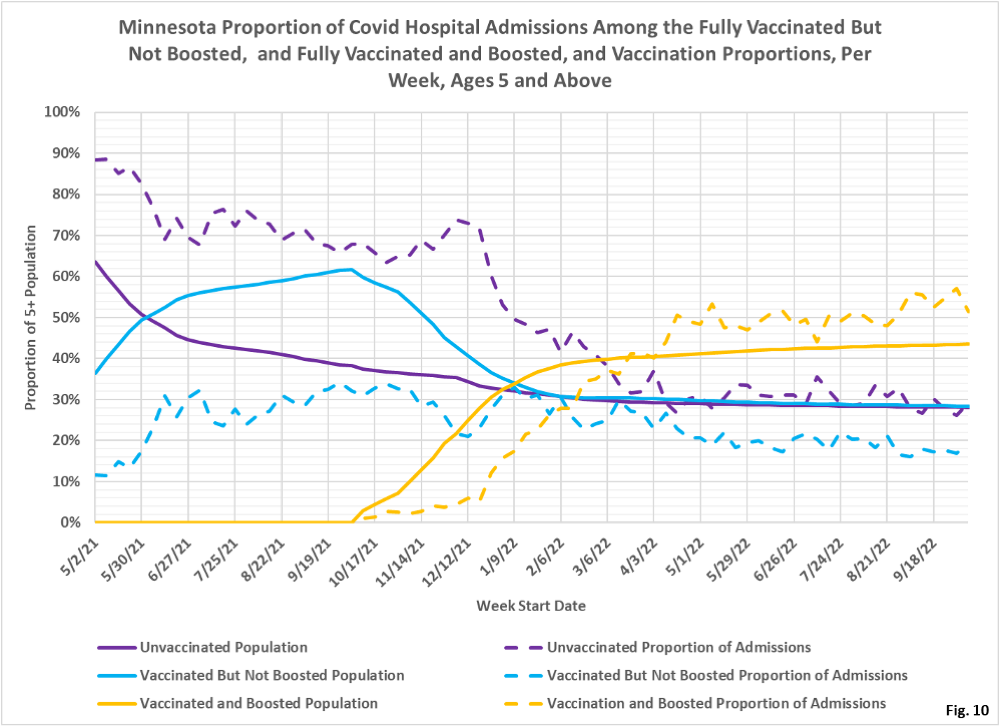
- Fig. 8-10: These charts display the hospital admissions, hospital admission rates per 100k, and hospital admissions proportions for the 5+ age group, in an identical format to the case charts in Fig. 5 through Fig. 7. Fig. 8 shows that admissions dropped considerably among the boosted for the week of 10/09/2022. This is likely just noise in the data, and not the start of a significant downward trend. The relatively constant numbers of admissions continues to seem remarkable. Fig. 9 shows the boosted have slightly higher rate of hospitalization per 100k for the week of 10/09/2022, while the vaccinated but not boosted having the lowest hospitalization rate, and the unvaccinated in the middle. Fig. 10 shows that the unvaccinated made up 28% of the population the week of 10/09/2022 and also accounted for 28% of the admissions, while the vaccinated but not boosted made up 28% of the population but only accounted for 19% of the admissions, and the boosted made up 44% of the overall population and accounted for 51% of admissions.
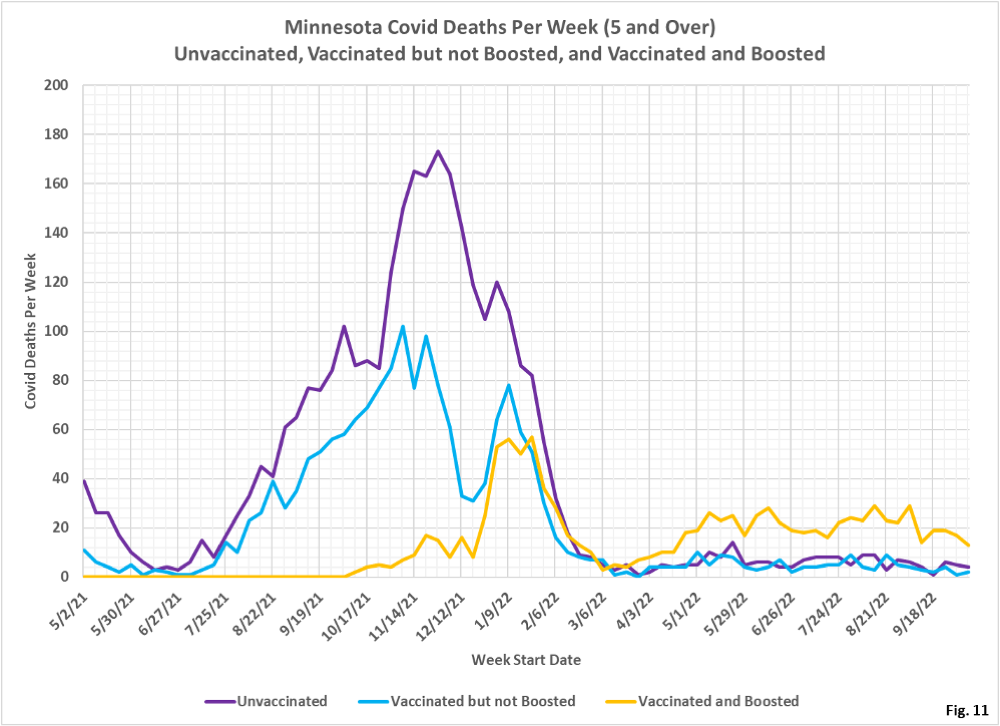
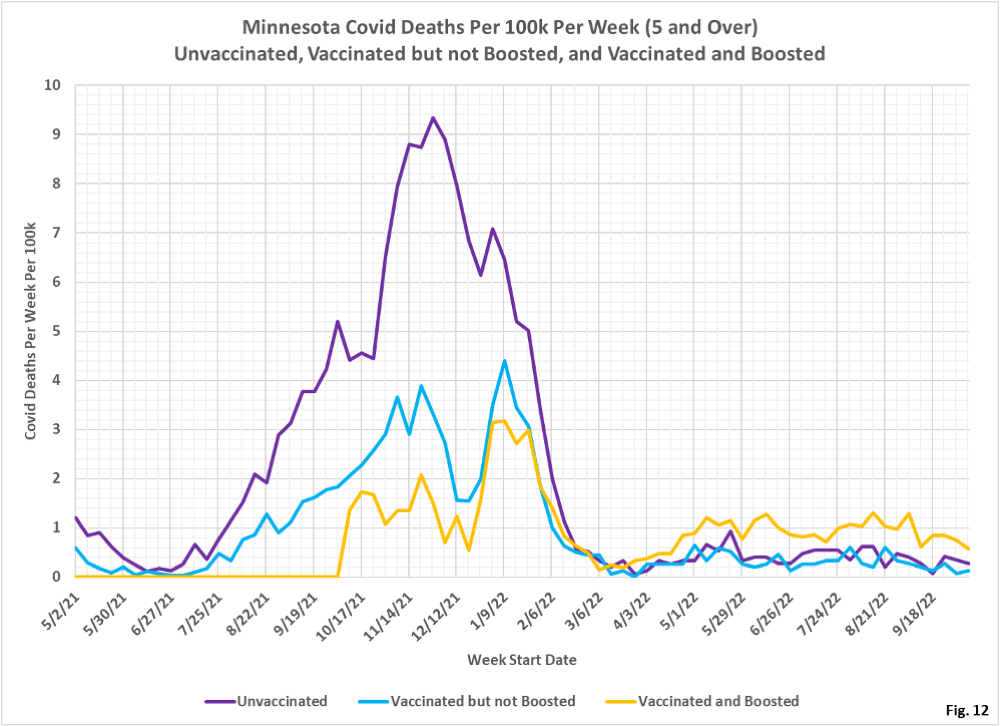
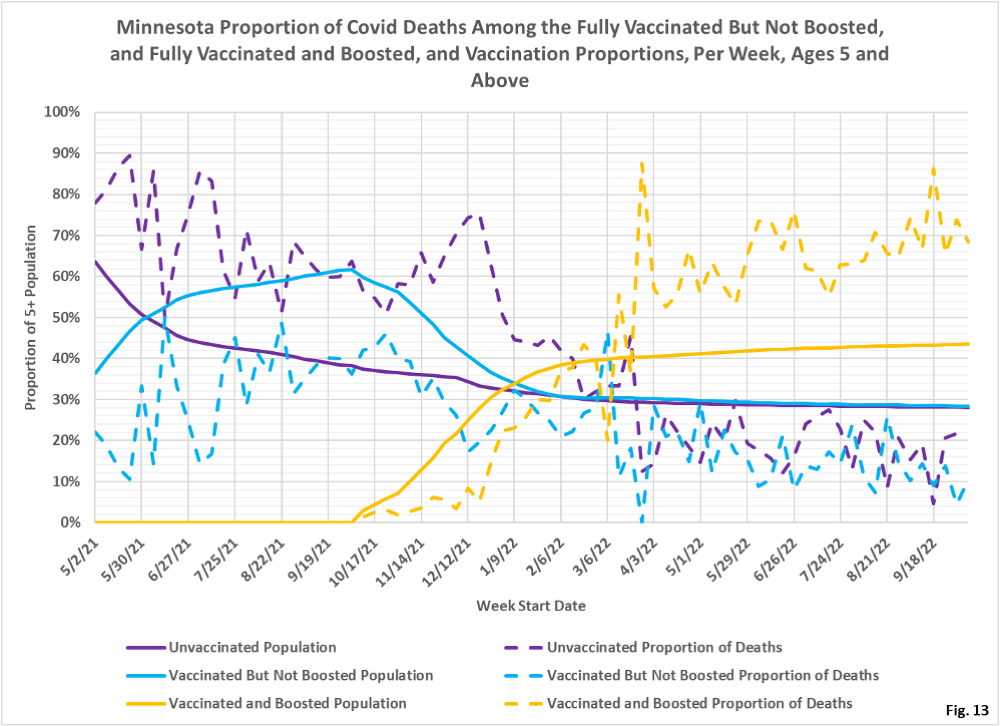
- Fig. 11-13: These charts display the deaths, deaths rates per 100k, and deaths proportions for the 5+ age group, in an identical format to the case charts in Fig. 5 through Fig. 7. There have been more deaths every week among the boosted for many months. Deaths in all three subgroups are trending lower for the past several weeks (Fig. 11). The death rates per 100k have also been highest among the boosted for many months, influenced by the death rates for the elderly who have had booster shots (Fig. 12). For the week of 10/09/2022, the boosted make up 44% of the overall population but account for 68% of the weekly deaths, while the unvaccinated make up 28% of the population but account for only 21% of the deaths, while the vaccinated made up 28% of the population but accounted for only 11% of the deaths (Fig. 13).
- MDH defines the fully vaccinated (what we have termed vaccinated but not boosted) as those who have not received a booster after completing their primary vaccination series, and had been vaccinated at least 14 days prior to testing positive.
- MDH defines the boosted as those who have received any additional vaccination shots after completing their primary vaccination series, and also received the booster at least 14 days prior to testing positive. In addition, booster doses were only counted after 8/13/2021, the date the CDC first began recommending booster shots.

What would be useful would be to know the numbers of the population in each category by week
we have given that periodically and can update it, but if you look at the rates and number of cases, you can always figure it out