 Dave’s notes:
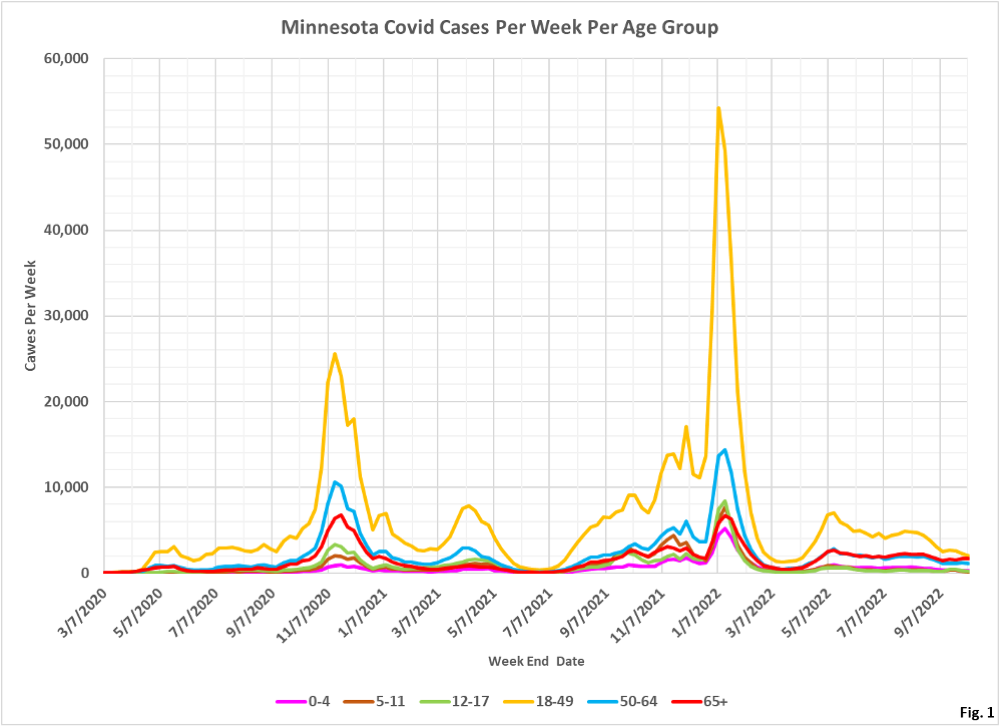
- These age structure charts display the number of Covid cases, ICU hospital admissions, non-ICU hospital admissions, and deaths in Minnesota each week, sorted by age group. These are an update of charts most recently published here on 10/02/2022: https://healthy-skeptic.com/
2022/10/02/age-structure- charts-september-29-raw- numbers/. - The data for the charts on cases comes from the data file “cage.csv”, Case Rate by Age Group, published by the Minnesota Department of Health (MDH) here: https://www.health.state.mn.
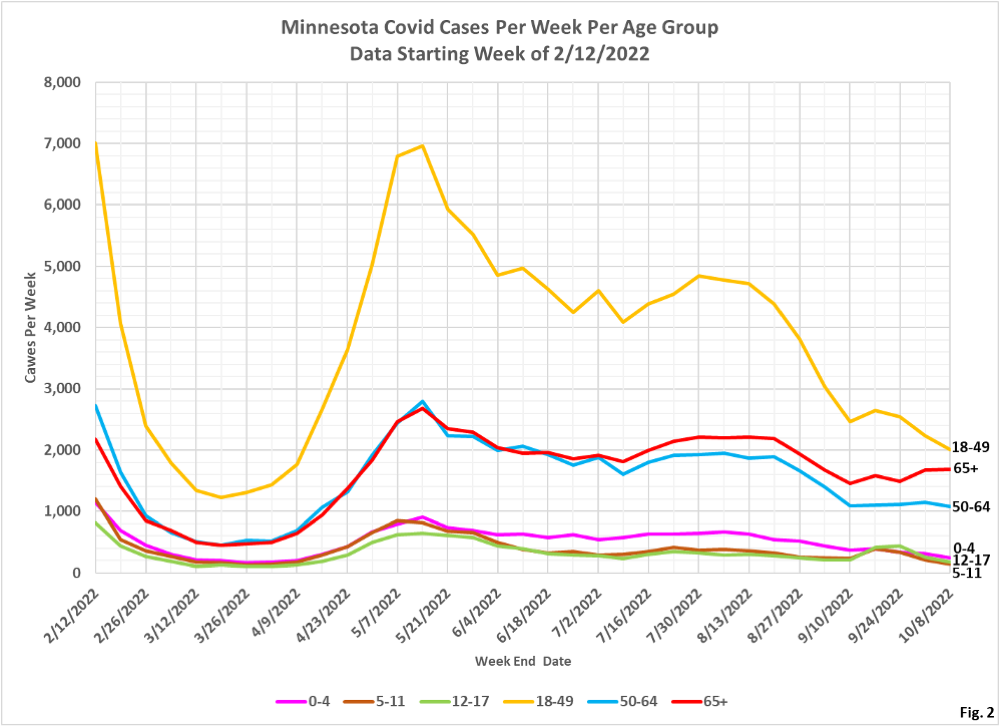
us/diseases/coronavirus/stats/ case.html. The link to the data file is located in the notes under the graphic “Case Rate by Age Group”. Similarly, the data for hospital admissions is taken from the data file “hage.csv”, Hospitalization Rate by Age Group available here: https://www.health.state.mn. us/diseases/coronavirus/stats/ hosp.html . The data in this data file is plotted without modification except that we are taking the difference between total hospital admissions and ICU admissions in order to display non-ICU admissions. Finally, the data for deaths is taken from the data file “dage.csv”, Mortality Rate by Age Group, available here” https://www.health.state.mn. us/diseases/coronavirus/stats/ death.html. - Fig. 1 and 2: Covid Cases Per Week. The reported Covid cases have resumed a gradual decline, except for the 65+ age group, which has had generally rising cases for the past 5 weeks.
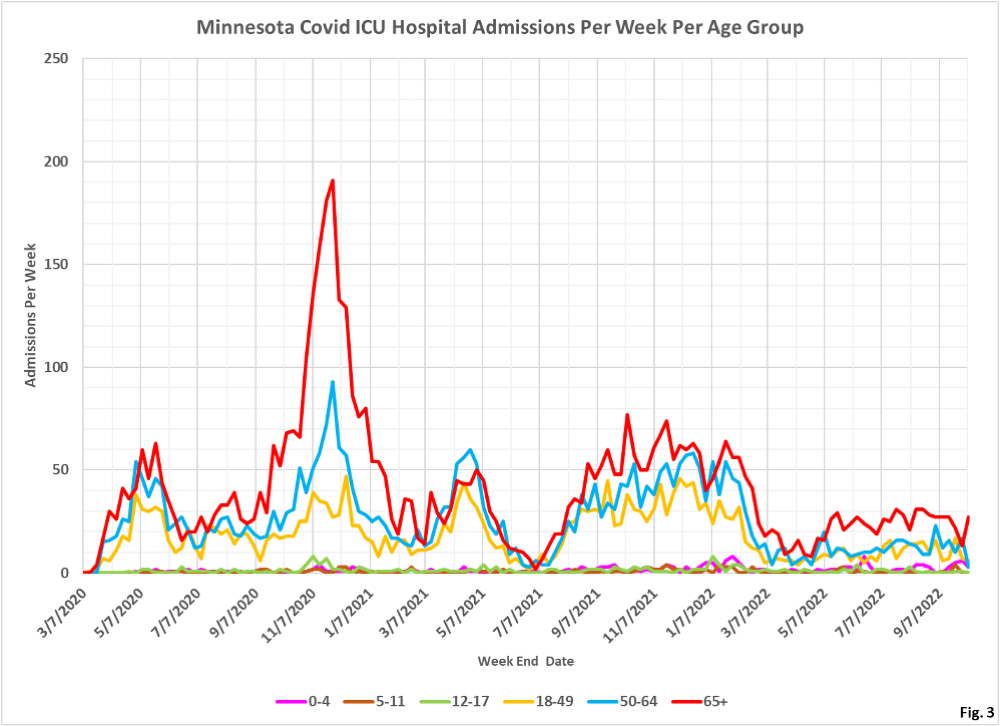
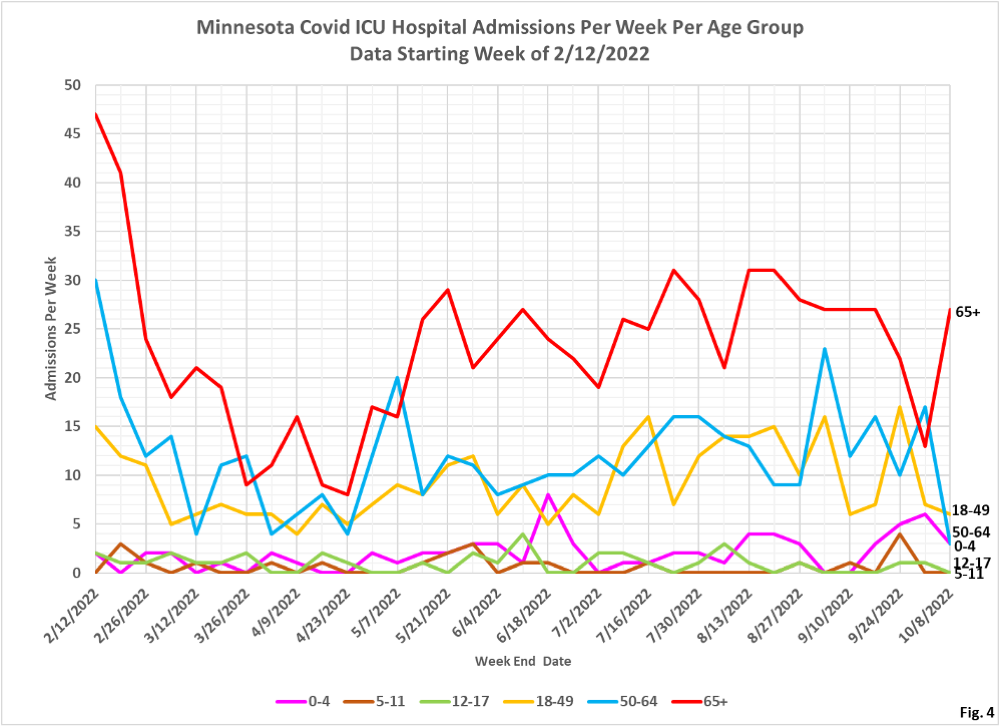
- Fig. 3 and 4: ICU Covid Admissions Per Week. ICU admissions look peculiar in the last several weeks. The 65+ age group has had very large changes in admissions the last 2 weeks, as well as the 50-64 age group. This data tends to be noisy anyway, so perhaps this is normal. We also remember that large numbers of Covid hospital admissions were actually admitted for something else, as reported by the StarTribune here: https://www.startribune.com/
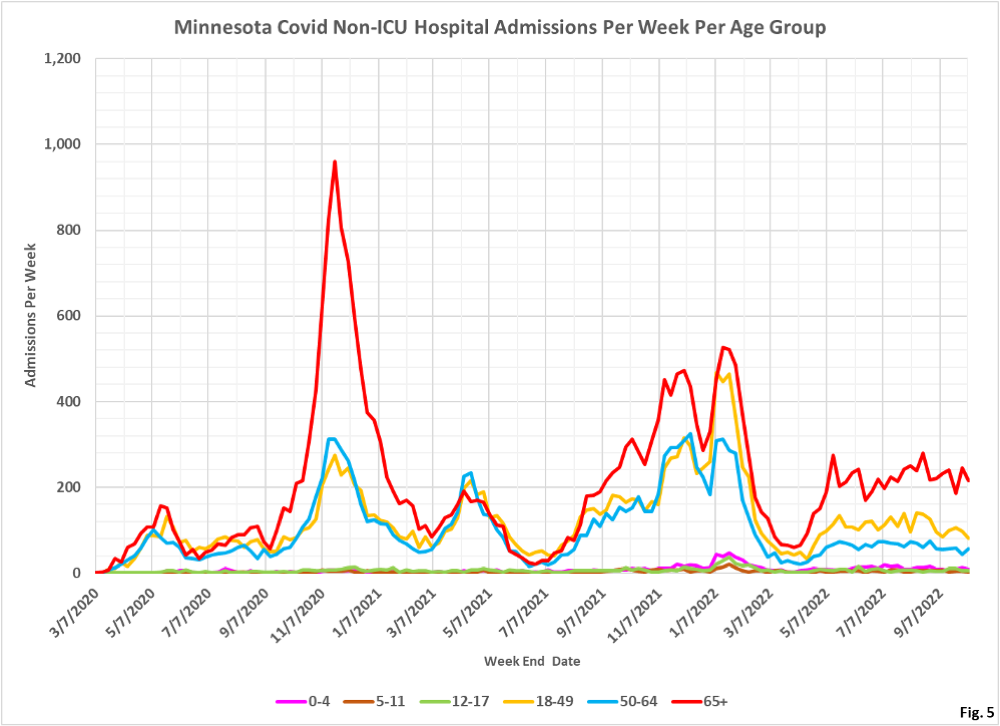
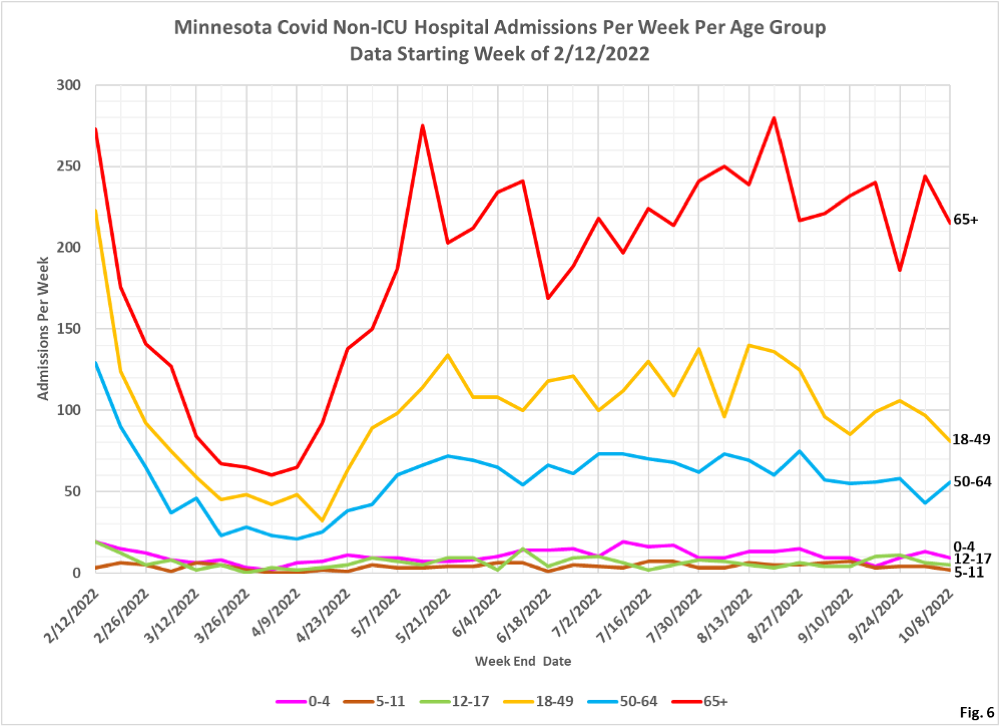
covid-19-levels-stubbornly- stagnant-in-minnesota/ 600201117/. Jeremy Olson reports that according to a hospital administrator, 50% to 75% of Covid hospitalizations were admitted for something else. - Fig. 5 and 6: Non-ICU Covid Admissions Per Week. Non-ICU admissions are still generally within the same range as they have been for the last several months. The StarTribune’s report of 50-75% incidental rate of Covid admissions is also applicable to Non-ICU admissions.
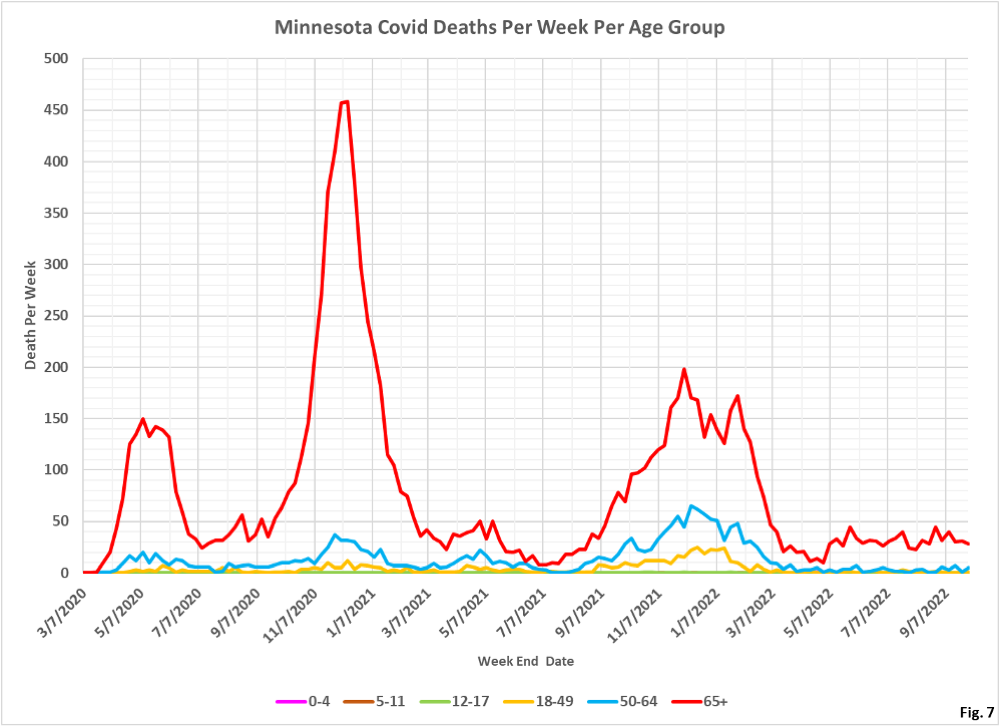
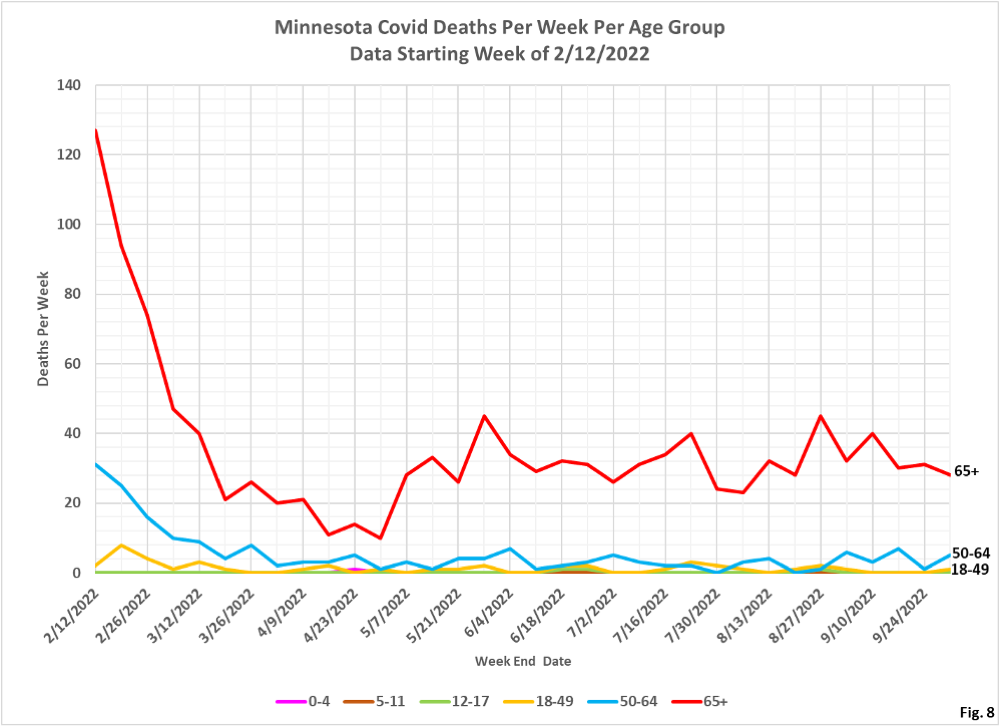
- Fig. 7 and 8: Covid Deaths Per Week. The last week of data is not displayed due to lags in reporting deaths. For the week of 10/01/2022 deaths in the 50-64 and 65+ age groups remain within the general trend for the last several months.
