Dave Dixon is going to keep updating information on energy prices because the current administration is lying about renewables being cheaper; is making all energy cost more; could open up the oil and natural gas spigot and see big reductions in price; but is totally owned by whacko environmentalists. What you will see in a few posts is how overall electricity costs are up, despite supposedly being helped by lower renewable prices; that natural gas prices are very high, which will impact what it costs a lot of people to heat their homes; and everything Bidementia does makes both problems worse. And energy plays a big, big role in overall inflation.
 Dave’s notes:
- These charts of US retail electricity prices are an update of the ones posted here on 9/07/2022: https://healthy-skeptic.com/
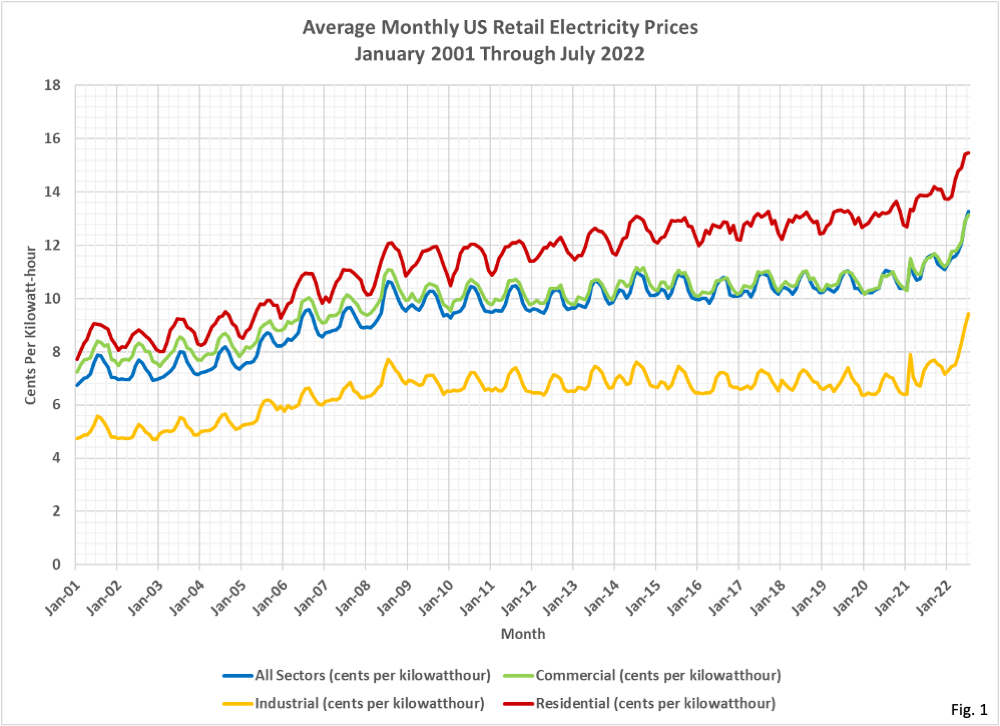
2022/09/17/updated- electricity-prices/. Today’s update adds prices for July 2022. The average residential price was 15.46 cents per kilowatt-hour in July, only .04 cents pe kilowatt-hr higher than June’s average price, but 11.5% higher year over year. Commercial prices were 13.15 c/kw-hr in July vs. 12.9 c/kw-hr in June, 14.2% higher higher than one year ago, and industrial prices were 9.43 c/kw-hr in June, up from 8.96 c/kw-hr in June, and 25.4% higher. - The U.S. Energy Information Administration (EIA) publishes average retail electricity prices since 2001. The raw data is available here: https://www.eia.gov/
electricity/data/browser/#/ topic/7?agg=2,0,1&geo=g&freq= M&start=200101&end=202205& ctype=linechart<ype=pin& rtype=s&maptype=0&rse=0&pin=. - Fig. 1 displays the average US monthly retail price per kilowatt-hour of electricity. These values are plotted from the EIA data without modification. While residential prices have basically stayed level from June’s prices, Commercial and Industrial prices have continued to rise steeply. In most typical years the highest prices of the year occurred in August, before dropping in the winter. However, 2021 and 2022 have not had the ‘normal’ price behavior so far.
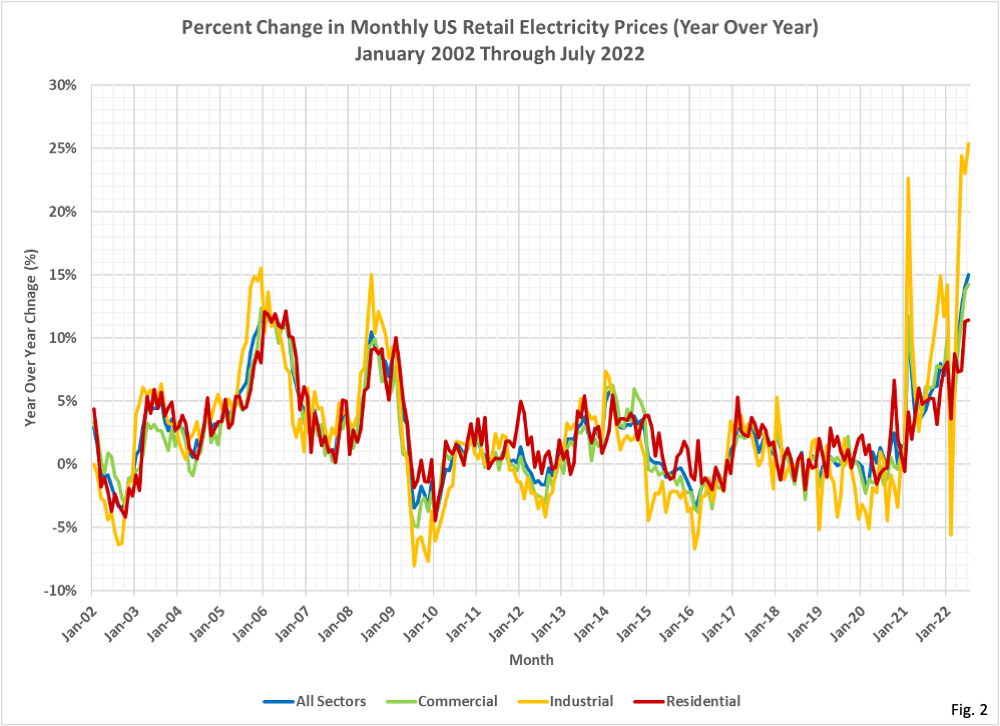
- Fig. 2 displays the rate of change in the average monthly price, year over year. We are calculating this change from the monthly price data displayed in Fig. 1. Residential prices in July were nearly the same as June, while Commercial and Industrial prices increased at the greatest annual rate in this data series. Commercial prices rose 1.9% month over month and 14.2% year over year. Industrial prices rose 5.2% month over month and 25.4% year over year.
