Dave Dixon worked in the energy industry for decades. So he can apply his outstanding data and analytics talent to those issues. After seeing what Europe is going through it should be obvious to any Minnesotan and American that renewable energy is a fraud–it can never replace fossil fuels, unless you include nuclear power; it is environmentally unfriendly, and it is expensive. Read Dave’s notes below carefully. He took the largest wind and solar installations in Minnesota and compared their rated output–what the state claims the power generating capacity is, and what they actually produce throughout the year.
You will note first that as Dave explains, the state lies about the true capacity–instead of averaging throughout the year based on likely available sunshine or wind, the state just gives the maximum capacity in the most favorable way, ignoring the official definition. The second thing you will notice is that these installations never get close to their supposed capacity and in fact are most frequently far below it. Why–because the sun don’t always shine and the wind don’t always blow, although the Incompetent Blowhard attempts through a blizzard of words to keep those turbines spinning.
In winter in Minnesota we have 8 to 9 hours of sun; very low, non-intense sunlight, if it isn’t cloudy and it often is. The wind doesn’t blow that much either. And we have basically no battery storage if there ever were excess power generated compared to demand. We would need about three times the stated output of all these installations to even get close to meeting demand, and we would need massive battery plants, which are environmental nightmares. The land needed for these projects would be enormous. But the green whackos just keep charging (pun intended) ahead to disaster–extremely high-cost, extremely unreliable electrical generation.

 Dave’s notes here:
- Recent news of the approval of construction of a 460 MW solar power electrical generating facility in Becker, MN, touted as the largest solar plant in the Midwest, prompted us to investigate how solar and wind power performs in Minnesota. The Minneapolis StarTribune reports on approval of the project here: https://www.startribune.com/
xcel-gets-ok-to-build- minnesotas-largest-solar- plant-in-becker/600207213/. This new solar power plant is to be built adjacent to the Sherco coal-fired powerplant, its three generators scheduled to be shut down in 2023, 2026, and 2030. The combined capacity of the Sherco coal facility is 2500 MW. As seen with the performance of existing solar facilities in Minnesota, while the peak output of this new solar facility may indeed be 460 MW, the actual output throughout the year will be expected to be far lower. - The U.S. Energy Information Administration collects data on electrical generating facilities in the US that are 1 MW or larger, using Form 860. A description of this form and access to annual data archives is located here: https://www.eia.gov/
electricity/data/eia860/. This data includes Nameplate Capacity (MW), Summer Capacity (MW), and Winter Capacity (MW). The instructions for Form 860 define the Net Generating Capacity for solar facilities as “For solar photovoltaic generators report the peak net capacity during the day for the generator assuming clear sky conditions on June 21 for summer capacity and on December 21 for winter capacity.” In other words, the Net Generating Capacity, or Nameplate Capacity, for solar plants is the output in summer during optimum conditions on the longest day of the year. We also note that in the database for Form 860, although there are separate fields for Nameplate, Summer, and Winter capacity, the same exact capacity is listed for all 3 fields. The EIA does not give specific instructions for wind facilities, but presumably nameplate capacity is the peak output when operating at the design wind speed. Winds speeds higher or lower than the design wind speed will result in lower net output. - The EIA also collects data for the actual amount of power generated at electrical facilities, using Form 923. A description of this form and access to the annual data archive is located here: https://www.eia.gov/
electricity/data/eia923/. This form includes the monthly power generated by each facility, expressed in MW-hours. A MW-hour is simply the amount of power that results from a generation rate of 1 MW over one hour. If we take the monthly power output of the facility, expressed in MW-hours, and divide by the number of hours in each month we can then calculate the average generation rate in MW for each month. - In the charts above we are displaying the monthly average power generation for the 4 largest solar generation facilities (Fig. 1 through 4) and the 4 largest wind generation facilities (Fig. 6 through 9) in Minnesota. In Fig. 5 and 10 we are converting the monthly power generation of the 12 largest facilities of each type into the percent of nameplate rating.
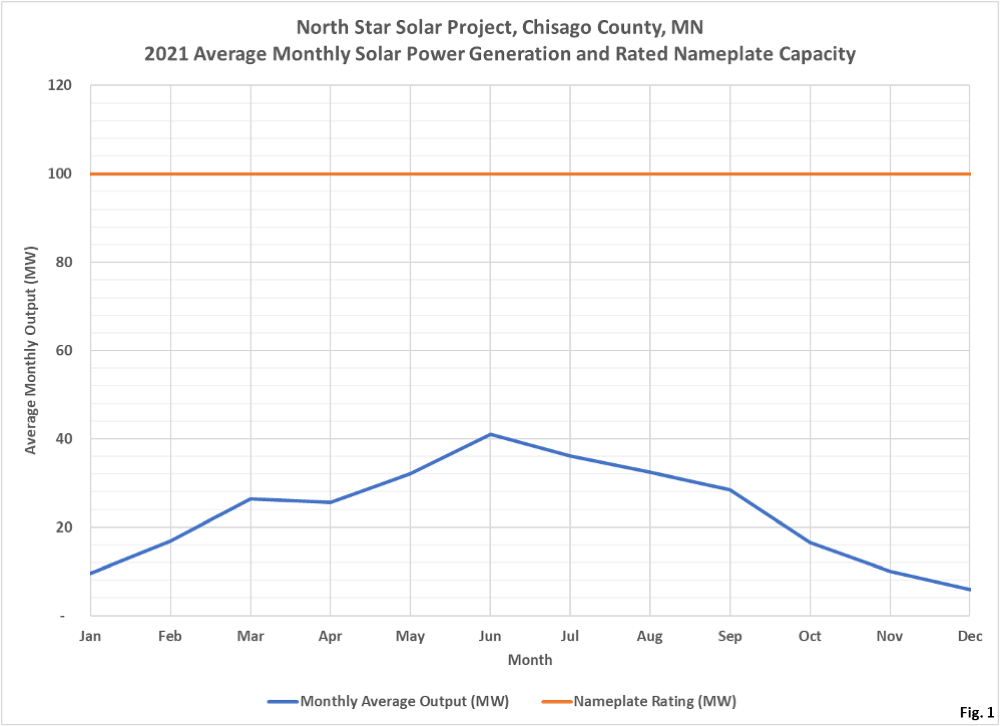
- Fig. 1: The current largest solar facility in Minnesota is a 100 MW unit located in Chisago County: https://www.
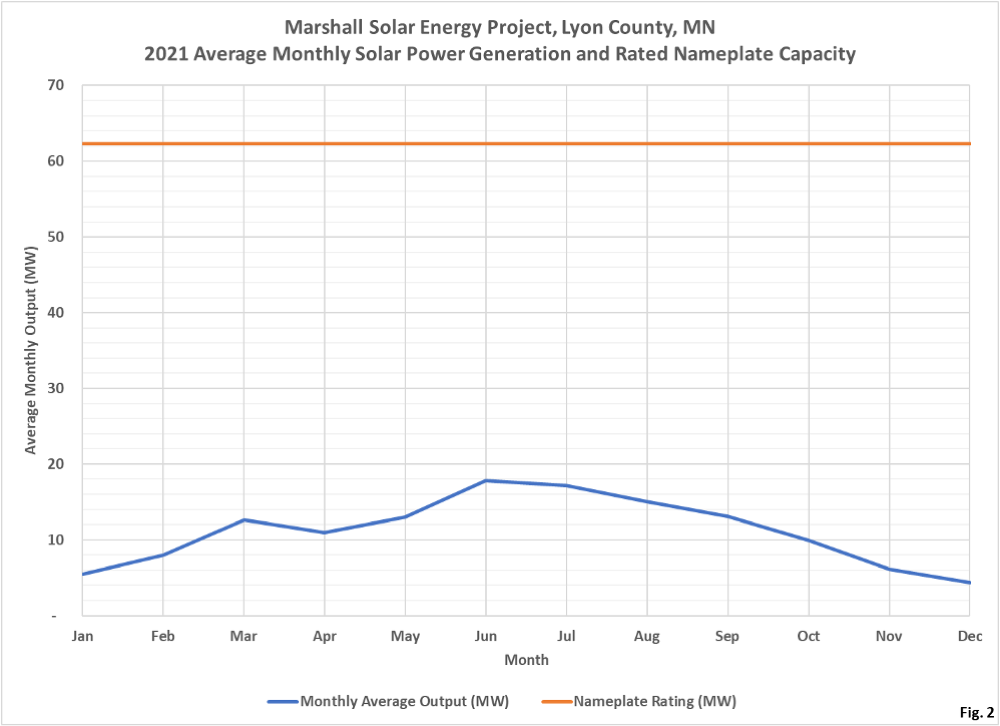
communityenergyinc.com/ projects/north-star-solar In the EIA database this facility is listed as having a 100 MW capacity for Nameplate Capacity, Summer Capacity, and Winter Capacity. A quick Google search shows that this facility is routinely described as a 100 MW facility in a variety of press releases and news articles. The peak monthly average output, averaged over 24 hours a day over the month of June 2021 was 41.1 MW. The lowest output was December 2021, which averaged 5.9 MW for the month. - Fig. 2: The Marshall Solar Energy Project is a 62.25 MW project located in Lyon County, Minnesota. A press release here announces its completion: https://www.
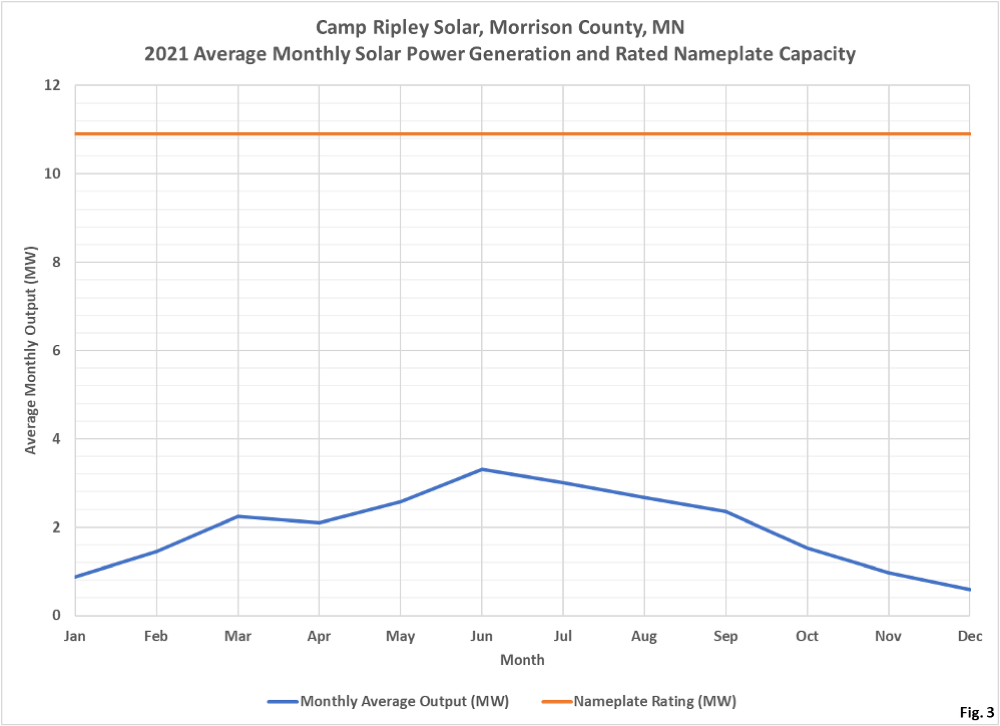
marshallindependent.com/news/ local-news/2017/01/marshall- solar-project-up-and-running- for-xcel-energy/ . The accompanying photo showing snow accumulated on the solar panels is a nice touch. In other press releases this facility is also claimed to have a 62.25 MW capacity, such as here: https://pv-magazine-usa.com/ 2017/01/23/xcel-commissions- 62-25-mw-minnesota-solar-farm/ . Clearly, the nameplate capacity listed in the EIA database is commonly referred to as the capacity for these solar facilities. This facility averaged 17.8 MW output in June 2021 and 4.4 MW in December 2021. - Fig. 3: Camp Ripley Solar is a 10.9 MW facility located in the central part of the state. A press release announcing its completion includes a nice aerial photo: https://www.inforum.com/news/
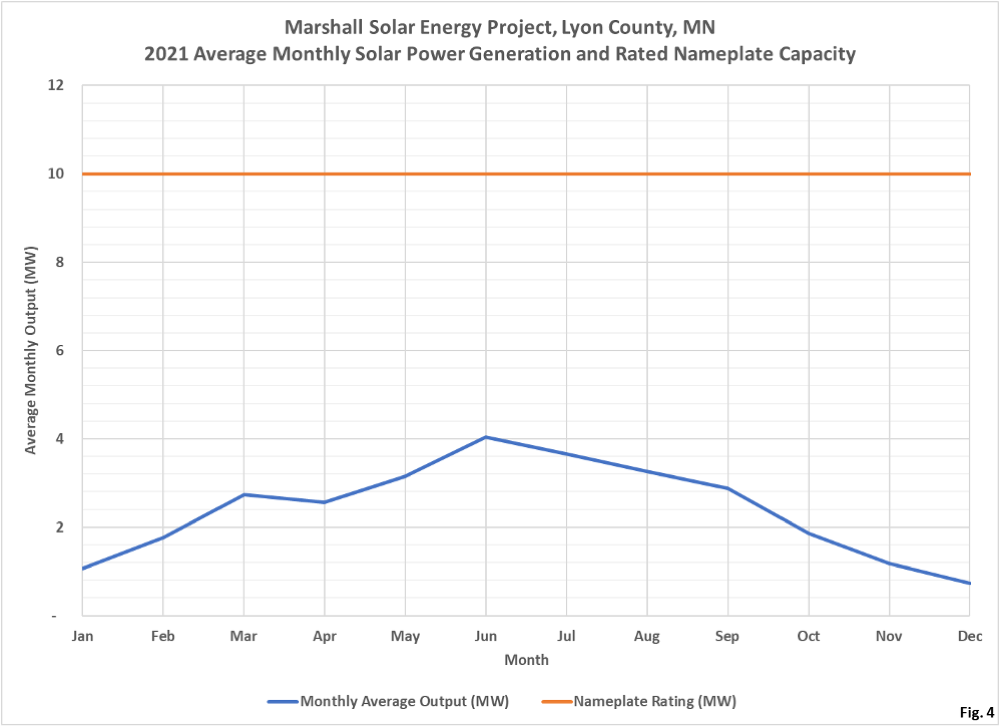
minnesota-power-dedicates-60- acre-solar-farm-at-camp-ripley . Another article describes damage sustained due to a tornado while it was under construction in 2016: https://www.fox9.com/news/ camp-ripley-buildings-solar- array-damaged-by-strong-storms . The highest monthly average output in 2021 was in June at 3.3 MW and the lowest in December at 0.6 MW. - Fig. 4: Albany Solar is a 10 MW facility in Stearns County. In 2021 the EIA reports the highest monthly average output in June at 4.0 MW, and the lowest monthly average output in December at 0.7 MW.
- Fig. 5: This chart displays the monthly average generation output of the 12 largest solar facilities in Minnesota, expressed a percentage of the nameplate capacity. All the facilities had the highest output in 2021 in June, ranging from 28.6% to 41.1%. Similarly, all the facilities had the lowest output in 2021 in December, ranging from 5.8% to 6.9% of nameplate capacity.
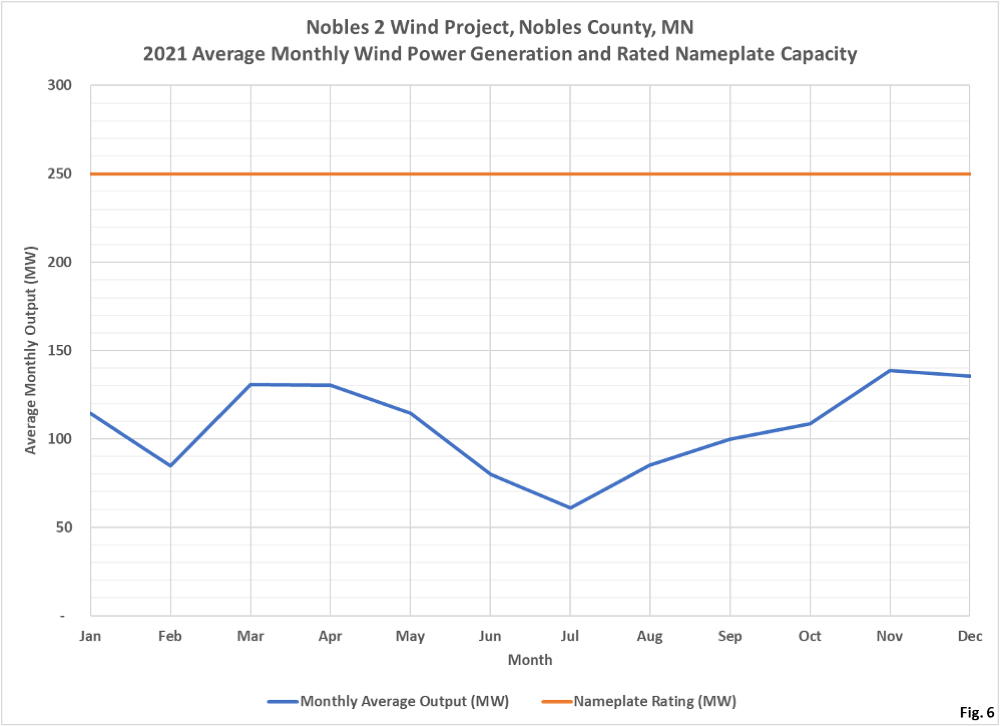
- Fig. 6: The largest wind farm currently in Minnesota is the Noble 2 Wind Project, in Nobles County. A typical news article announcing its completion is here: https://energycentral.com/
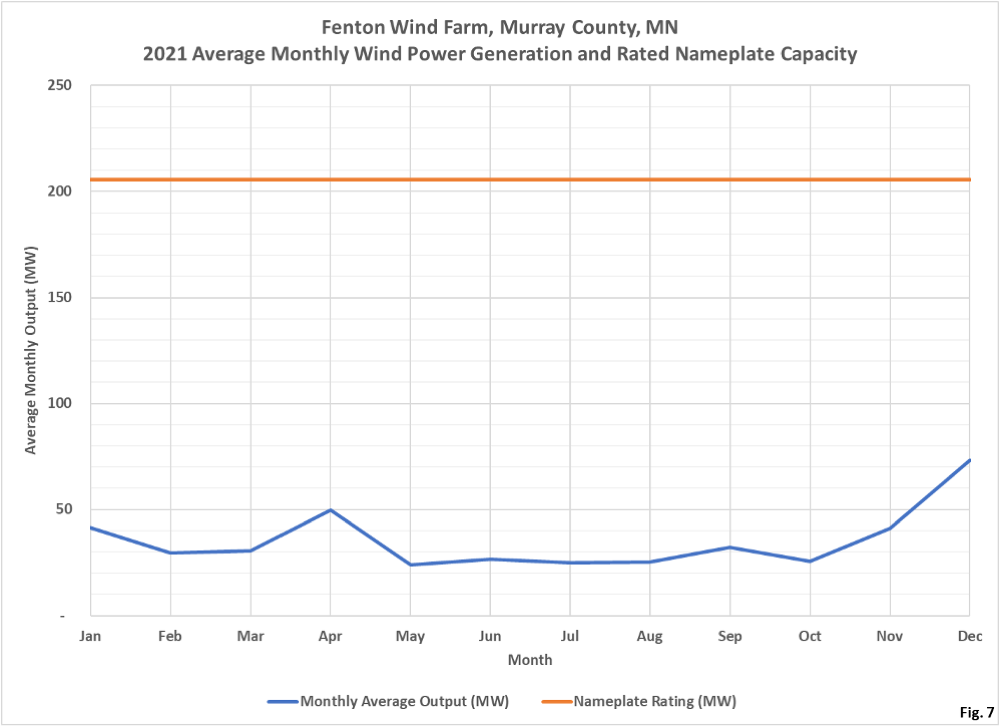
news/nobles-2-wind-farm- southwest-minnesota-begins- commercial-operation. It appears this project entered commercial operation in December 2020, just before our chart starts in January 2021. The highest average monthly output in 2021 was in November at 138.6 MW, and the lowest in July at 60.9 MW. - Fig. 7: The Fenton Wind Farm is a 205.5 MW facility in Murray County Minnesota. This facility was dedicated on a windy day in 2007: https://www.dglobe.com/news/
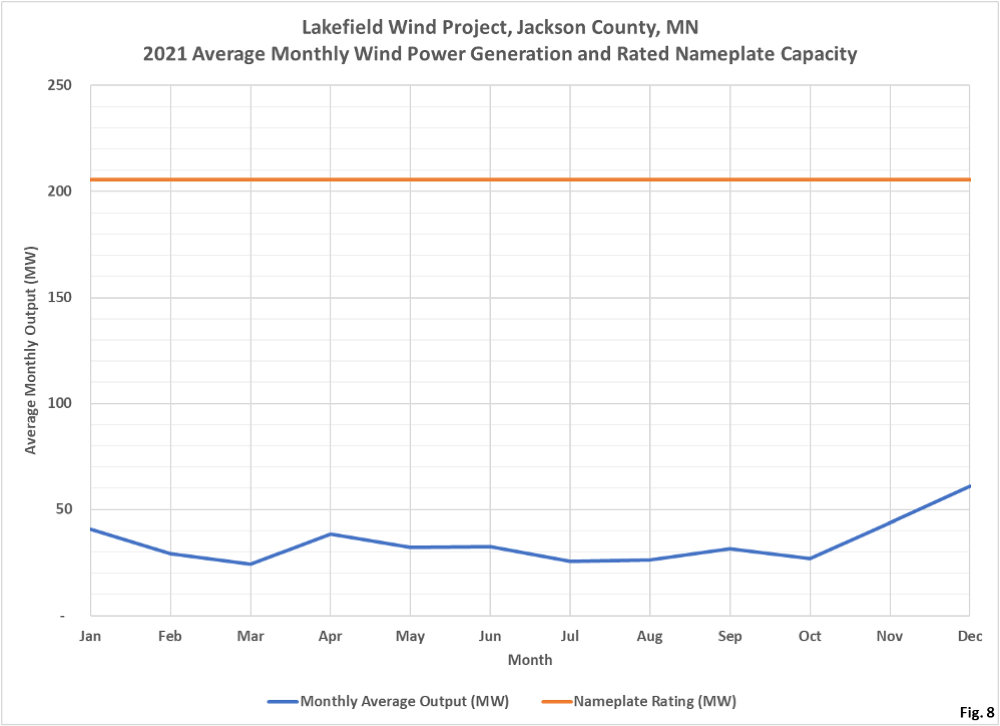
fenton-wind-farm-dedicated. Note that the press release states that the facility will generate up to 205 MW. This is undoubtedly true, but again on a monthly average basis the reality is quite different. The highest average monthly output in 2021 was in December at 73.1 MW, and the lowest in May at 23.8 MW. - Fig. 8: The Lakefield Wind Project is a 205.5 MW wind farm in Jackson County Minnesota. This project start operation in 2011: https://www.edf-re.com/press-
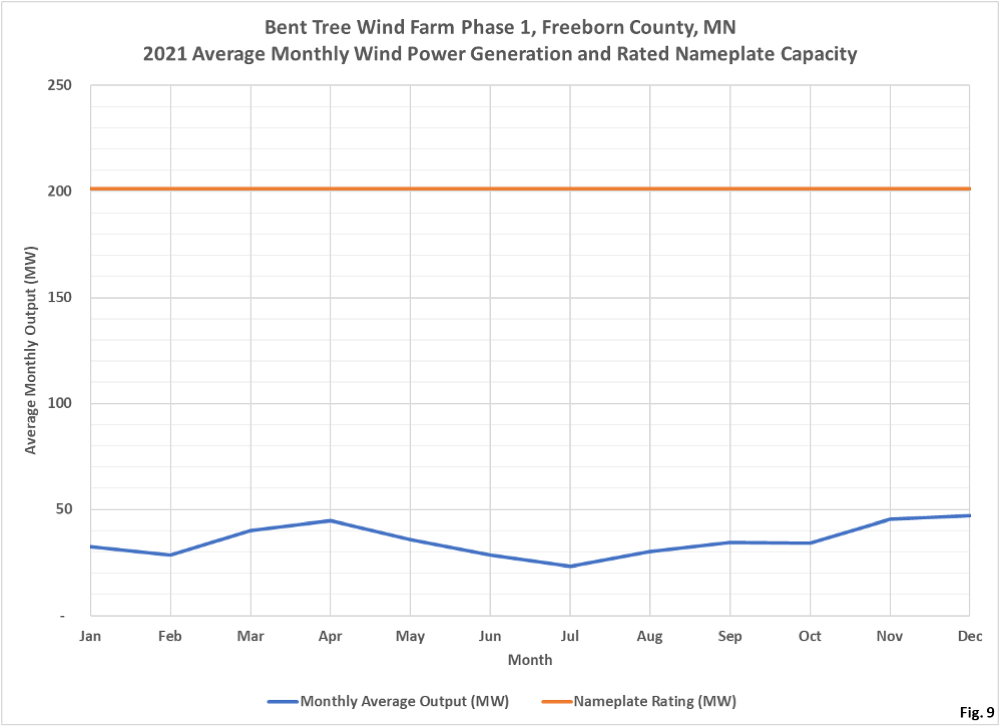
release/enxco-announces- operation-205-5-megawatt- lakefield-wind-project/. As we have seen for the other wind farms, actual output on an average monthly basis is far lower than the nameplate capacity. The higher average monthly output in 2021 was December at 60.9 MW and the lowest in March at 24.1 MW. - Fig. 9: The Bent Tree Wind Farm Phase 1 in Freeborn County Minnesota is a 201.3 MW facility that began operation in 2011: https://www.alliantenergy.com/
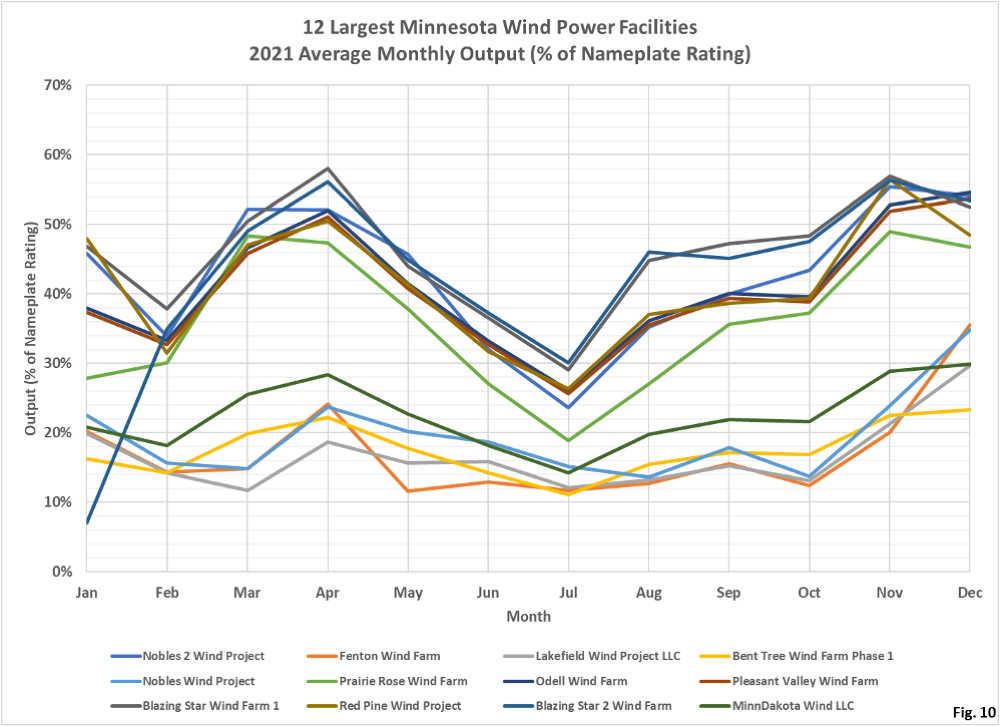
cleanenergy/ourenergyvision/ windgeneration/ iowawindexpansion/ benttreewindfarm. The highest average monthly output in 2021 was in December at 47.0 MW and the lowest average monthly output was in July at 23.2 MW. - Fig. 10: As in Fig. 5 for solar facilities, here we display the average monthly output of the 12 largest Minnesota wind farms as a percentage of the nameplate capacity. There is quite a lot more variability in monthly wind production compared to the solar outputs in Fig. 5. The lowest wind generation tends to be in July, with higher outputs in the spring in March and April, as well as higher outputs in November and December. The range of outputs are 7.0% for the Blazing Star 2 Wind Farm in January 2021 to 58.1% for the Blazing Star 1 Wind Farm in April 2021.

Kevin’s comment in last paragraph – “We would need about three times the stated output of all these installations to even get close to meeting demand, and we would need massive battery plants, which are environmental nightmares. The land needed for these projects would be enormous. ”
FWIW, the estimated land footprint for battery storage to cover the ERCOT/Texas grid for 7 days (which was the time the wind didnt blow during the texas freeze in 2021 is approximately 150-200 square miles. This is based on the land used for the de cordova 260MWhr battery storage located in granbury texas.
You’d think there would be some young aspiring reporter out there who would recognize this story as a career opportunity. There must be a few who haven’t been fully indoctrinated yet.
Holman Jenkins on The Wall Street Journal editorial page has written about that fallacies of renewable energy and the spurious “climate emergency” for years. HIs colleagues in the newsroom, however, haven’t bothered. It is indeed strange, though the narrative current against which one must swim on this topic is fierce with a deadly undertow.
Facts simply don’t matter. The people who believe in green energy are in a cult and their minds simply won’t be changed, damn the facts. They are the definition of religious zealots, with their gods being wind and solar energy and purging the planet of anyone who’d use fossil fuels (other than themselves). Unfortunately, this has been taught in our public schools for a very long time. The green agenda has been taught at least going back to my days in school (I’m 43 now) and has been only being taught from a more militant standpoint in more recent years.
I’m not sure what the long-term solution is to reverse this trend. The one thing that’ll help now is when Republicans take over both houses of the state legislature and we have a Governor Jensen, they need to have the most productive two years (hopefully more) in history. Items on the list are true school choice where parents can take the same $ that currently go to public schools and use it to send their kids to private schools of their choice (I know there will be some unforeseen items from this, but it’s far better than what we have right now), greatly reforming state agencies and firing 2/3 of the current employees, etc. Obviously we need to get rid of things like Walz’s California car emissions rule, but even more importantly we need to make sure that it can never be reimplemented. The Dems will obviously retake power at some point in the future, but we need to make sure that the infrastructure of everything they’re using to implement their agenda now is gone forever.
Great post DuluthGuy!
I’ve worked in this field for more than 30 years and, in fact, have spent the past decade financing wind and solar plants. One other gross omission by advocates of renewable energy is the failure to account for the spinning gas reserves necessary for economically dispatchable energy (i.e., to be able to keep power flowing when the sun isn’t shining and/or the wind not blowing.)
Looking at that final graph of the 12 Largest Wind Power Facilities, imagine a very generous case in which all of them matched the performance of the top two, bottoming out at 30% of nameplate capacity in the doldrums of July. This would mean that for every 100 MW of installed wind power capacity, AT LEAST 70MW of marginal gas turbine generation capacity would be required to be built in order to have 100 MW of dispatchable capacity at all times. (100 MW of wind at minimum 30% availability during July would yield 30 MW of wind power, necessitating 70 MW of gas gen capacity.)
The math is inescapable on this. Solar is even worse because of its much lower average and minimum capacity factors. Looking at the 5% minimum capacity of Minnesota solar plants in December, for every 100 MW of solar generation capacity you’d need 95 MW of standby gas generation to get 100 MW of dispatchable power. And it has to be gas. Coal and nuclear plants can’t be turned up and down with sufficient response time to provide on-demand power the way gas plants can.
The Californians have mandated extremely expensive battery arrays to try to mimic these spinning gas reserves. It’s incredibly uneconomic and technologically awkward. CA lately has suffered from fires at these battery arrays. A lithium ion battery fire is an environmental mess and public health threat. The Texans learned the hard way a couple winters ago what happens when sufficient incentives to build and maintain marginal gas-fired power plants don’t exist. When the wind turbines froze that winter, the spinning reserves weren’t there.
Bill – To add to your last point on the Texas feb 2021 freeze. Only a few of the windmills froze during the Feb 2021 freeze, the 70%-90% drop in electric generation for the 9 day period was due to lack of wind. The entire north american continent suffered from lack of wind for those critical 4 days. (Feb 14 – Feb 17th)
The EIA website provides a tremendous volume of good accurate information regarding energy use throughout the US. A review of the real time data from “electric generation by Source” would dispel many of the renewable energy myths which dominate the believes of the renewable energy advocates.