Only really interesting thing this week is the continued worse performance of being boosted compared to just being vaxed. That is likely an age effect, as the elderly are the most boosted group. But overall, vax protection continues to not be great.
Dave’s notes:
- This post is an update to the breakthrough data table and charts published on 8/23/22 here: https://healthy-skeptic.com/2022/08/23/breakthrough-events-august-18/. This week’s update adds data for the week ending 7/31/2022, newly published by the Minnesota Department of Health (MDH) on 8/25/2022. In addition, there are relatively minor updates to prior weeks as well.
- The breakthrough data files are available here, https://www.health.state.mn.us/diseases/coronavirus/stats/vbt.html , in the notes under the graphic images.
- The charts in Fig. 2 through 10 contain 3 charts for each type of event (cases, admissions, or deaths). The first chart for each type is the number of events each week, illustrating in raw numbers the trend during the pandemic for the overall population, and the impact on society of each sub-group. The second chart is the rate of events per 100k each week, displaying the risk to an individual of the each category at different times during the pandemic. The third chart for each type of event is the proportions of event compared to the proportion of the population type (unvaccinated, vaccinated, or boosted). This chart helps show whether or not vaccination or boosting is effective in reducing the impact of the pandemic, by comparing the proportion of events to the proportion of the population.
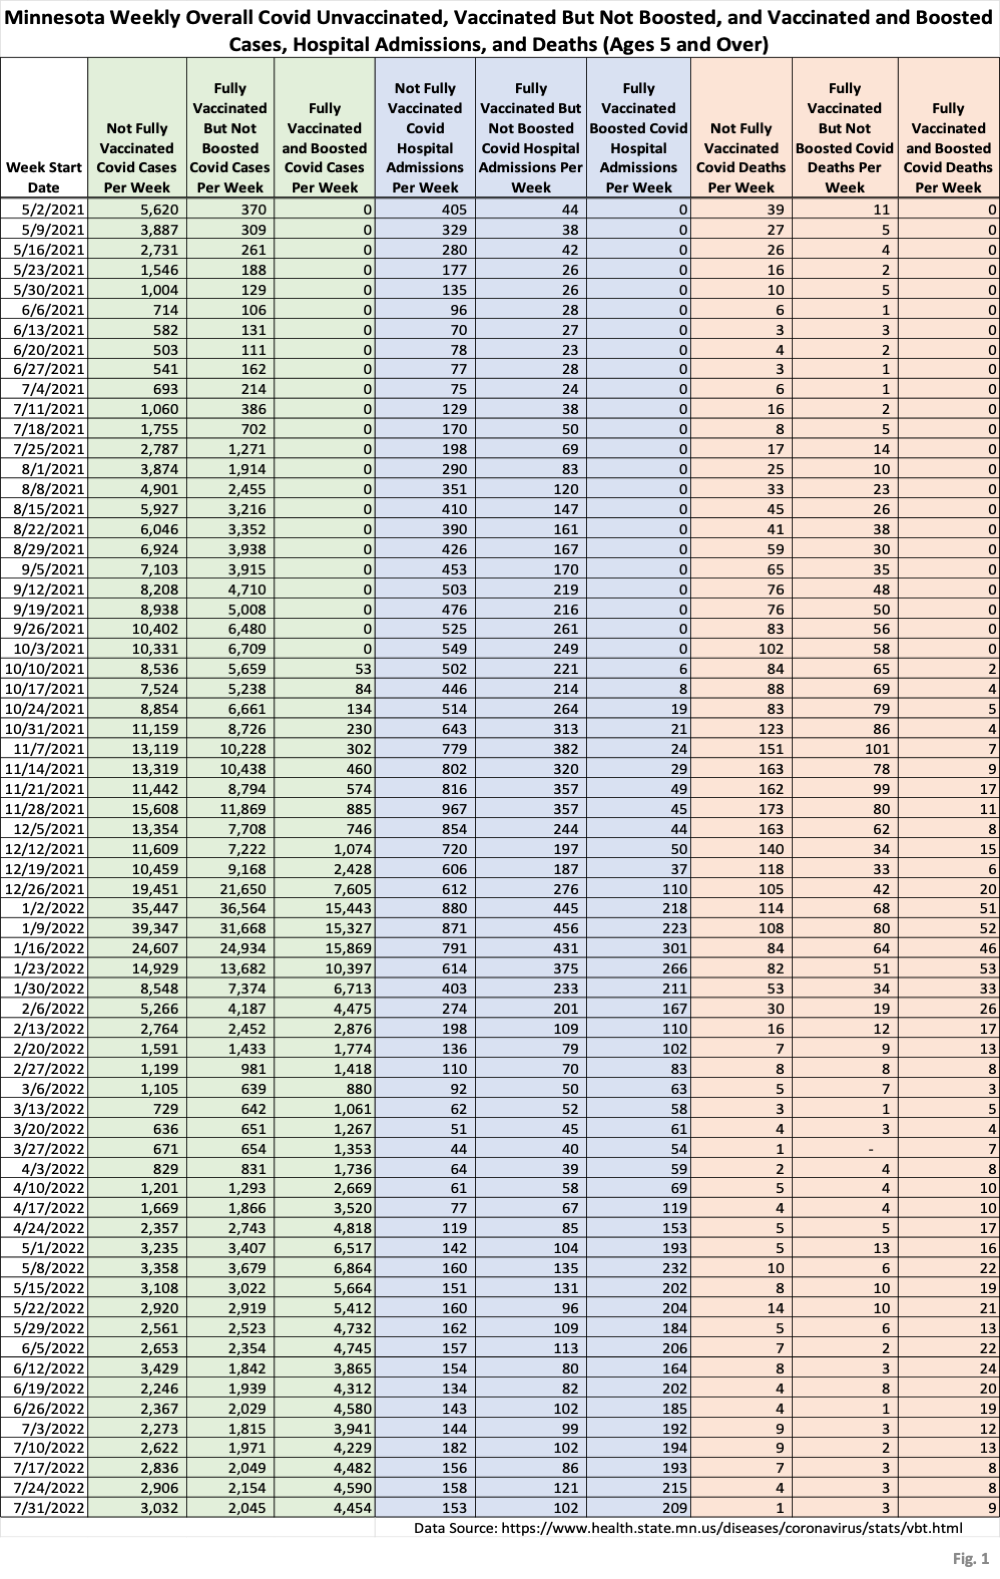
- Fig. 1: This table displays the total cases, hospital admissions, and deaths that occurred each week among the unvaccinated, vaccinated but not boosted, and vaccinated and boosted populations. The week of 7/31/2022 has been added this week. In looking at the prior weeks, there were very few changes to the data. The few revisions that were made tended to be in the 65+ age group. There were just enough cases, hospitalizations, and deaths added to indicate that MDH is looking at past data. Hopefully the small number of changes indicates that the data, such as it is, is relatively complete.
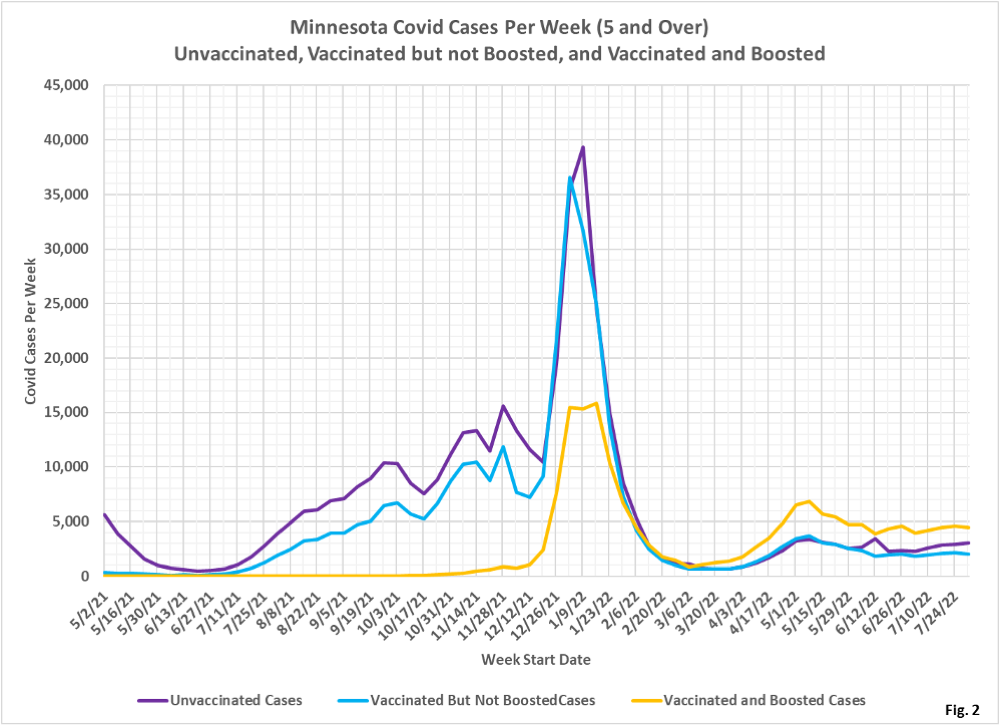
- Fig. 2: This chart simply plots the cases among the unvaccinated, vaccinated but not boosted, and vaccinated and boosted populations each week, as found in Fig. 1. The numbers of cases have been quite stable for several weeks now. Is this what the endemic phase of Covid looks like? Given the availability of testing, and the general emphasis on Covid awareness, perhaps this is exactly what our future will look like.
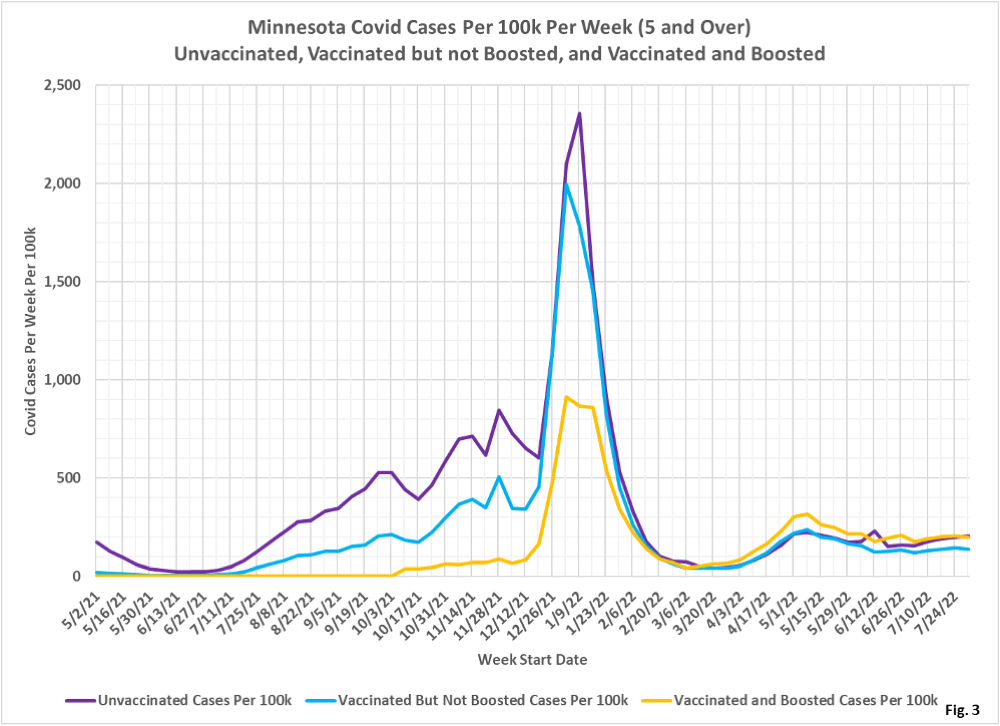
- Fig. 3: This chart displays the case rates per 100k for each group. The gap between case rates for the boosted and the unvaccinated has narrowed greatly the last several weeks. The vaccinated but not boosted continue to have the lowest rate of testing positive. Note that this data does not include home Covid tests, which may skew the relative rates among the vaccination categories.
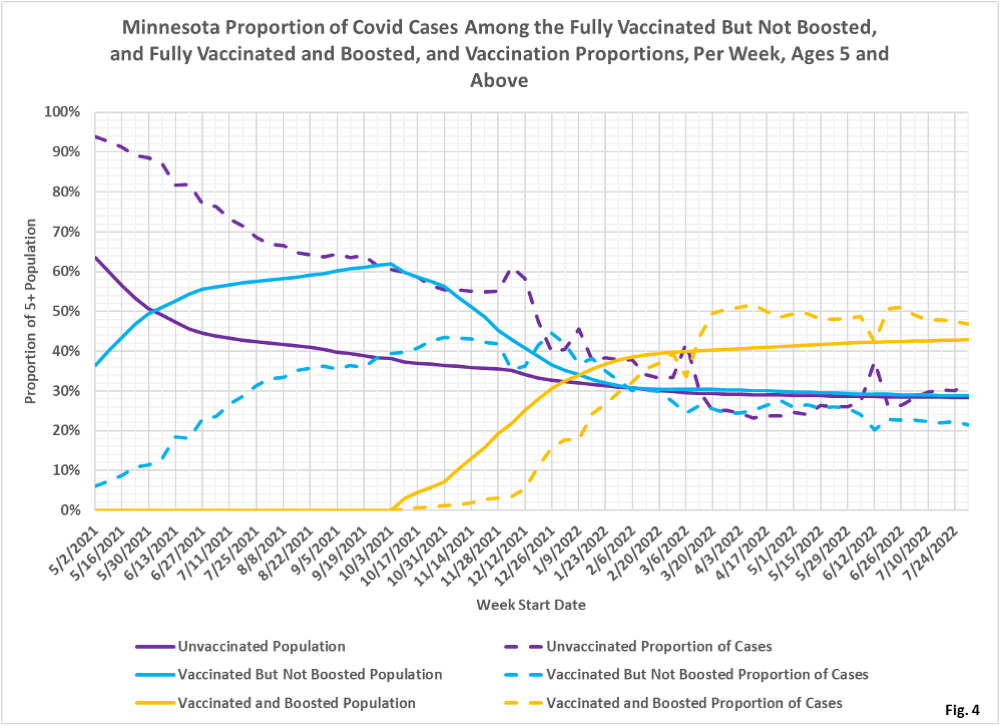
- Fig. 4: This chart displays the proportion of the 5 and over population who are unvaccinated (solid purple), vaccinated but not boosted (solid blue), and vaccinated and boosted (solid gold). For each population group we also display the proportion of cases each week (dashed lines of same color). The way to interpret this chart is to compare the proportion of breakthroughs to the proportion of vaccinations for each group. Whenever the dashed breakthrough proportion line is below the solid vaccination line of the same color, then that category is underrepresented for population, and when the dashed line is above the solid line of the same color then that category is overrepresented. For the week of 7/31/22 the vaccinated and boosted made up 43% of the overall 5+ population but accounted for 47% of the overall cases. The proportion of boosted cases (gold dashed curve) have been over-represented since 3/13/2022, compared to the proportion of boosted population (solid gold curve).
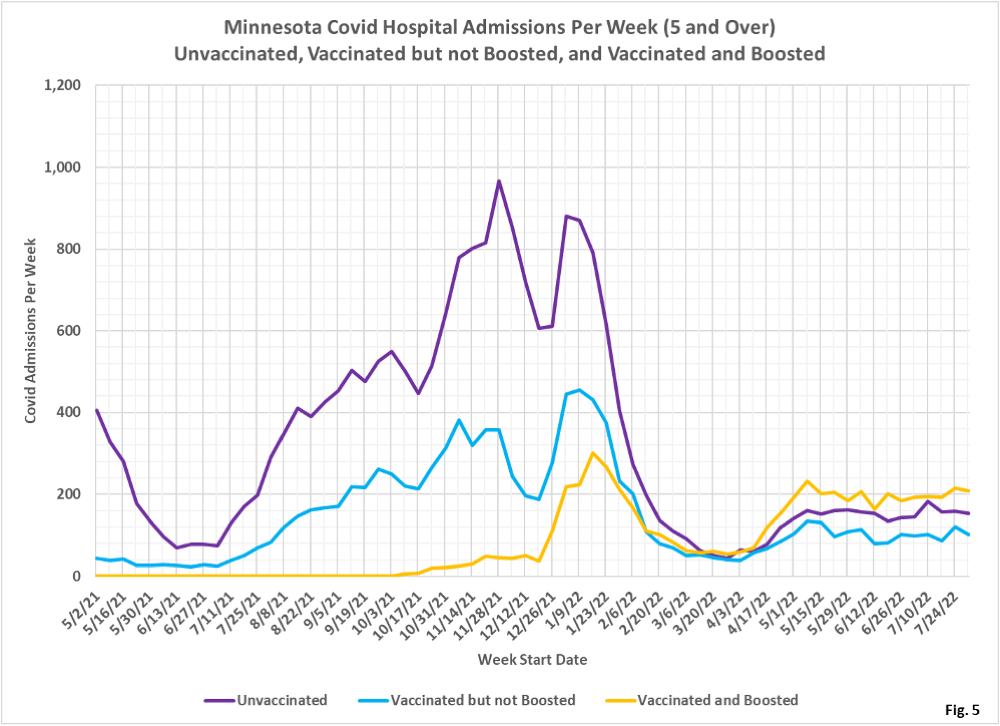
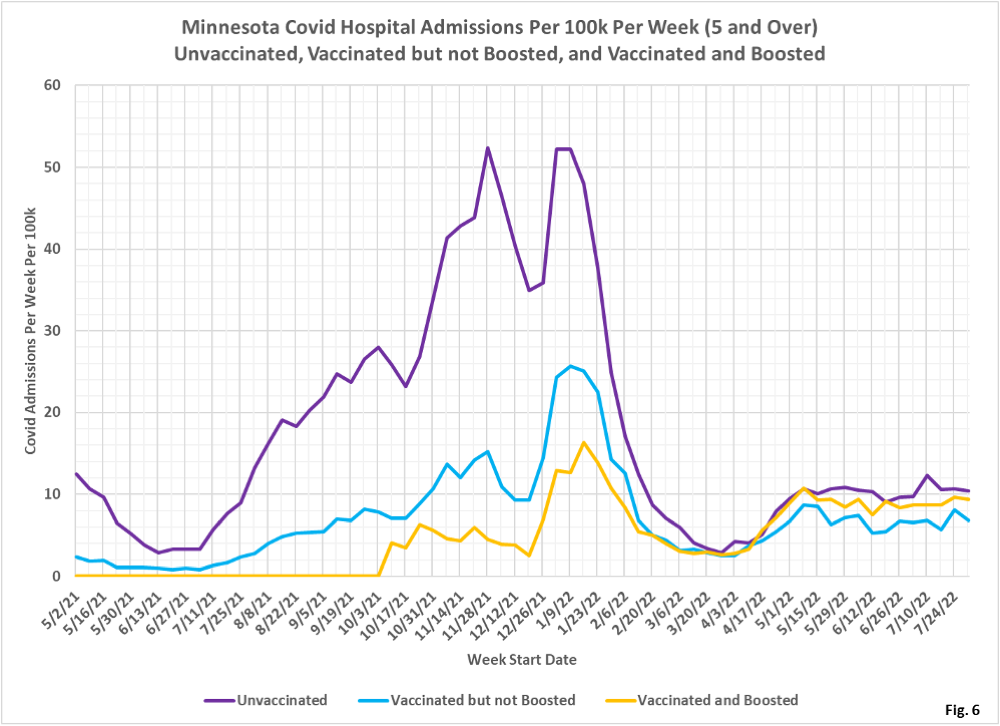
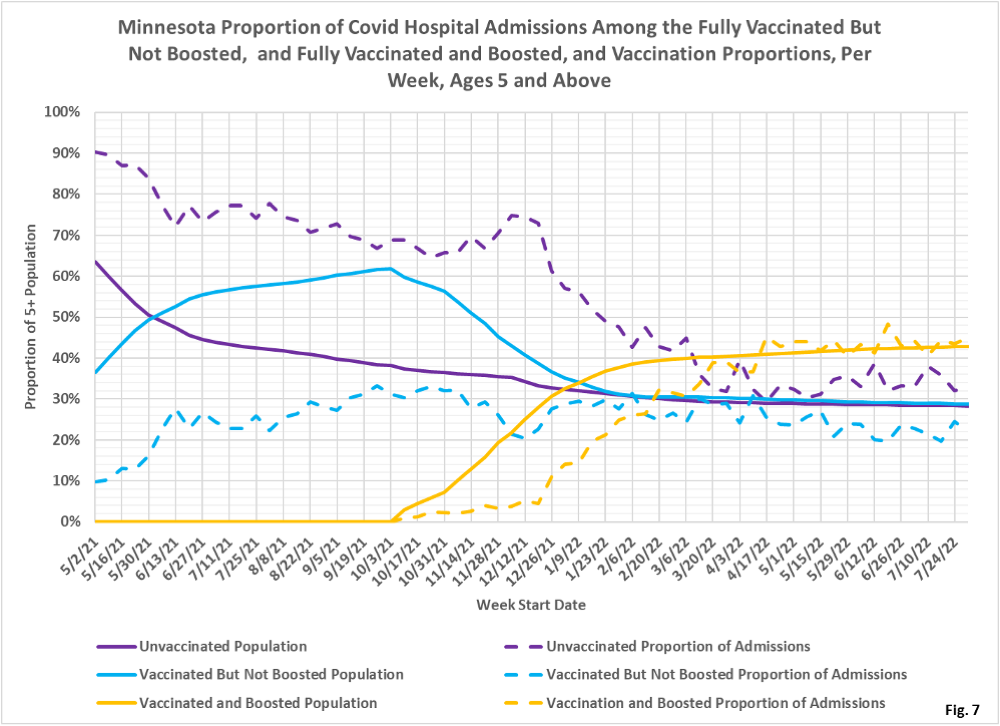
- Fig. 5-7: These charts display the hospital admissions, hospital admission rates per 100k, and hospital admissions proportions for the 5+ age group, in an identical format to the case charts in Fig. 2 through Fig. 4. Fig. 5 shows that the boosted as a group have the largest number of hospital admissions, with admissions for the vaccinated but not boosted dropping down after a large increase last week. Fig. 6 shows that the unvaccinated had the highest rate of hospital admission for the week of 7/31/22 (although very close to the hospitalization rate of the boosted), while the vaccinated but not boosted had the lowest rate of admission. Fig. 7 shows that the vaccinated but not boosted are indeed under-represented (blue dashed curve lower than solid blue curve), while the unvaccinated are over-represented (dashed purple line higher than solid purple line).
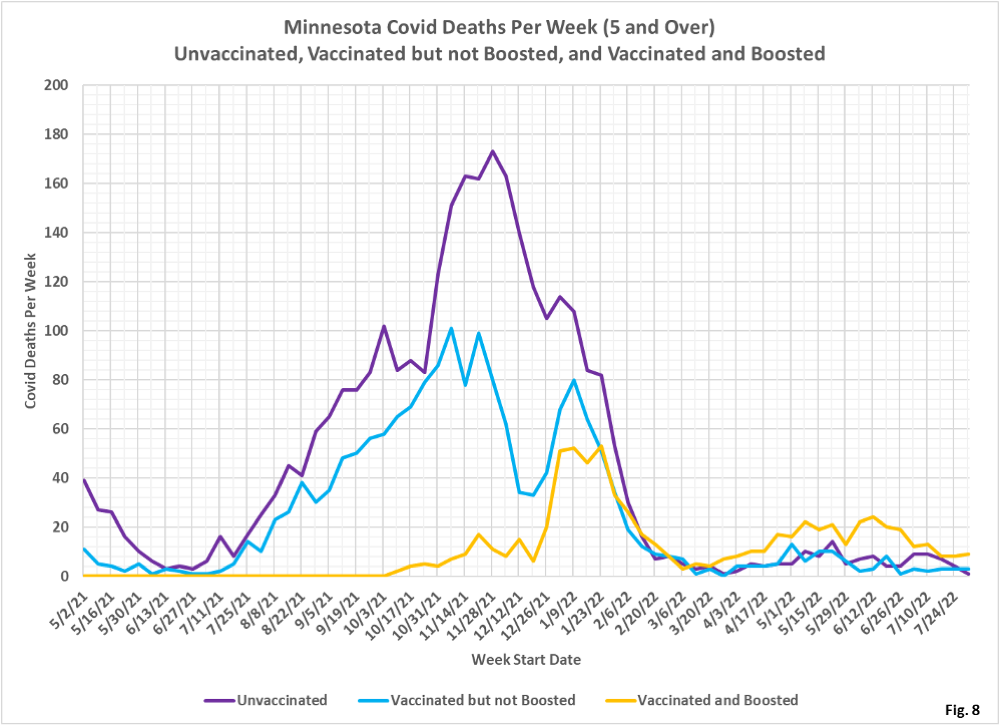
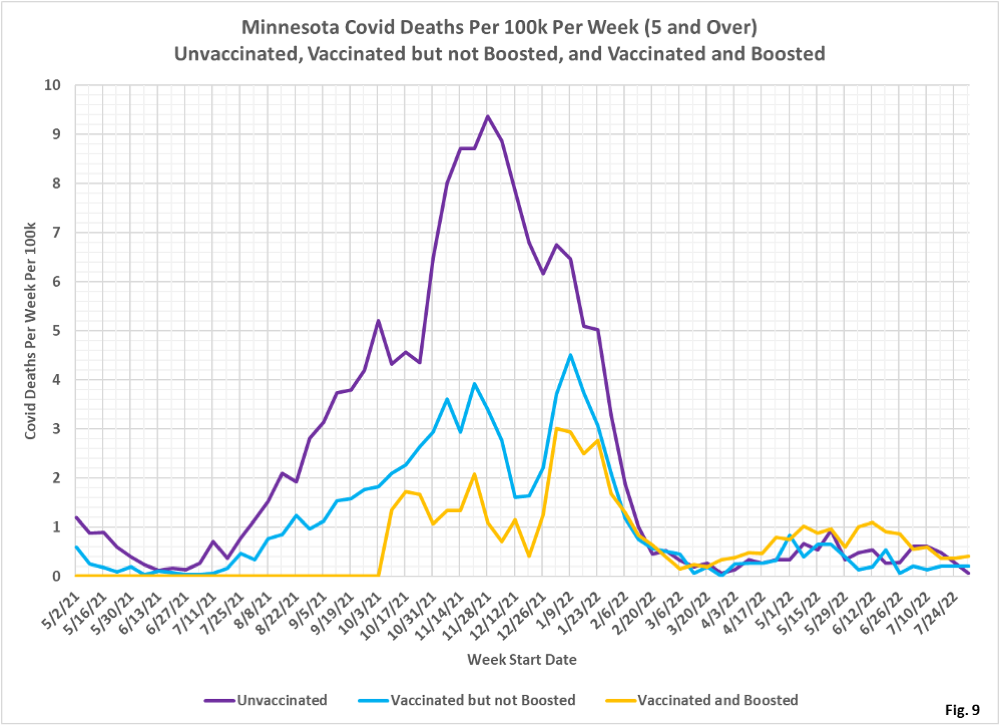
- Fig. 8-10: These charts display the deaths, death rates per 100k, and death proportions for the 5+ age group, in an identical format to the case charts in Fig. 2 through Fig. 4. Deaths among the boosted have levelled off for the week of 7/31/22, while deaths among the unvaccinated have declined sharply (Fig. 8). The death rates per 100k are all very low, with the death rate for the unvaccinated declining sharply (Fig. 9). For the week of 7/31/2022, the boosted make up 43% of the overall population but account for 69% of the weekly deaths, while the unvaccinated make up 29% of the population but account for only 8% of the deaths (Fig. 10). The breakthrough data is updated retroactively, so it is likely that these rates will change over time.
- MDH defines the fully vaccinated (what we have termed vaccinated but not boosted) as those who have not received a booster after completing their primary vaccination series, and had been vaccinated at least 14 days prior to testing positive.
- MDH defines the boosted as those who have received any additional vaccination shots after completing their primary vaccination series, and also received the booster at least 14 days prior to testing positive. In addition, booster doses were only counted after 8/13/2021, the date the CDC first began recommending booster shots.

It looks like we’re not seeing the rise in cases that last year’s trends show at this time … surely hope the ‘Q’ is tight and centered over Dec/Jan this season. That would confirm the endemic nature and more of a flu-like standard risk profile.
Also, wish you would be more neutral on your perspective regarding what the mRNA products have done to the country’s overall health. This article seems to tell the story pretty well. It’s just common sense that you can’t inject over half the population with an experimental product and not see health trends reflect it. Considering the background of the product, it’s development at BioNTech (Germany) (marketing, manufacturing and sale through Pfizer) and Germany’s extraordinary funding of the WHO ahead of this event, everything should be questioned with an open mind.
Why are we still living under an ‘Emergency’ status? To pay off college loans via the HEROES Act? Maybe the Whitehouse can see the future …
https://theethicalskeptic.com/2022/08/20/houston-we-have-a-problem-part-1-of-3/
Neutral has nothing to do with it, look at the evidence–there is absolutely none on significant numbers of deaths from the vax, none whatsoever. Where there is evidence–heart inflammation in young men in particular, I have highlighted it repeatedly
Vax protection is basically null at this point. The data and studies are showing us that there is an initial Antibody increase that offers some protection. However, it is non specific and basically any vaccination would give us the same protection.
I am not sure why you are not recognizing how much these have failed at this point nor trying to defend them as having a safe profile.
You claim the deaths we are seeing an increase from is coming from missed care. While there is no doubt there is some of that, almost all of the deaths below 50 years of age cannot be attributed to this.
I am sure you are aware of the data and research that shows very limited to no efficacy of saving a life from annual screenings and physicals.
However, because you have some stick up your rear about Berenson you are claiming the 340,000 some excess deaths in the below 40 group is coming from delayed care?
You have to be absolutely FN kidding me.
https://www.ncbi.nlm.nih.gov/pmc/articles/PMC8371936/
You are clearly not reading the posts if you haven’t paid attention to the constant charts and research summaries on vax effectiveness, in Minn. and elsewhere. And neither you nor anyone else can apparently actually do an excess deaths analysis correctly. That number you site is completely made up. there is none, nada, nil, zero, zilch actual evidence that the vax are related to any significant number of deaths. And you all just never acknowledge that in part because of limited effectiveness against infection, the overlap in the vaxed and the infected in huge–something like 80%. If there were these issues with deaths, and there aren’t, why would it be the vax and not the infection. I am tired of this bullshit
I guess we’ll just have to agree to disagree about what constitutes ‘evidence’, its sources and its validity. I’ve been attaching the sources to what’s ‘out there’, from a growing number of blogs that support concerns. You just keep saying that there’s no ‘evidence’. Considering the current status of the regulatory agencies responsible for this mess, I think we can agree that what they are feeding into the information systems is worthless, or at best extremely biased, regarding accurate data to support any position. From my perspective it’s criminal since the entirety of any [vaccine] program is legally based on ‘informed’ consent. When the FDA & CDC are proven to be fraudulent, informed consent can’t exist. Therefore the program should be shut down. Unfortunately, this runs so deep that it can’t be done without loosing the entirety of these organizations, medical and pharmaceutical systems to the currently complicit judiciary system.
I’m afraid that you have to maintain your perspective for fear of having the site targeted if you start down the ‘vaccine’ injury’ path yourself. It’s understandable, the yeoman’s work to guide your followers through this jungle is appreciated and admired ! We all appreciate the fortitude … Thank you.
This is very comprehensive, far too much information to be ‘made up’. The razor thin line between ‘defense’ and ‘offense’ with these technologies was abused and here we are. Outsourcing this technology all over the world, funded by governments, is a model for disaster.
https://iceni.substack.com/p/mechanisms-of-covid-19-vaccine-injury
https://iceni.substack.com/p/modernas-mrna-mystery
All made-up bullshit, All of it, every bit. Here is what the anti-vax diehards have for a theme song–Barry White singing Never, Never Gonna Give You Up. you’re my everything is their motto. They don’t care about data, facts, analysis, logic. None of that matters. All that matters is their precious conspiracy theories. Pathetic, really, and you deserve to do better by yourselves than sink into this stupid morass of lunacy.