As Dave indicates below, there are serious data issues with this analysis, but it is an important one. The comparative rates of hospitalization or death among persons who have been reinfected or vaxed can tell us a lot about the relative immune protection afforded by each event. Unfortunately, DOH refuses to give information on the overlap–persons who are both vaxed and have a prior infection. DOH has this data, and not giving it ironically likely hurts their pro-vax messaging. In any event, Dave Dixon did his usual sterling job on the data we did receive to produce the table below.
The primary data flaws include failure to identify the overlap, which as Dave states means there is double-counting in all likelihood. But there are also are other issues, such as in recent months with the rise of home testing, how many cases have their really been and does home testing differentially affect case counts for reinfections versus breakthroughs. We also know the majority of hospitalizations now are incidental, but does that affect reinfections versus breakthroughs differently. So read the table below with skepticism that it reflects reality. Since detected cases are likely only one-fifth to one-tenth of all cases at this point, the rates of events are greatly reduced in reality.
But the overall message is that at this point, there isn’t a whole lot of difference in event rates.
 Dave’s notes:
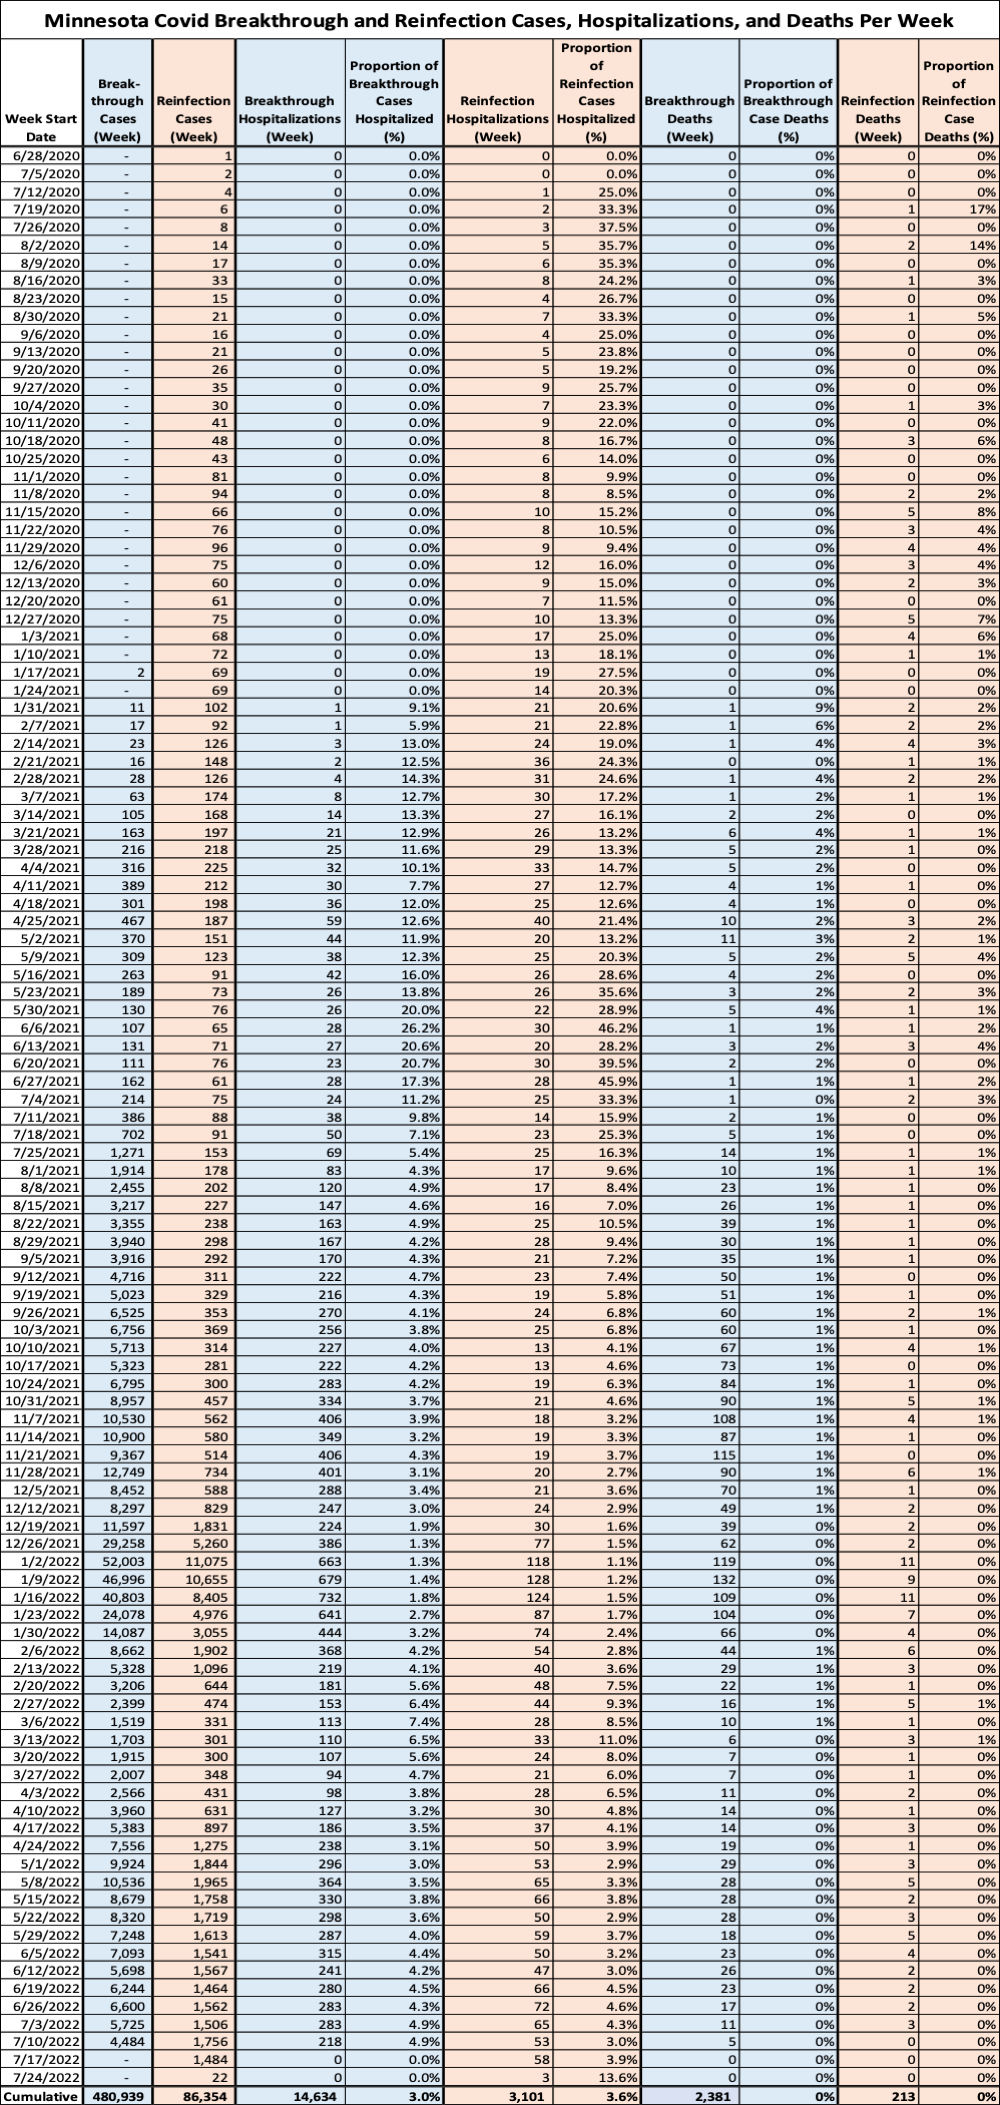
- This table displays the number of breakthrough and reinfection cases each week, and the number of those cases who were hospitalized or died. Note that the data we have from the Minnesota Department of Health (MDH) does not give us the overlap between those people who are vaccinated and also have a reinfection. These cases which meet both the breakthrough and reinfection criteria are counted in both categories, which means some unknown number of cases, hospitalizations, and deaths are double counted in this table. We have submitted multiple Minnesota Government Data Practice Act requests throughout the pandemic in an effort to get more detailed data to allow us to distinguish these types of cases.
- The breakthrough cases in this table may be either vaccinated or boosted. We have filed a Data Practices Act request in order to get additional data on vaccination status.
- The data displayed in this table was obtained through Data Practices Act requests, with data received on 7/28/2022. The data files we received for breakthrough and reinfection cases contains the date of each case, a Yes/No flag for whether that case was hospitalized or died, and the age of the individual. MDH stopped publishing reinfection data on their Situation Update web page, https://www.health.state.mn.
us/diseases/coronavirus/stats/ index.html , on 6/20/2022, making these Data Practices Act requests more important than ever. - Reinfection cases were more likely than breakthrough cases to be hospitalized (3.6% vs. 3.0%), but reinfection cases were less likely to die than breakthrough cases (0.2% vs. 0.5%). We’re not sure why reinfection cases were more likely to be hospitalized but breakthrough cases were more likely to die. It is possible that the age distribution of vaccination accounts for part of this, since older people are more likely to be vaccinated and are also more likely to die while being reported with a Covid infection. It is also possible that incidental Covid cases being detected in people hospitalized for non-Covid reasons is inflating the reinfection hospitalization rate.
