Despite the ravings of environmental whackos, there is no way renewable sources are going to reliably and inexpensively meet the energy needs of US consumers. And those renewable sources have their own environmental headaches, some really bad, like massive slaughter of birds by wind turbines and the hazardous waste produced by solar. And there is no way to create enough power storage capacity to cover for the wildly variable output of most renewable energy sources. These charts by Dave Dixon demonstrate that in the Midwest, including Minnesota, it would be lunacy to take traditional power-producing sources, like natural gas, coal and nuclear offline. But that is exactly what we are doing. Makes China and Russia really happy.
 Dave’s notes:
- The U.S. Energy Information Administration (EIA) publishes a wide variety of energy information. We were interested in the sources of electricity generation, and how they change on a daily or weekly basis. The EIA publishes data and charts for the Midwest Region here: https://www.eia.gov/electricity/gridmonitor/dashboard/electric_overview/regional/REG-MIDW . Note that the Midwest Region covers an area of the US from Louisiana to Michigan to North Dakota. This region is operated by the Midcontinent Independent System Operator, Inc. (MISO), and has a real time dashboard available here: https://www.misoenergy.org/markets-and-operations/real-time–market-data/operations-displays/ .
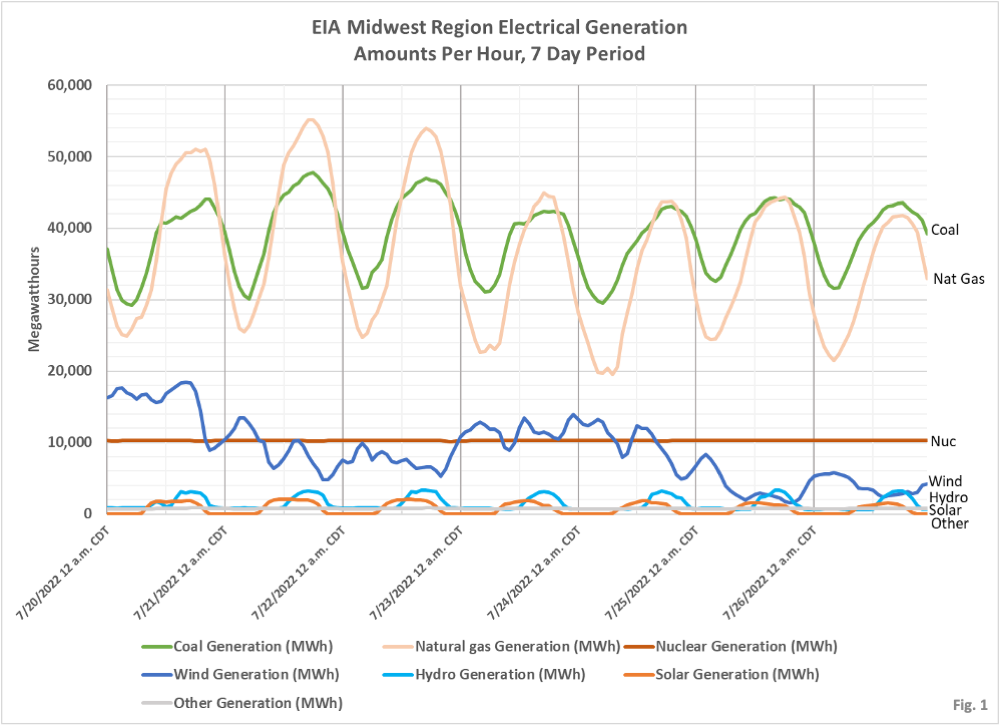
- One of the charts the EIA publishes on the page referenced above is “Midwest (MIDW) region electricity generation by energy source”. By clicking on the gear symbol on this chart we are able to select up to a 31 day time period, and then to download the data as a csv file. The data for the charts presented here was obtained in this manner. The charts match those published by the EIA, except that we have modified the colors used for clarity. The amounts data in Fig. 1 and Fig. 3 are directly from the EIA without modification. We are calculating the proportions in Fig. 2 and Fig. 4 from the amounts data.
- Fig. 1 shows the amounts of electricity generated by source each hour over a 7 day period. Note that coal and natural gas generation is highly cyclical, in order to match the daily demand cycle. Nuclear is almost perfectly constant, which must represent an optimum operating level for the reactors. Nuclear power plants are capable of ramping up and down, but since they generate a relatively small proportion of the total load it makes sense to run them at a constant output. Wind power has no apparent daily pattern, while solar and hydro do have daily cycles. Hydro power plants must be modulated to generate power during the higher demand periods of the day.
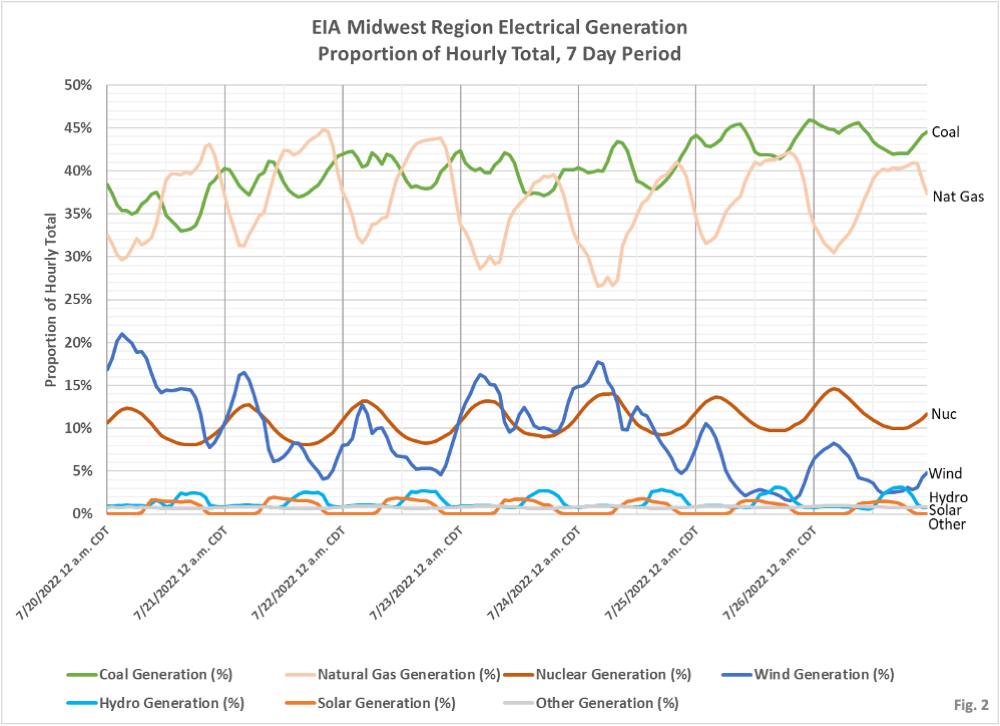
- Fig. 2 shows the amounts of electricity generated by each source each hour as a proportion of the hourly total over a 7 day period. In this chart it is more clear that natural gas is ramped down as wind power increases, and vice versa, while coal operates with relatively less variability in the hourly proportion.
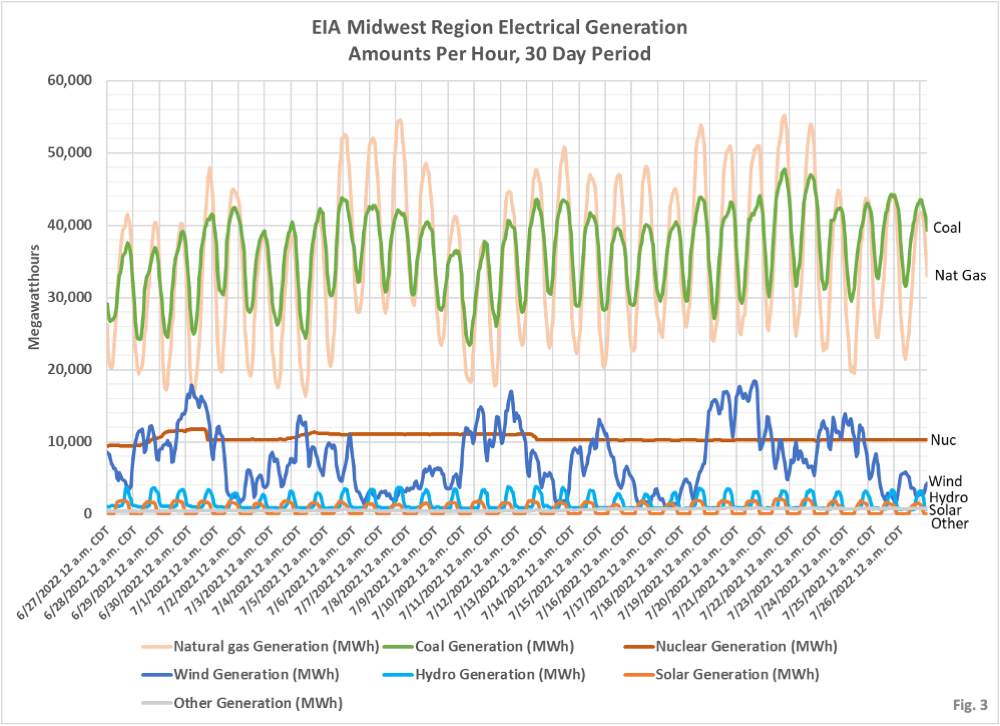
- Fig. 3 shows the same hourly generation data as Fig. 1, but over a 30 day period. Wind generation is highly variable as expected, and in this chart we can see that coal is also ramped up and down to compensate when wind generation is low over longer periods.
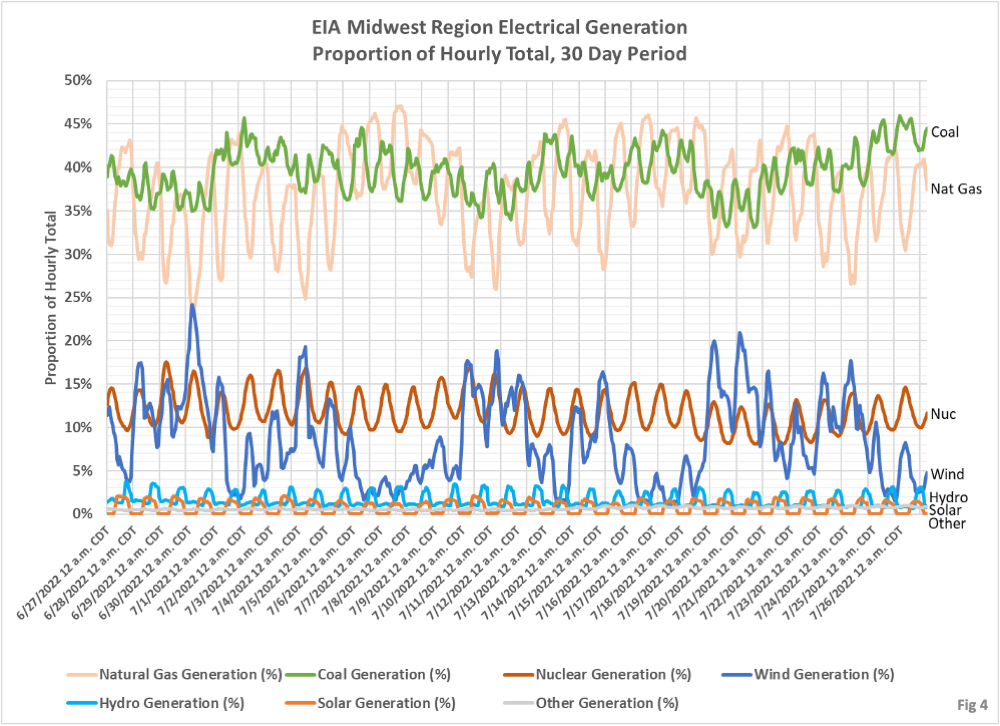
- Fig. 4 shows the same hourly proportion data as Fig. 3, but over a 30 day period. It is noteworthy that wind power generation peaked at 24% on 6/30/2022, but that wind power generation also had several days-long periods at less than 10%, and at times dropped to nearly 0%. Since battery storage that is cost effective and sustainable is not currently available in scale, power generation has to meet instantaneous electrical demand. Since it is not politically viable to build coal power plants then the main backup for wind power going forward has to be natural gas power plants. If we want electricity on demand natural gas power plants must be built to back up 100% of wind power capacity.

Great work Dave! Not to mention that the grid needs a constant load or it will blow transformers all over the place. Too many power fluctuations with wind and solar. The grid collapses. There aren’t enough batteries in the world to garantee a storage capacity to provide a constant load. Green energy is complete bullshit.
I highly recommend people to follow the second link you provided on Dave’s notes. I personally look at it quite often and don’t recall seeing renewables over 20% of load. Especially when demand is high.
Reunables can never be over 20% of the load. It’s impossible.
This presentation of the actual data is very clear. Thank you Dave. It’s a shame none of the lunatics that got us into this mess will ever see it, and if they do see it they won’t understand it and think it proves wind and solar work. It’s very disheartening.
I would like to see numbers on actual generation versus installed capacity for wind and solar. For every megawatt of capacity, how much power is actually generated?
As I previously stated Climate science is quite complex. Though as the climate scientists who advocate renewable energy, you have to wonder how they could possibly have the superior intellect to understand climate science, yet lack the basic math science and engineering knowledge to be so easily fooled by renewable energy.
The Renewable idiocy clowns want to completely eliminate fossil fuels and to power everything with electricity generated from renewables.
A well known principal is that you never want to put all your eggs into one basket.
In this case, green advocates want all power sources from electricity. That is a recipe for catastrophic failure. A prime example is the Texas Ercot Feb 2021 freeze and electric grid failure. Ercot lost approx 40% power generation from fossil fuels for 15-18 hours and 25-30% loss of power for another 36 hours 48-60 hours total down time.
(2.5 days )
During a 9 day period, wind lost 70-90% of power generation. That amounts to a total grid failure lasting 9 days. How are you going to heat 100% of homes with complete grid failure.
Same with the concept of Leveraged cost of Energy (LCOE) . Its true that the marginal cost of fuel for wind and solar is low, yet the greater the wind & solar penetration in the grid, the greater the Overall costs of generating electricity. It would seem that the advocates never learned the basic math concept of “proof” ( geometry term)
The EIA chart is a great source for power generation
Note In the MCO grid that Wind energy lost 60%-70%-80% of power generation in july for
3 day period,
2 day period
and a
3 day period.
8 days out of 31 day or 26% of the time
current US electric storage capacity is approx 3 minutes. good luck expanding battery storage capacity to cover those extra 12,000 minutes
I just looked at the data for Ercot (texas) – For most everyday in July, the wind peaked in the late night hours 10Pm to 5am , then had its low point typically from late morning to late evening.
Of course, who needs electricity for cooling during the hottest part of the day? (sarc on that last comment) .
The green advocacy for renewables is pure idiocy – Reminds me of a quote by an engineer – everything is easy if you dont know what you are talking about.