I know I am beating a dead horse with these reminders, but the official data is generally worthless now because (1) very few people are getting official reported tests; (2) hospitalizations attributed to CV-19 are over half incidentals and (3) deaths have always been misattributed by CDC and DOH goofy standards. Notwithstanding that it is interesting to notice similar peaks in some years just offset by a month and it is interesting to note that relatively stable background level of CV-19 now. I suspect that as long as we encourage people to test we would see this forever with slight bumps and seasonal variations, just like the other seasonal coronviruses. If the same approach were possible and used during the last coronavirus to become a constant presence, likely OC43 in the late 1890s or so, I strongly think we have have seen the exact same phenomenon, without quite as quick a global spread. A big epidemic up front, gradually receding to just a routine background respiratory virus causing frequent infections and re-infections.
 Dave’s notes:
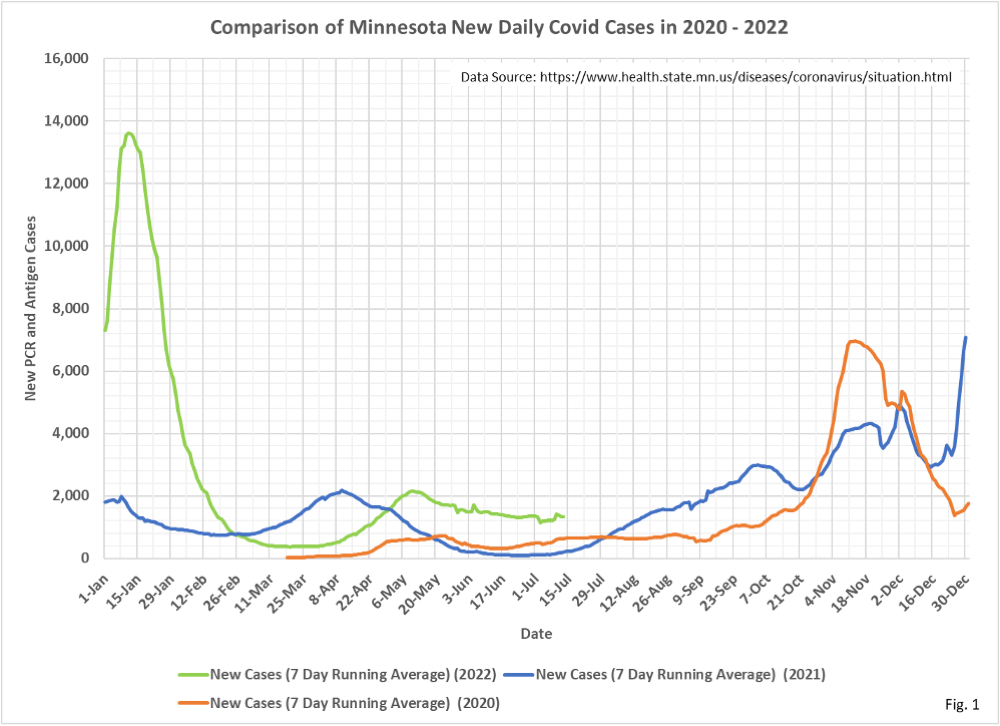
- Fig. 1: New Daily Covid Cases: The new daily cases appear to have levelled out, at a higher rate than either of the past 2 summers.
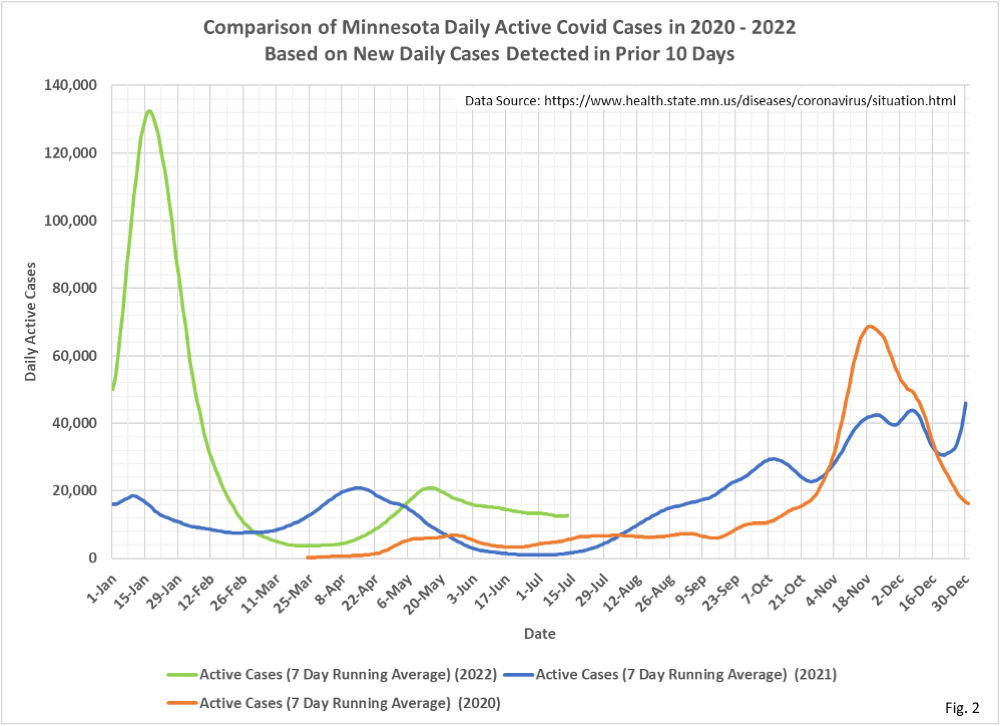
- Fig. 2: Estimated Active Covid Cases: We are simply showing the number of people who test positive in a 10 day period as an estimate for how many people may be actively infected at any one time, since the Minnesota Department of Health (MDH) stopped reporting the number of people No Longer Needing Isolation.
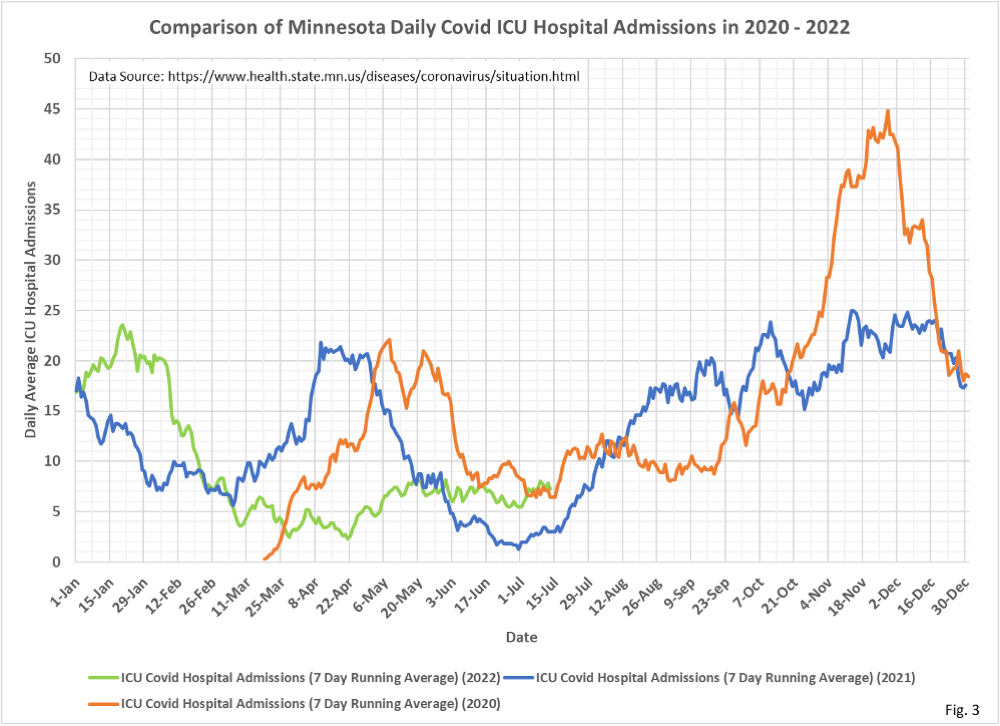
- Fig. 3: Covid ICU Admissions: Average daily Covid ICU admissions have risen back to a level equal to
- the May peak of the current wave in cases.
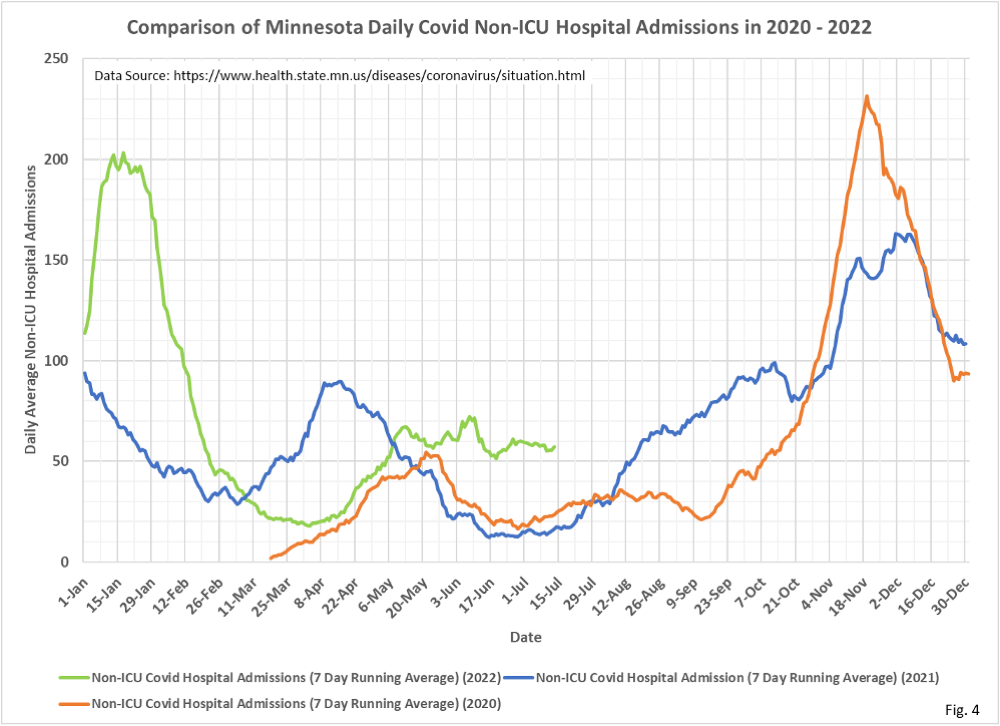
- Fig. 4: Covid Non-ICU Admissions: Average daily Covid Non-ICU admissions continue to plateau at a relatively elevated rate, compared to the admission rates the previous 2 summers at this time.
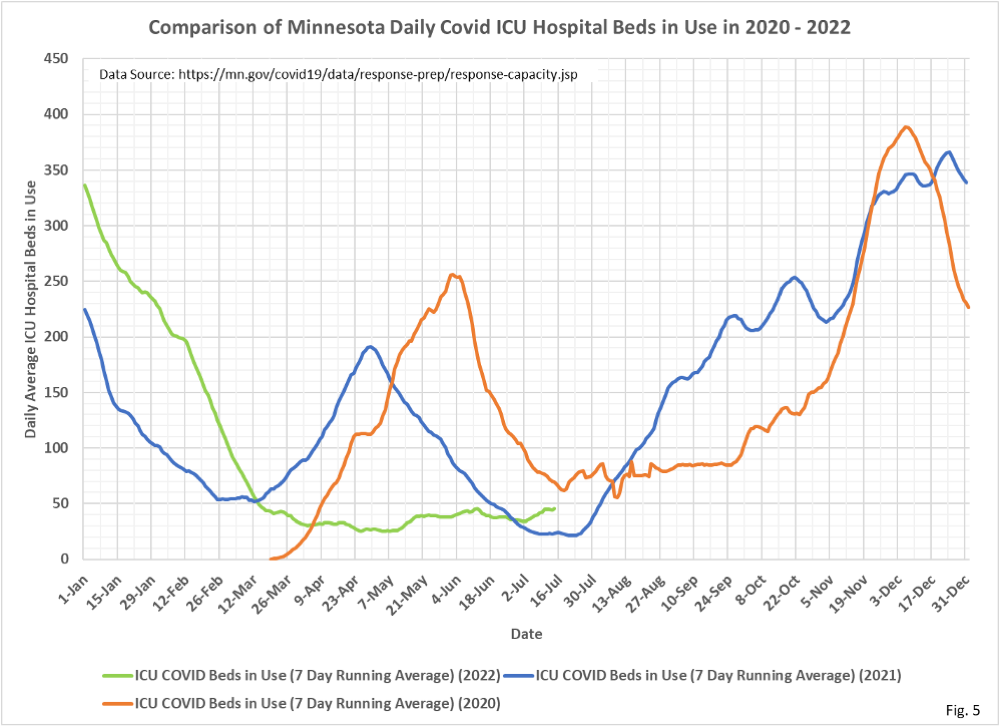
- Fig. 5: Covid ICU Beds in Use: Covid ICU beds in use have been gradually rising for the past several months.
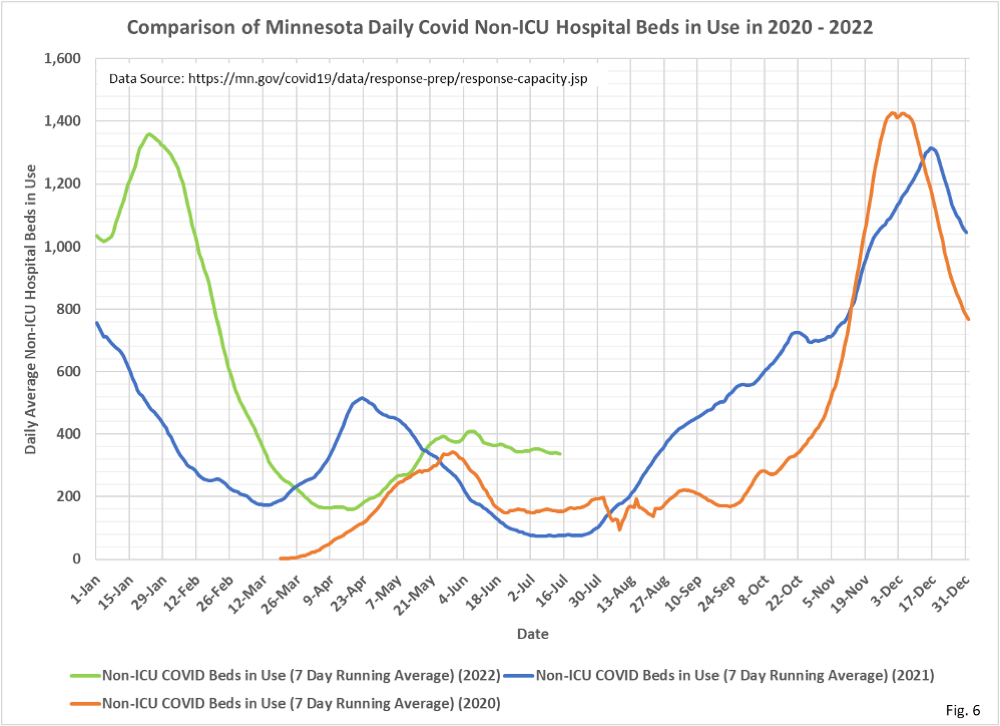
- Fig. 6: Covid Non-ICU Beds in Use: Non-ICU Covid hospital beds in use are declining ever so gradually.
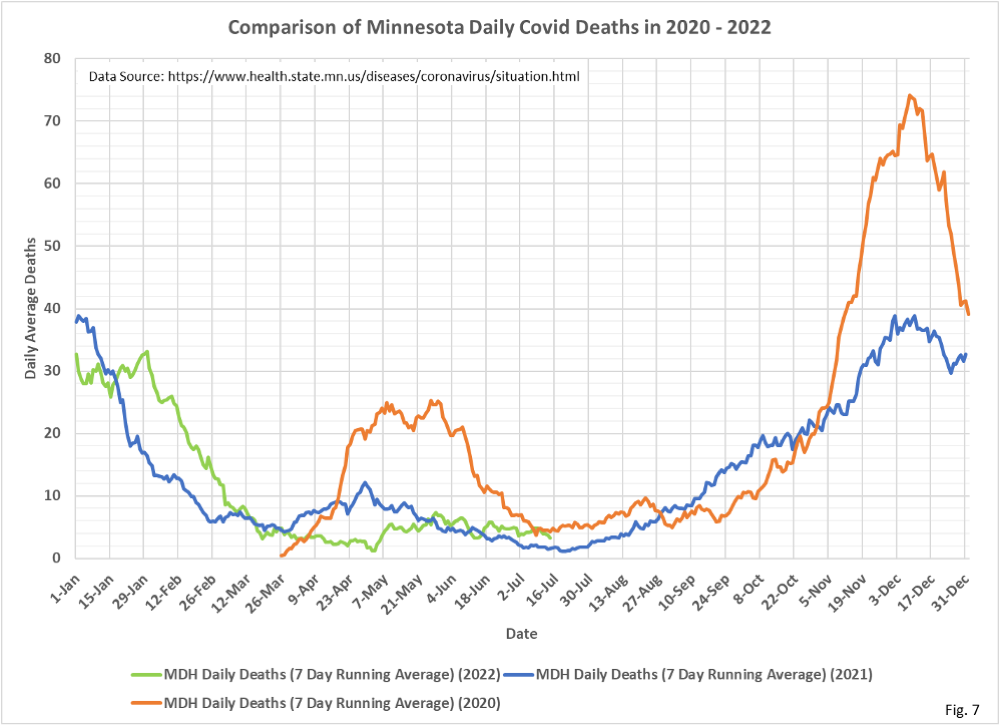
- Fig. 7: Covid Deaths: Deaths attributed to Covid are declining at a very gradual rate.
- All data is taken from the Minnesota Department of Health Situation Update for COVID-19 web page https://www.health.state.mn.
us/diseases/coronavirus/ situation.html . - All data is shown as 7 day running averages.

What is OC43?
one of the four common seasonal coronaviruses