Dave is continuing to attempt to reconstruct some of our regular charts with the new data sources. Here is the year-over-year look, which is corrupted in regard to cases by the extensive use of home testing, in regard to hospitalizations by a majority being incidental and the ongoing mis-attribution of deaths.
 Dave’s notes:
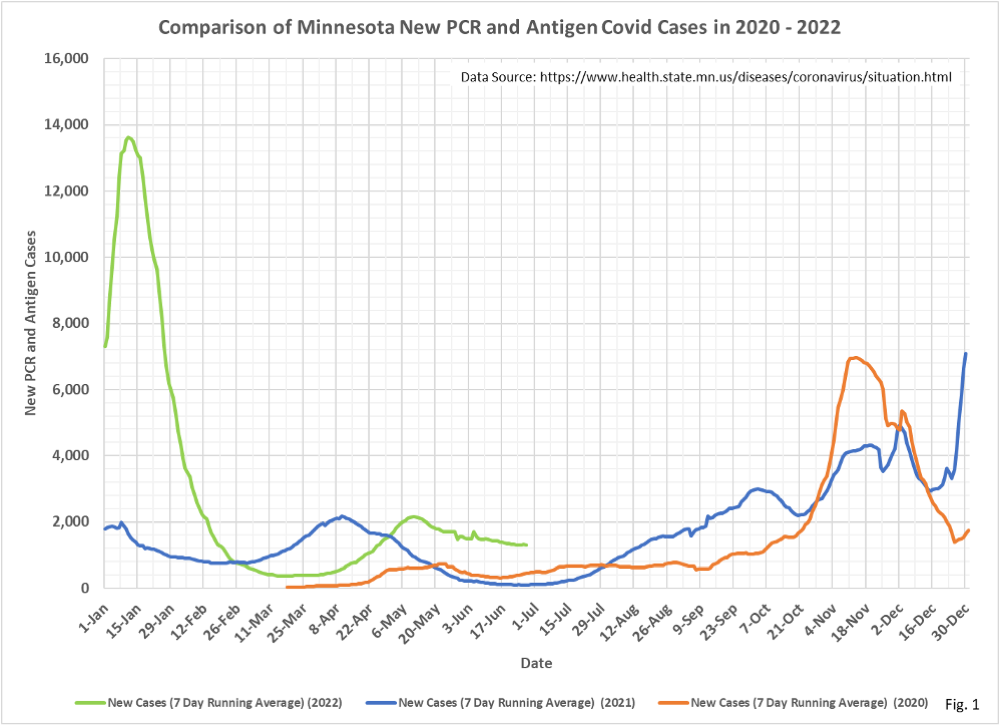
- Fig. 1: New Daily Covid Cases: The new daily cases continue their slow decline. The most recent surge stands out as being very asymmetrical. The decline in cases is much more gradual than the increase in cases was April and early May of this year. Previous surges appeared much more symmetrical. One possible explanation might that more people now are home testing, or not testing at all, and therefore not showing up in official Covid databases.
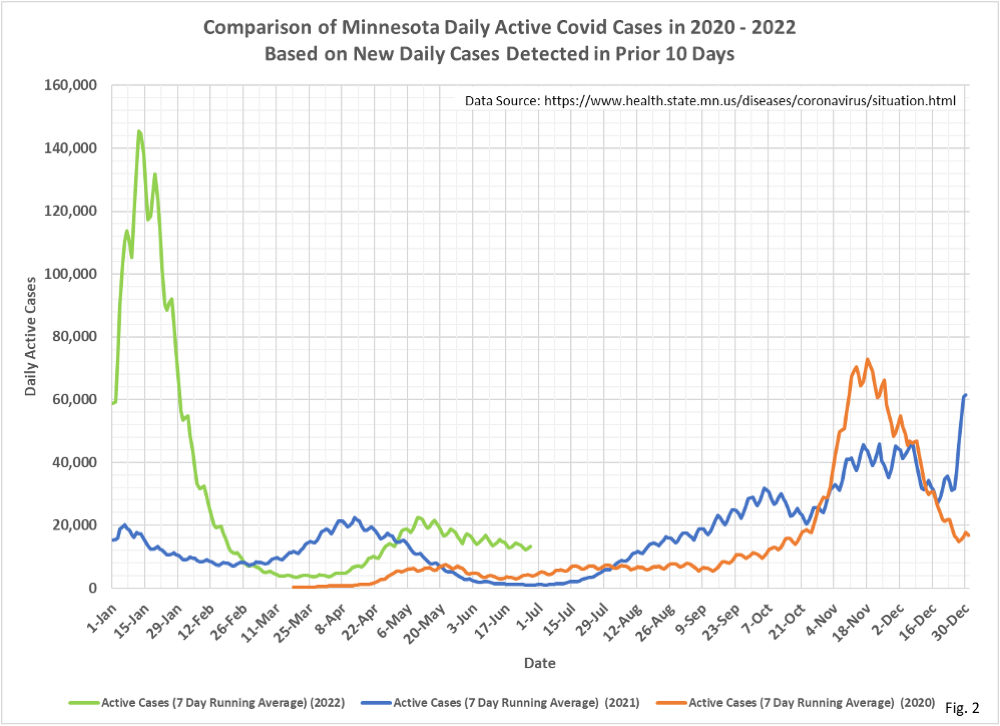
- Fig. 2: Estimated Active Covid Cases: With the change in data reporting by MDH on 6/23/2022 they discontinued the statistic of people “No Longer Needing Isolation”, We had previously used this statistic as part of our calculation for how many active cases were present in the state. We are now simply showing the number of people who test positive in a 10 day period as an estimate for how many people many be actively infected. Since we are adding up cases over successive 10 day periods we are now seeing weekly variations caused by different levels of testing that occurs on weekends. This causes the sawtooth appearance of the curve.
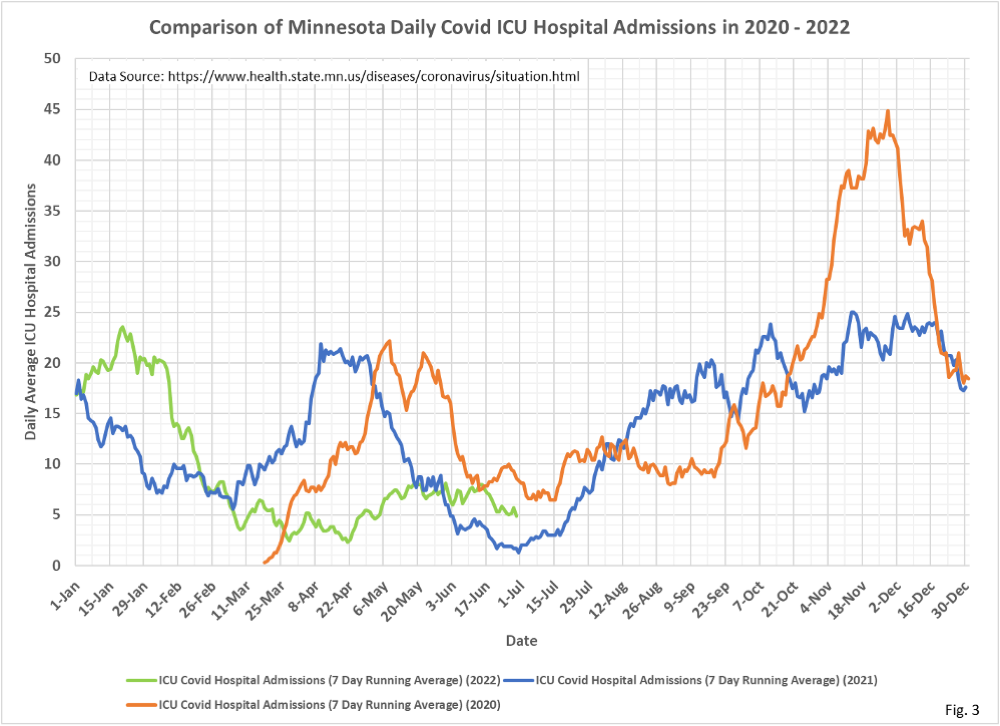
- Fig. 3: Covid ICU Admissions: Covid ICU admissions continue to decline at a gradual rate, somewhat in proportion to the decline in new daily cases.
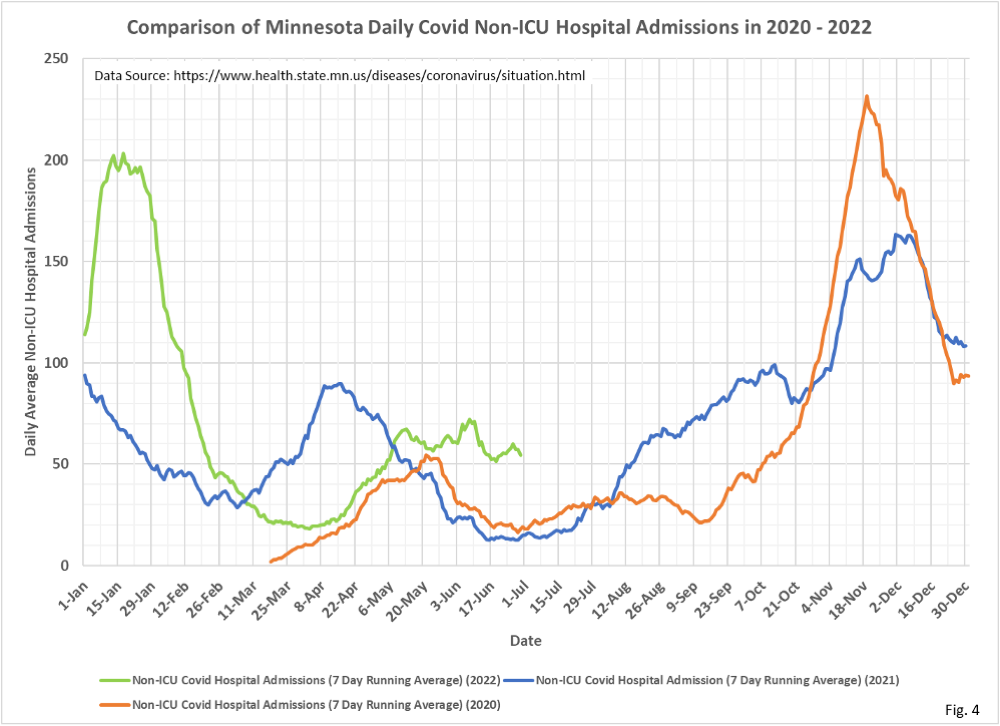
- Fig. 4: Covid Non-ICU Admissions: Covid Non-ICU admissions still appear to be holding a plateau, despite new cases waning.
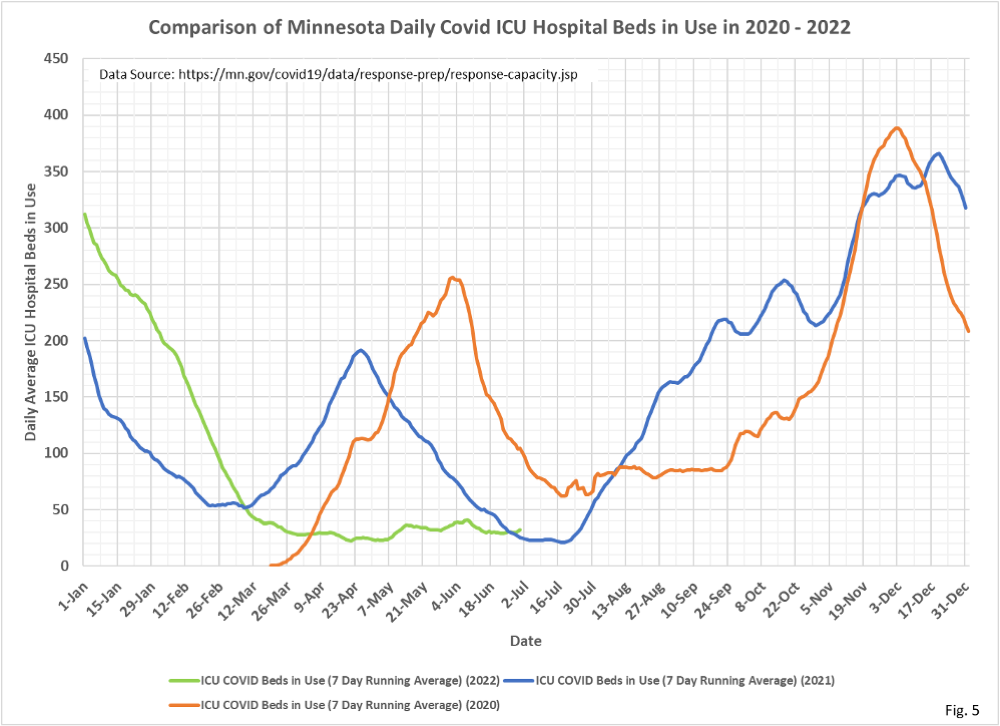
- Fig. 5: Covid ICU Beds in Use: Covid ICU beds in use have been remarkably constant over the past 3 months, generally staying in the range of 20 to 40 beds in use since the end of March. Note in Fig. 3 that Covid ICU admissions have varied from roughly 3 to 8 admissions per day over the same period.
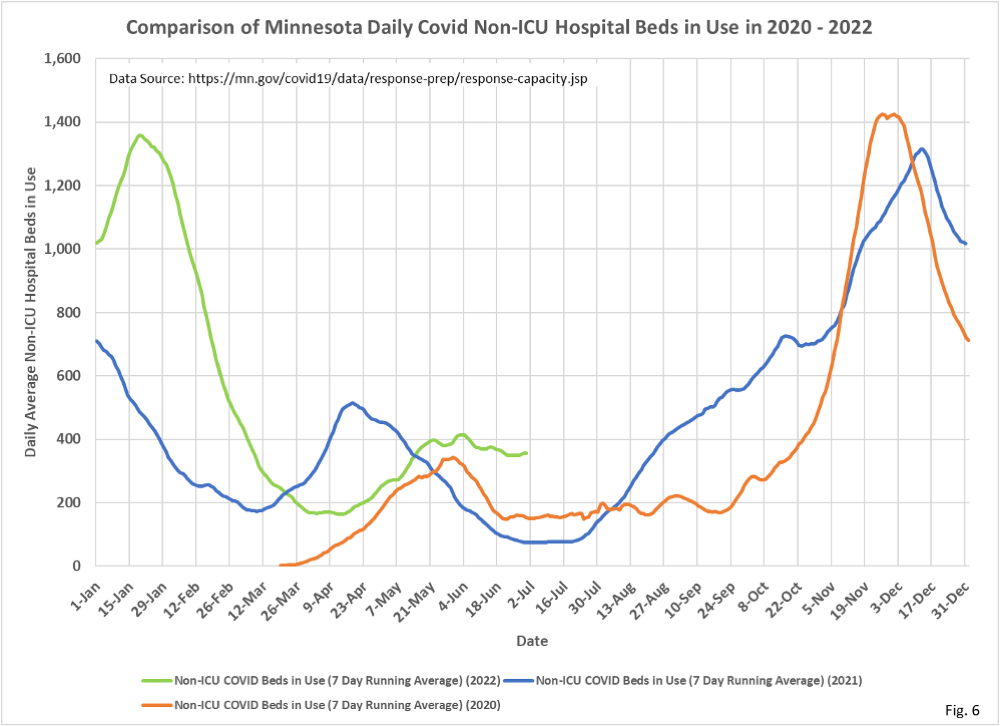
- Fig. 6: Covid Non-ICU Beds in Use: Non-ICU Covid hospital beds in use appear to be plateauing at an elevated level, similar to the plateau appearance of Non-ICU Covid admissions.
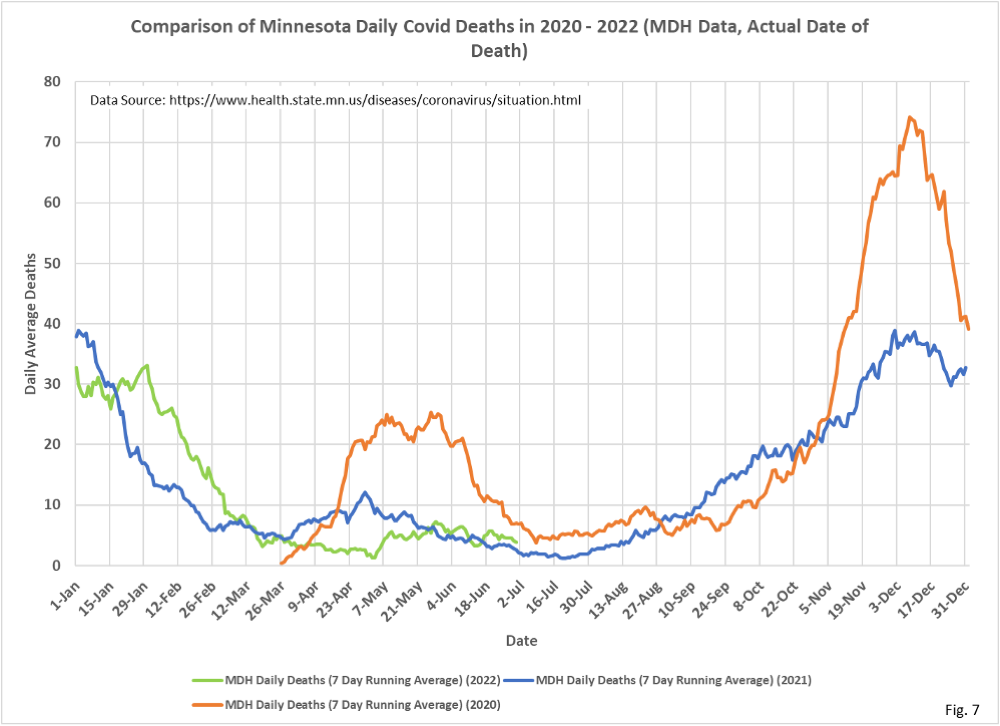
- Fig. 7: Covid Deaths: Deaths attributed to Covid are declining at a very gradual rate.
- All data is taken from the Minnesota Department of Health Situation Update for OCVID-19 web page https://www.health.state.mn.
us/diseases/coronavirus/ situation.html and from the Response and Preparation web page https://mn.gov/covid19/data/ response-prep/response- capacity.jsp. - All data is shown as 7 day running averages.
