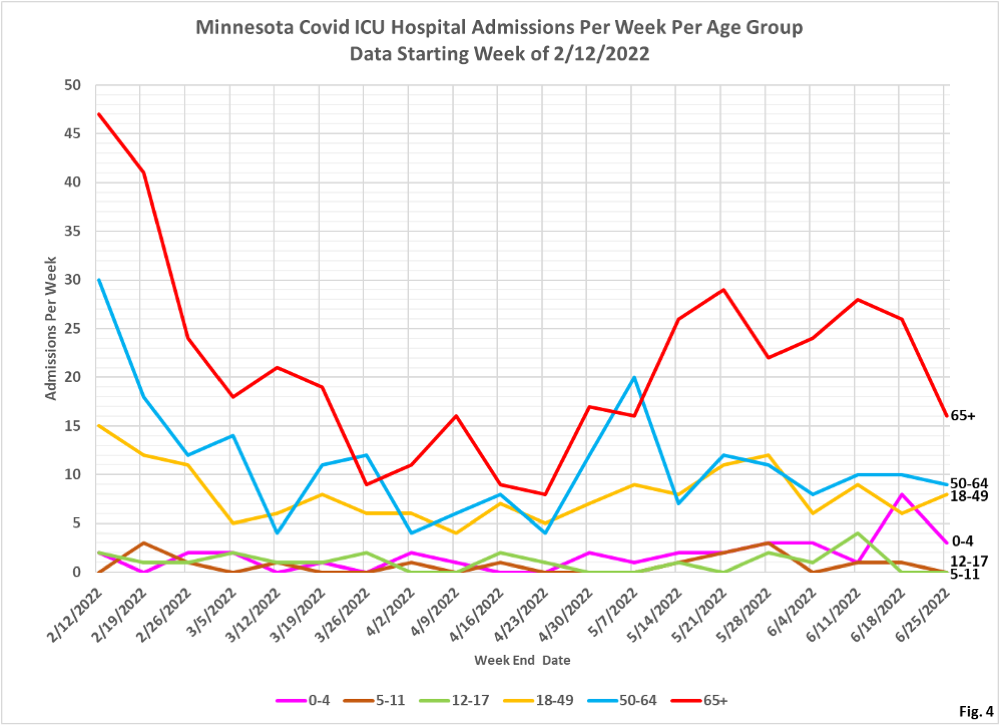
When the state shifted to weekly reporting Dave Dixon had to do extra work to keep some consistency in the charts we try to do regularly. Dave notes the increase in 0 to 4 cases and hospitalizations. I hate to suggest this but would point out that it coincides with the vaccine rollout.
 Dave’s notes:
- These age structure charts showing the number of Covid cases, ICU hospital admissions, non-ICU hospital admissions, and deaths in Minnesota are the first we have posted since the Minnesota Department of Health (MDH) revised their data reporting on 6/30/2022. On that date they went from reporting data every weekday to reporting every Thursday only. In addition, they revised what data they report. Reinfection data was discontinued, for example, as well as death data for the type of residence (long term care vs private residence). For the age group data, MDH changed from reporting cases, admissions and deaths each week using 5-year age groups to using the same age groups used for vaccination data (0-4, 5-11, 12-17, 18-49, 50-64, and 65+).
- The data for the charts on cases, hospital admissions, and deaths comes from the data file “cage.csv”, Case Rate by Age Group, available here: https://www.health.state.mn.us/diseases/coronavirus/stats/case.html. The link to the data file is located in the notes under the graphic “Case Rate by Age Group” . The data in the data file is plotted without modification except that we are taking the difference between total hospital admissions and ICU admissions in order to display non-ICU admissions.
- We last published age structure charts on 6/25/2022 using MDH’s previous data reporting system here: https://healthy-skeptic.com/2022/06/25/age-structure-charts-june-23/ Compared to this version the newer charts show the same general shapes over the course of the pandemic, but the newer age group definitions provide less detail.
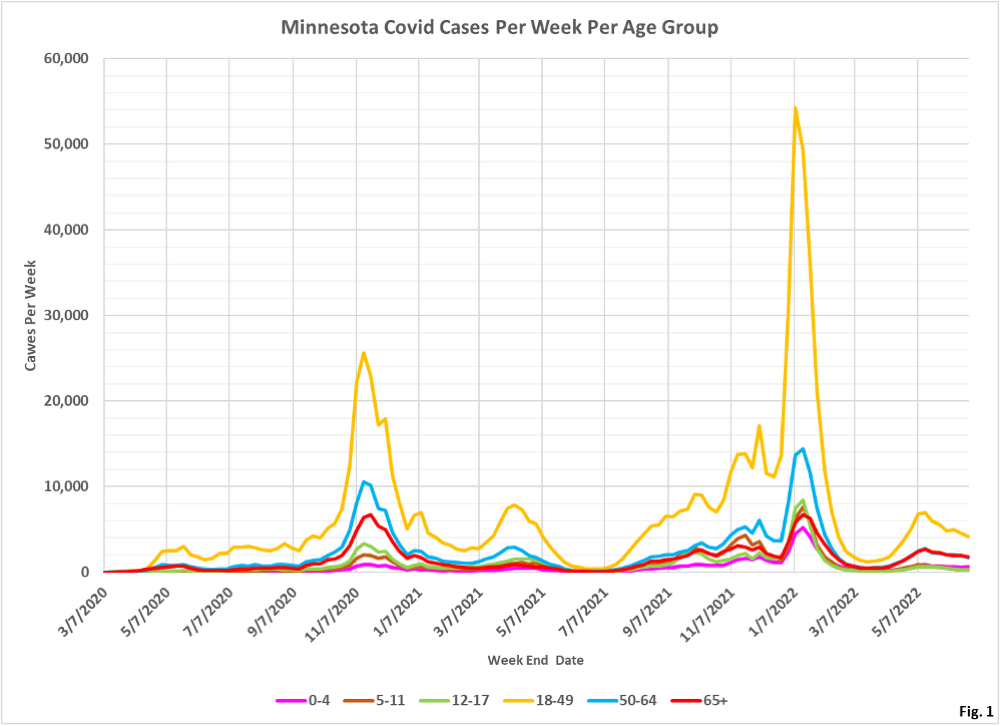
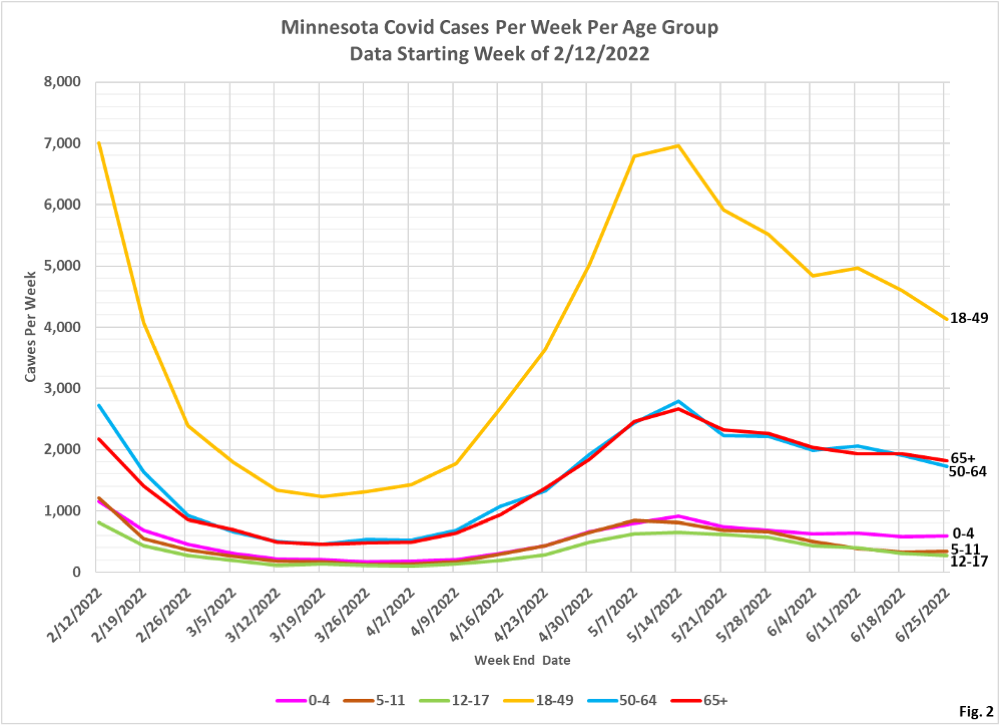
- Fig. 1 and 2: Covid Cases Per Week. The reported Covid cases this week are continuing the gradual declining trend. The 18-49 age group has the largest number of cases and also has the largest decline in recent weeks, as seen in Fig. 2.
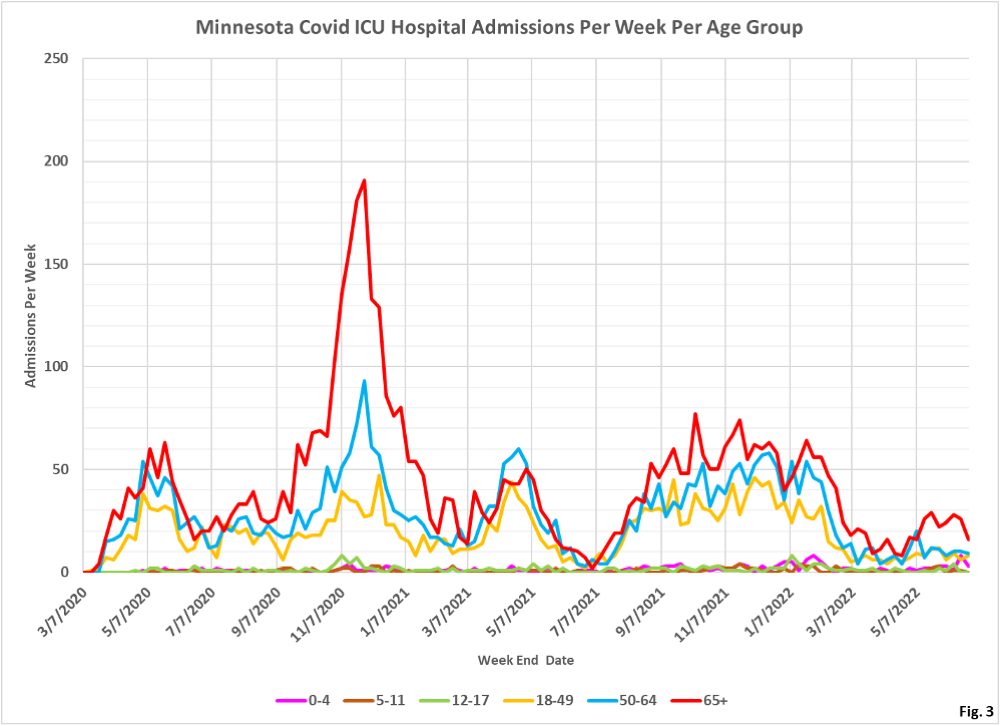
- Fig. 3 and 4: ICU Covid Admissions Per Week. ICU admissions occur in age order, with the older age groups having the most admissions. The only exception is the 0-4 age group, which in recent weeks had more admissions than the 5-11 and 12-17 age groups.
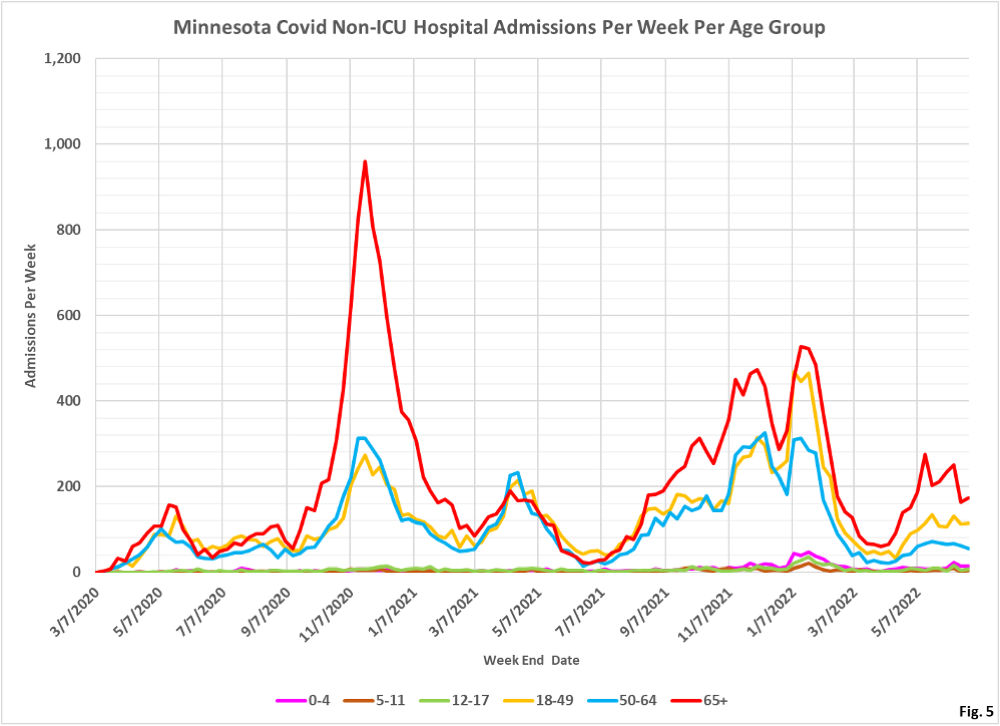
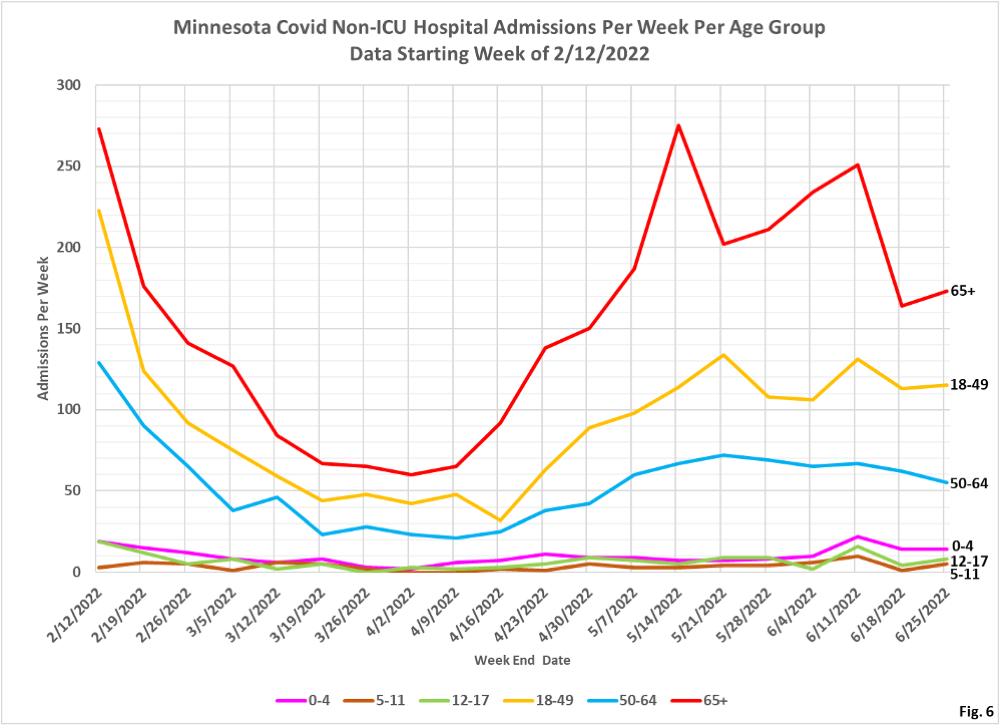
- Fig. 5 and 6: Non-ICU Covid Admissions Per Week. Non-ICU admissions are ranked by age group similar to the ICU admissions, except that the 18-49 age group had more admissions than the 50-64 age group over a period of the last several months, in contrast to ICU admissions where the 50-64 age groups generally had the same or more admissions than the 18-49 age group.
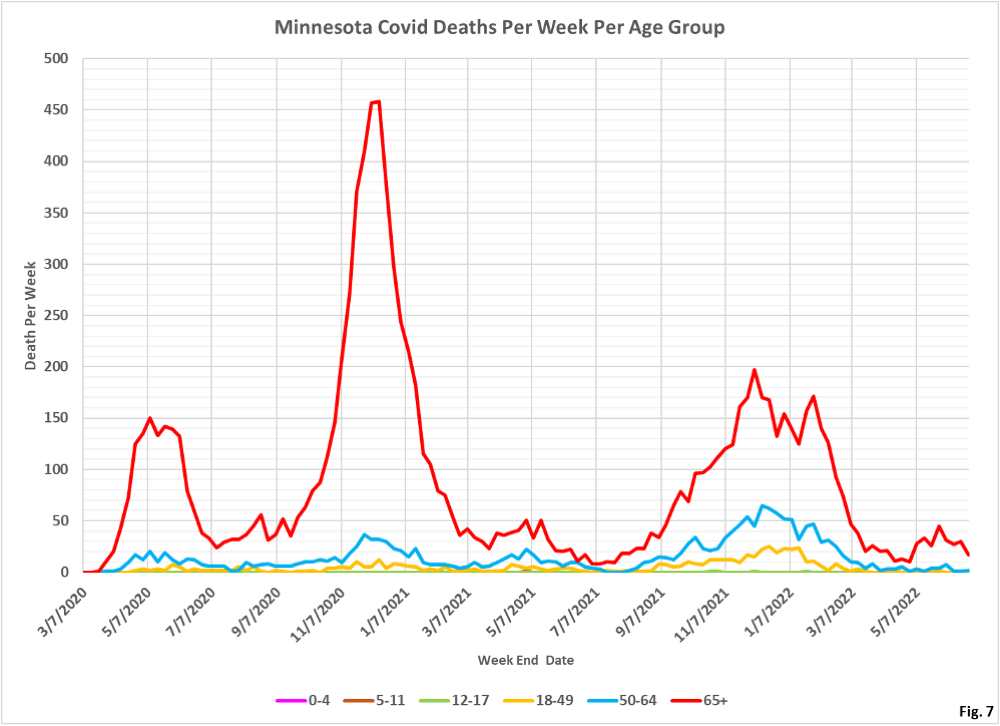
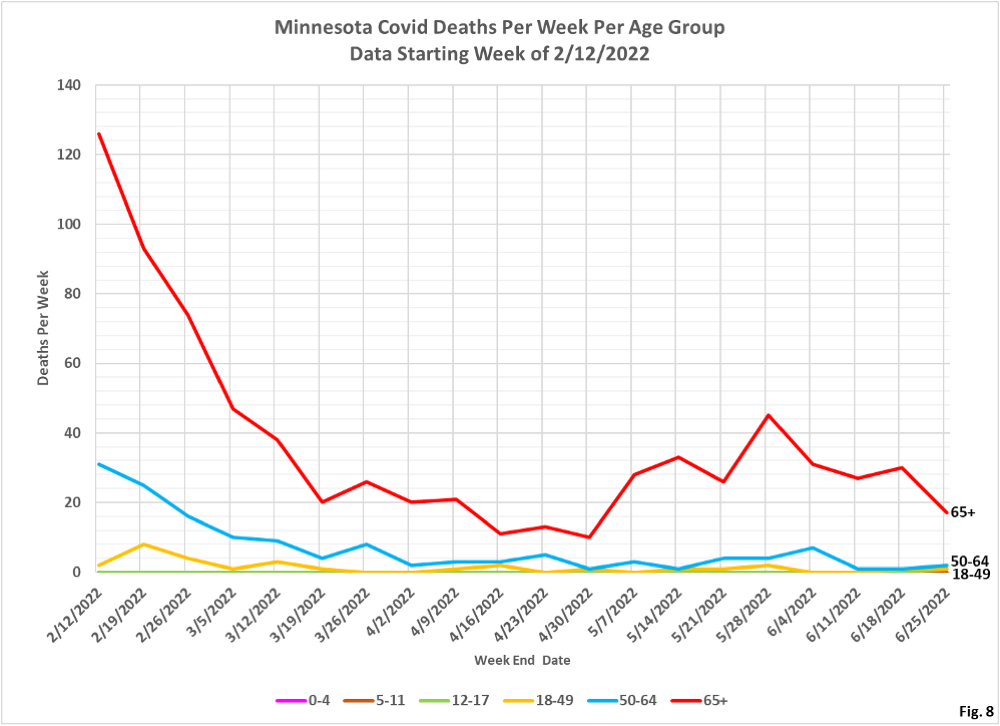
- Fig. 7 and 8: Covid Deaths Per Week. The 65+ age group contains the great majority of the Covid deaths. Not a surprise as the old version of these charts showed that the 80+ age group usually had the most number of deaths.
