These charts are based partly on the weekly data released by the state every Thursday and partly on other files, as Dave details below. They are designed to show the impact of the epidemic by age group. As has always been the case, infections are highest in the youngest groups, hospitalizations in the middle-aged and elderly and deaths in the very old.
 Dave’s notes:
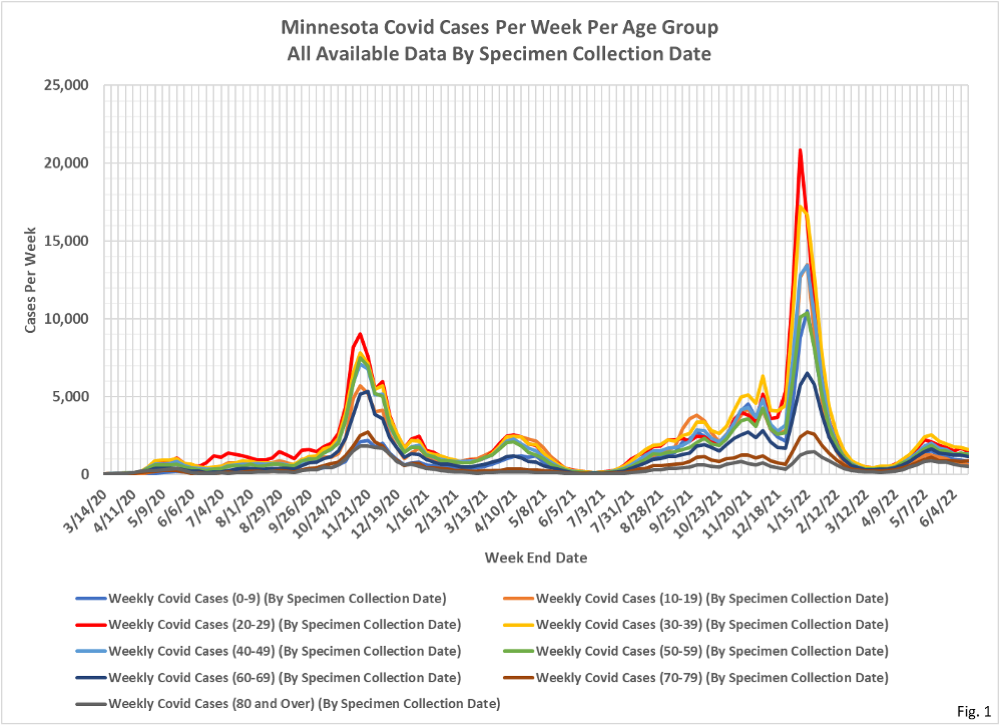
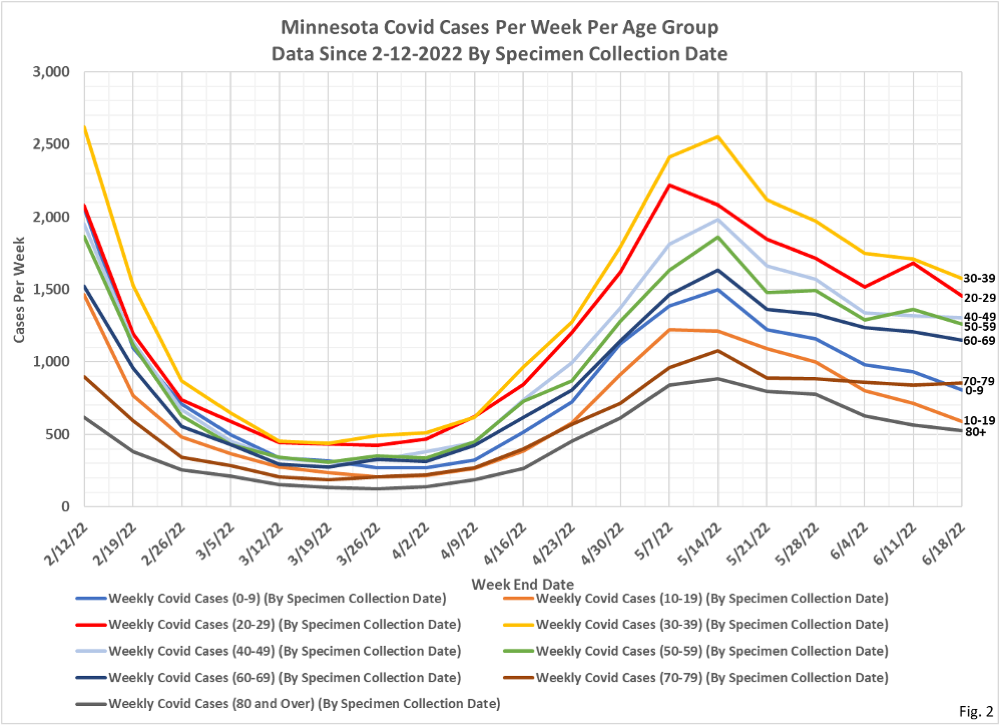
- Fig. 1 and 2: Covid Cases Per Week. The reported Covid cases this week are continuing the gradual declining trend. The 70-79 age group has been almost constant for 5 weeks in a row while the other age groups are generally declining. Total reported cases for the week were 9,522 total for all age groups, down from 10,337 revised cases reported last week.
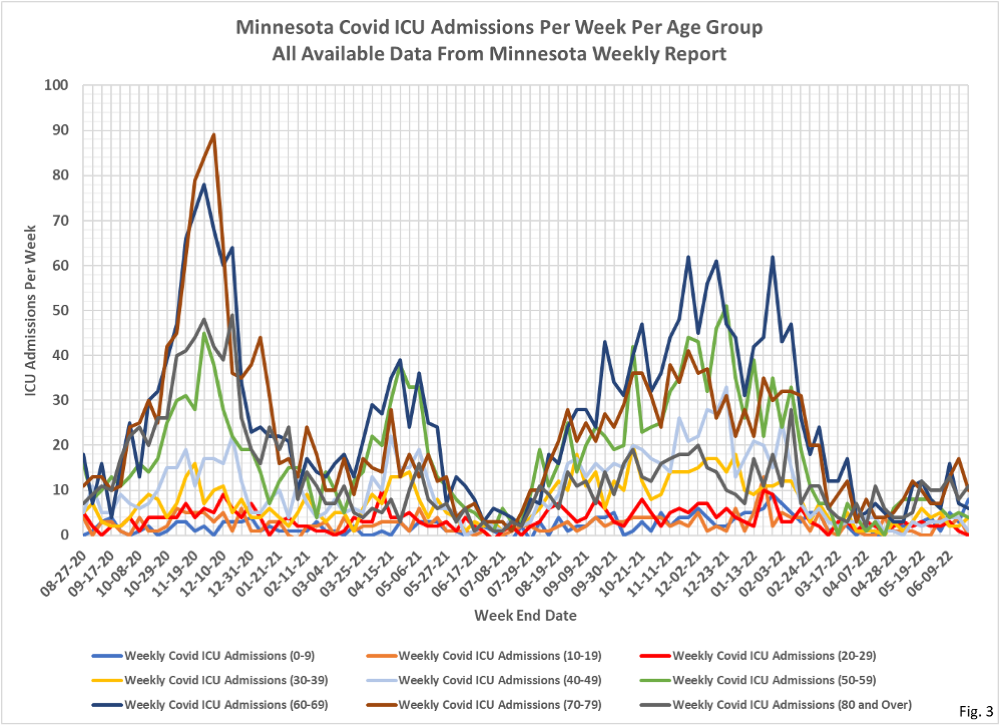
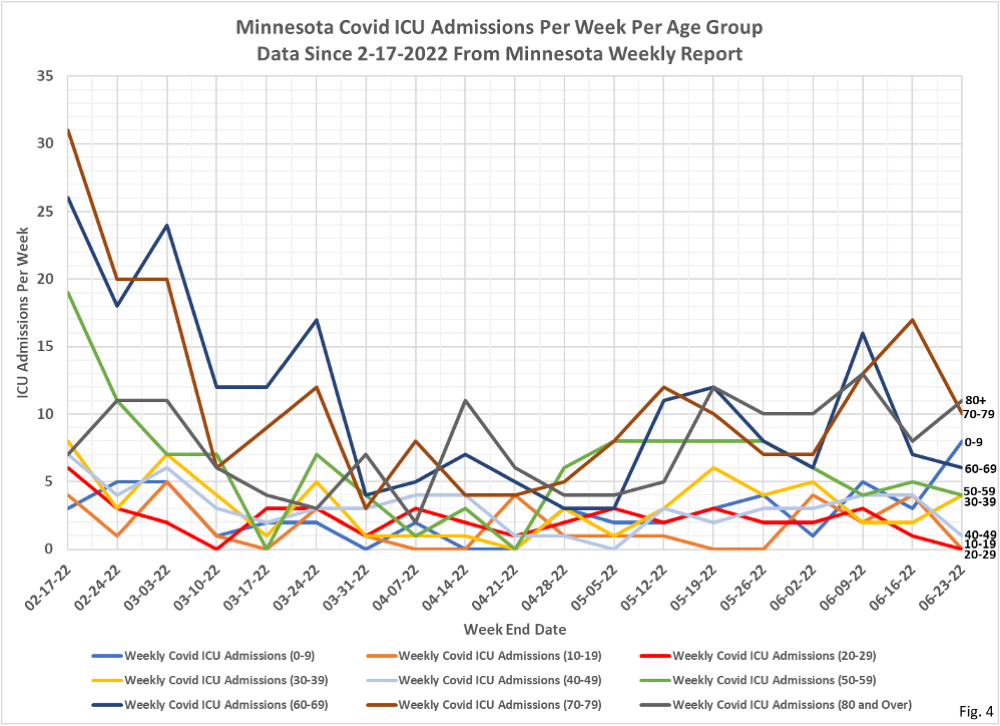
- Fig. 3 and 4: ICU Covid Admissions Per Week. There were 44 reported Covid ICU admissions for the week, a decrease of 7 from the total of 51 admissions reported last week. The 0-9, 30-39, and 80+ age groups were higher while the most of the other age groups were lower, especially the 70-79 age group.
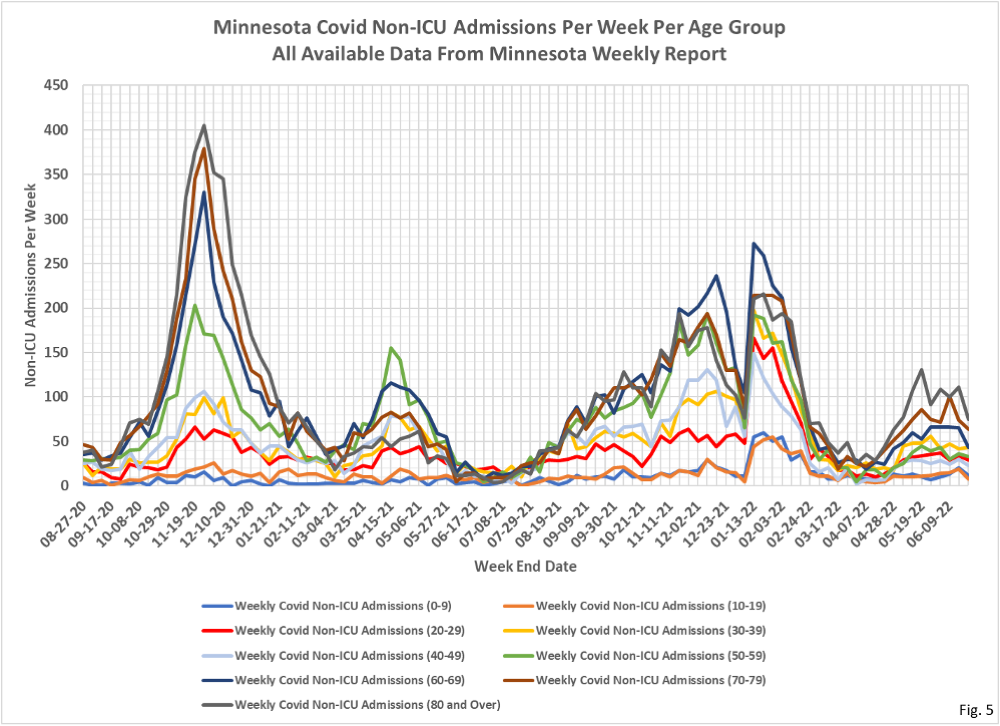
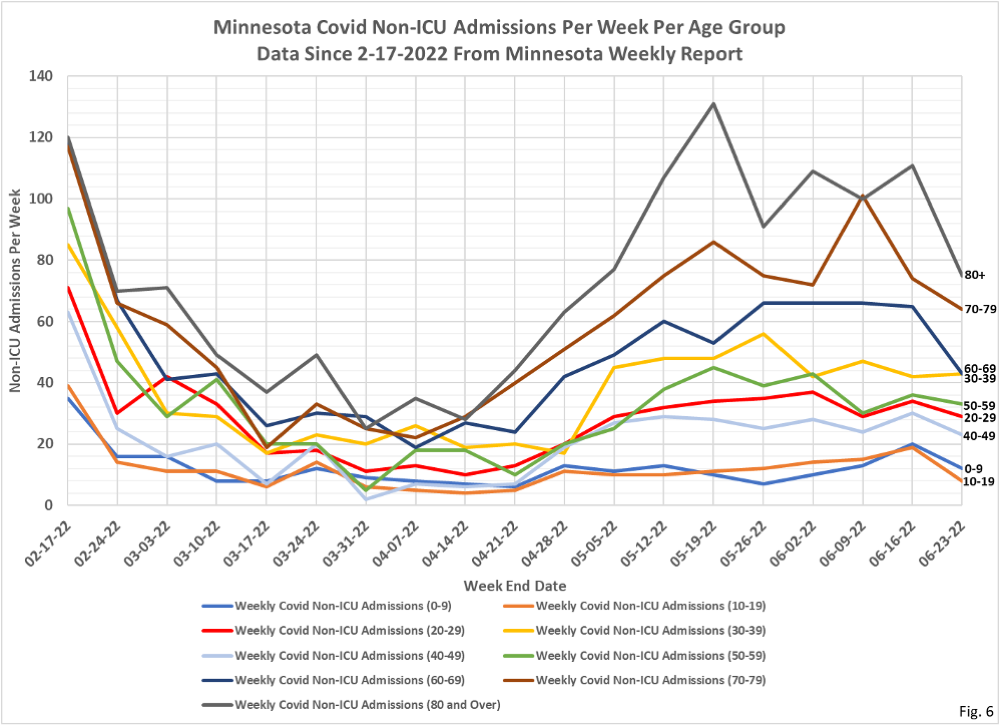
- Fig. 5 and 6: Non-ICU Covid Admissions Per Week. There were 330 reported total Covid non-ICU admissions for the week, significantly lower than the 431 admissions last week. All age groups were lower for the week, except 30-39 which increased by 1.
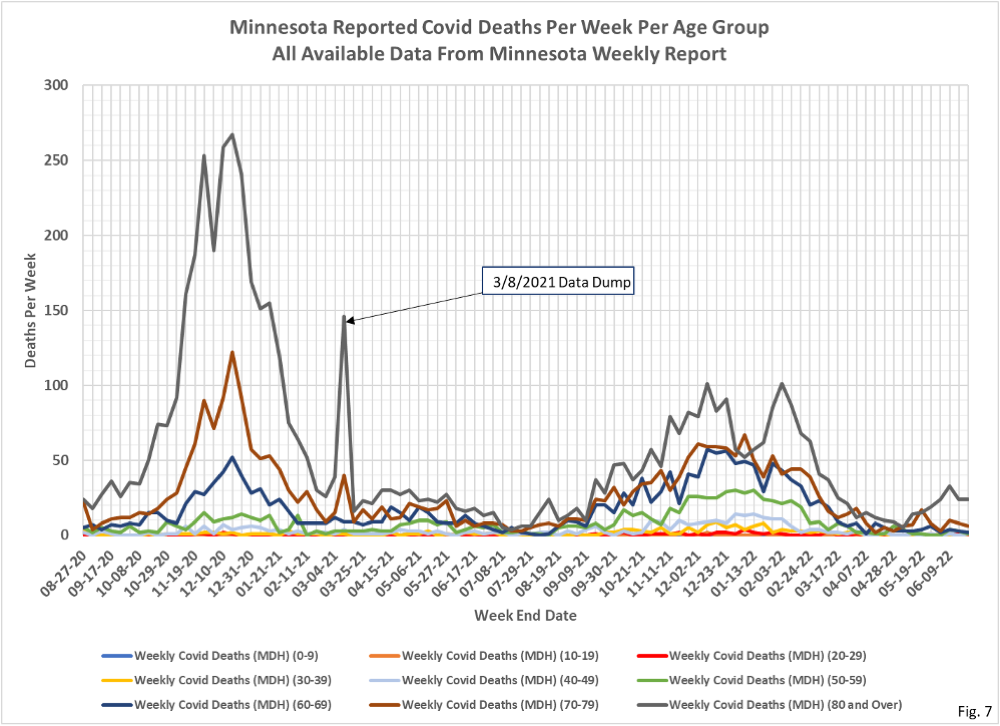
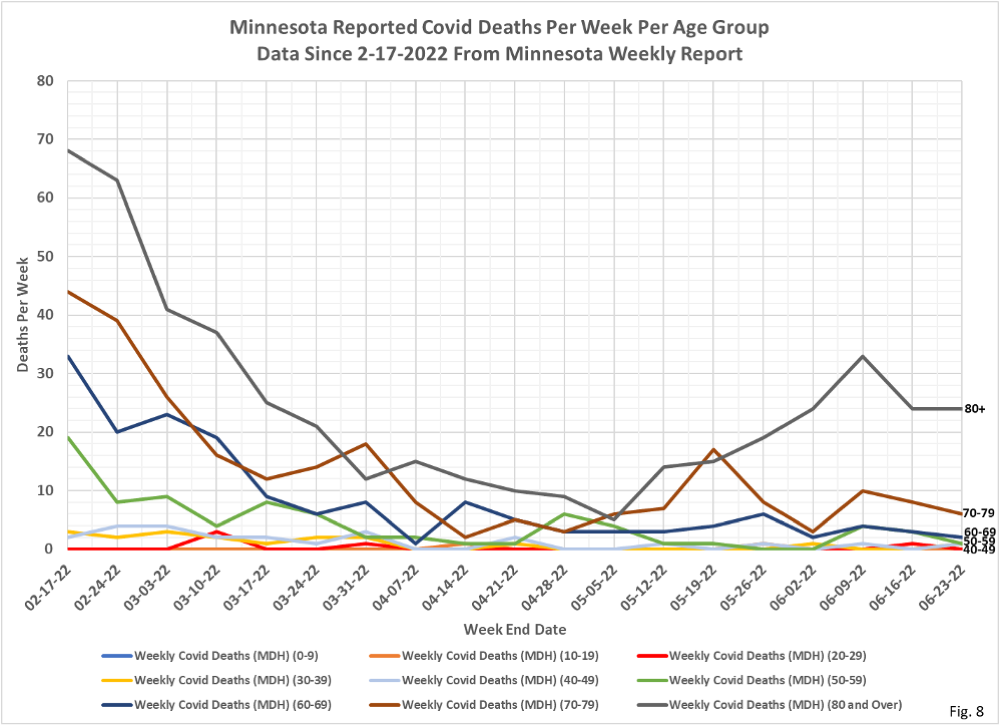
- Fig. 7 and 8: Covid Deaths Per Week. There were 35 reported Covid deaths for the week, down from 39 reported deaths last week. Deaths were lower in all age groups, except for the 80+ age group which was the same as the week before, and the 40-49 age group which went from o to 1 reported death.
Data Sources:
The data for the charts on testing, hospital admissions, and deaths comes from the Minnesota Weekly Report (available here: https://www.health.state.mn.us/diseases/coronavirus/stats/index.html). The data in the Weekly Report is presented as cumulative totals for each data type each week. We are taking weekly differences and assembling the data into charts. This data is by date of report, meaning the charts are documenting new events reported this week, even though the underlying event occurred sometime in the past. The data is provided for 5 year age groups, and I am assembling into 10 year age groups to make the charts more readable.
The data for the Covid cases per week come from a data file published along with the Minnesota Weekly Report, here: https://www.health.state.mn.us/diseases/coronavirus/stats/index.html#wagscd1 This data is published by date of specimen collection, rather than by date of report as the other data is. The data is provided as cases per week in 5 year age groups. We are compiling the data into 10 year age groups in order for the charts to be more readable. This data is updated by date of specimen collection, so it is likely that the past week’s data will be updated.
