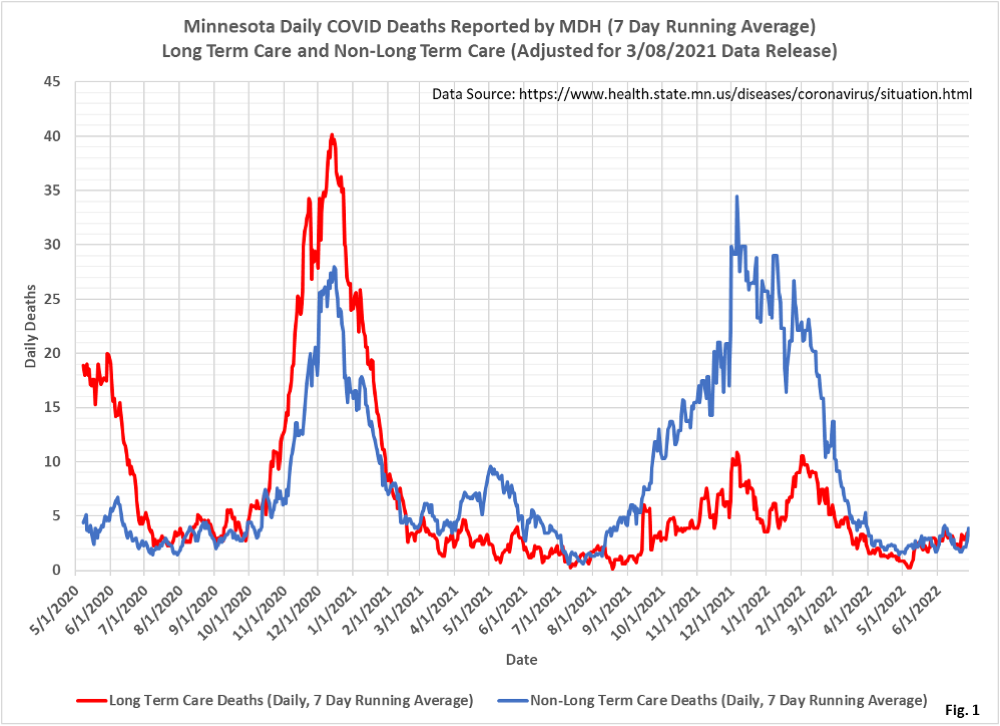
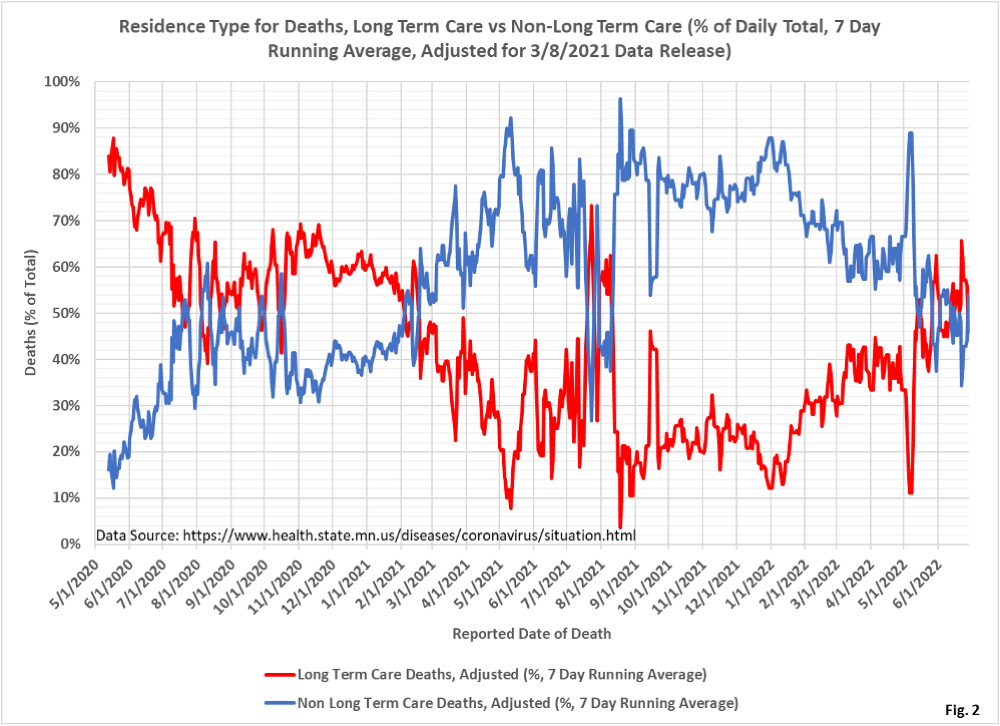
Early in the epidemic, over two years ago now, the majority of CV-19 deaths were among long-term care residents. That vulnerable pool became somewhat tapped out and vaccines helped, at least for a few months. The proportion of deaths shifted. Now we are seeing rough equivalence in deaths, although obviously the rate in the LTC population, which is far smaller than the general population, is much higher. But vaccine effectiveness has obviously declined and there has been some refreshing of the vulnerable LTC pool.
 Dave’s notes:
- The Minnesota Department of Health stopped publishing deaths categorized by type of residence when they revised they data publishing on 6/30/2022 on their Situation Update web page: https://www.health.state.mn.
us/diseases/coronavirus/stats/ index.html . Until an alternate data source can be found this will be the last update to these charts we can provide. - Deaths by residence type were formerly reported based on date of report, not by date of death. Because reporting lags can vary over time, the actual ratios between Long Term Care and Non-Long Term Care deaths may vary from the data shown on these charts.
- Residence type is tabulated daily, concerted to a 7 day running average, and then plotted.
- On March 9, 2021 (credited to the previous day 3/08/2021) MDH released the results of an audit, reporting 891 cases and 138 deaths that had occurred over the past year but had not been reported. 140 total deaths were reported on 3/9/2021, of which 138 were Long Term Care residents. The 891 additional cases were equally apportioned to PCR cases back to the start of the pandemic, in proportion to previously reported cases. LTC deaths were added to the LTC care in proportion to the 891 cases, at the rate of 1 additional LTC death every 6.5 additional case. In this manner the 138 additional LTC deaths were added to the LTC death total over the entirety of the pandemic.
