We are doing these age group breakouts every two weeks. First up is the youngest group. If you think that vaccinating your 5 to 11 year old is going to protect them against infection, you are wrong, completely wrong.
 Dave’s notes:
- The following charts illustrate, for the 5-11 year old age group, that being vaccinated is associated with higher rates of testing positive for Covid in the most recent week’s data available, but the vaccinated have a lower rate of hospital admissions with Covid. The Minnesota Department of Health does not publish breakthrough death data or booster data for the 5-11 age group.
- This post is an update of the breakthrough charts for the 5-11 age group originally published here: https://healthy-skeptic.com/2022/06/06/breakthru-events-ages-5-11/
- There are 6 charts in this set, 3 charts each for cases and hospital admissions. Each set of 3 charts consists of the actual events per week (cases, admissions, or deaths); the rate per 100k each week, and the proportion of events compared to the proportion of the vaccinated or unvaccinated population.
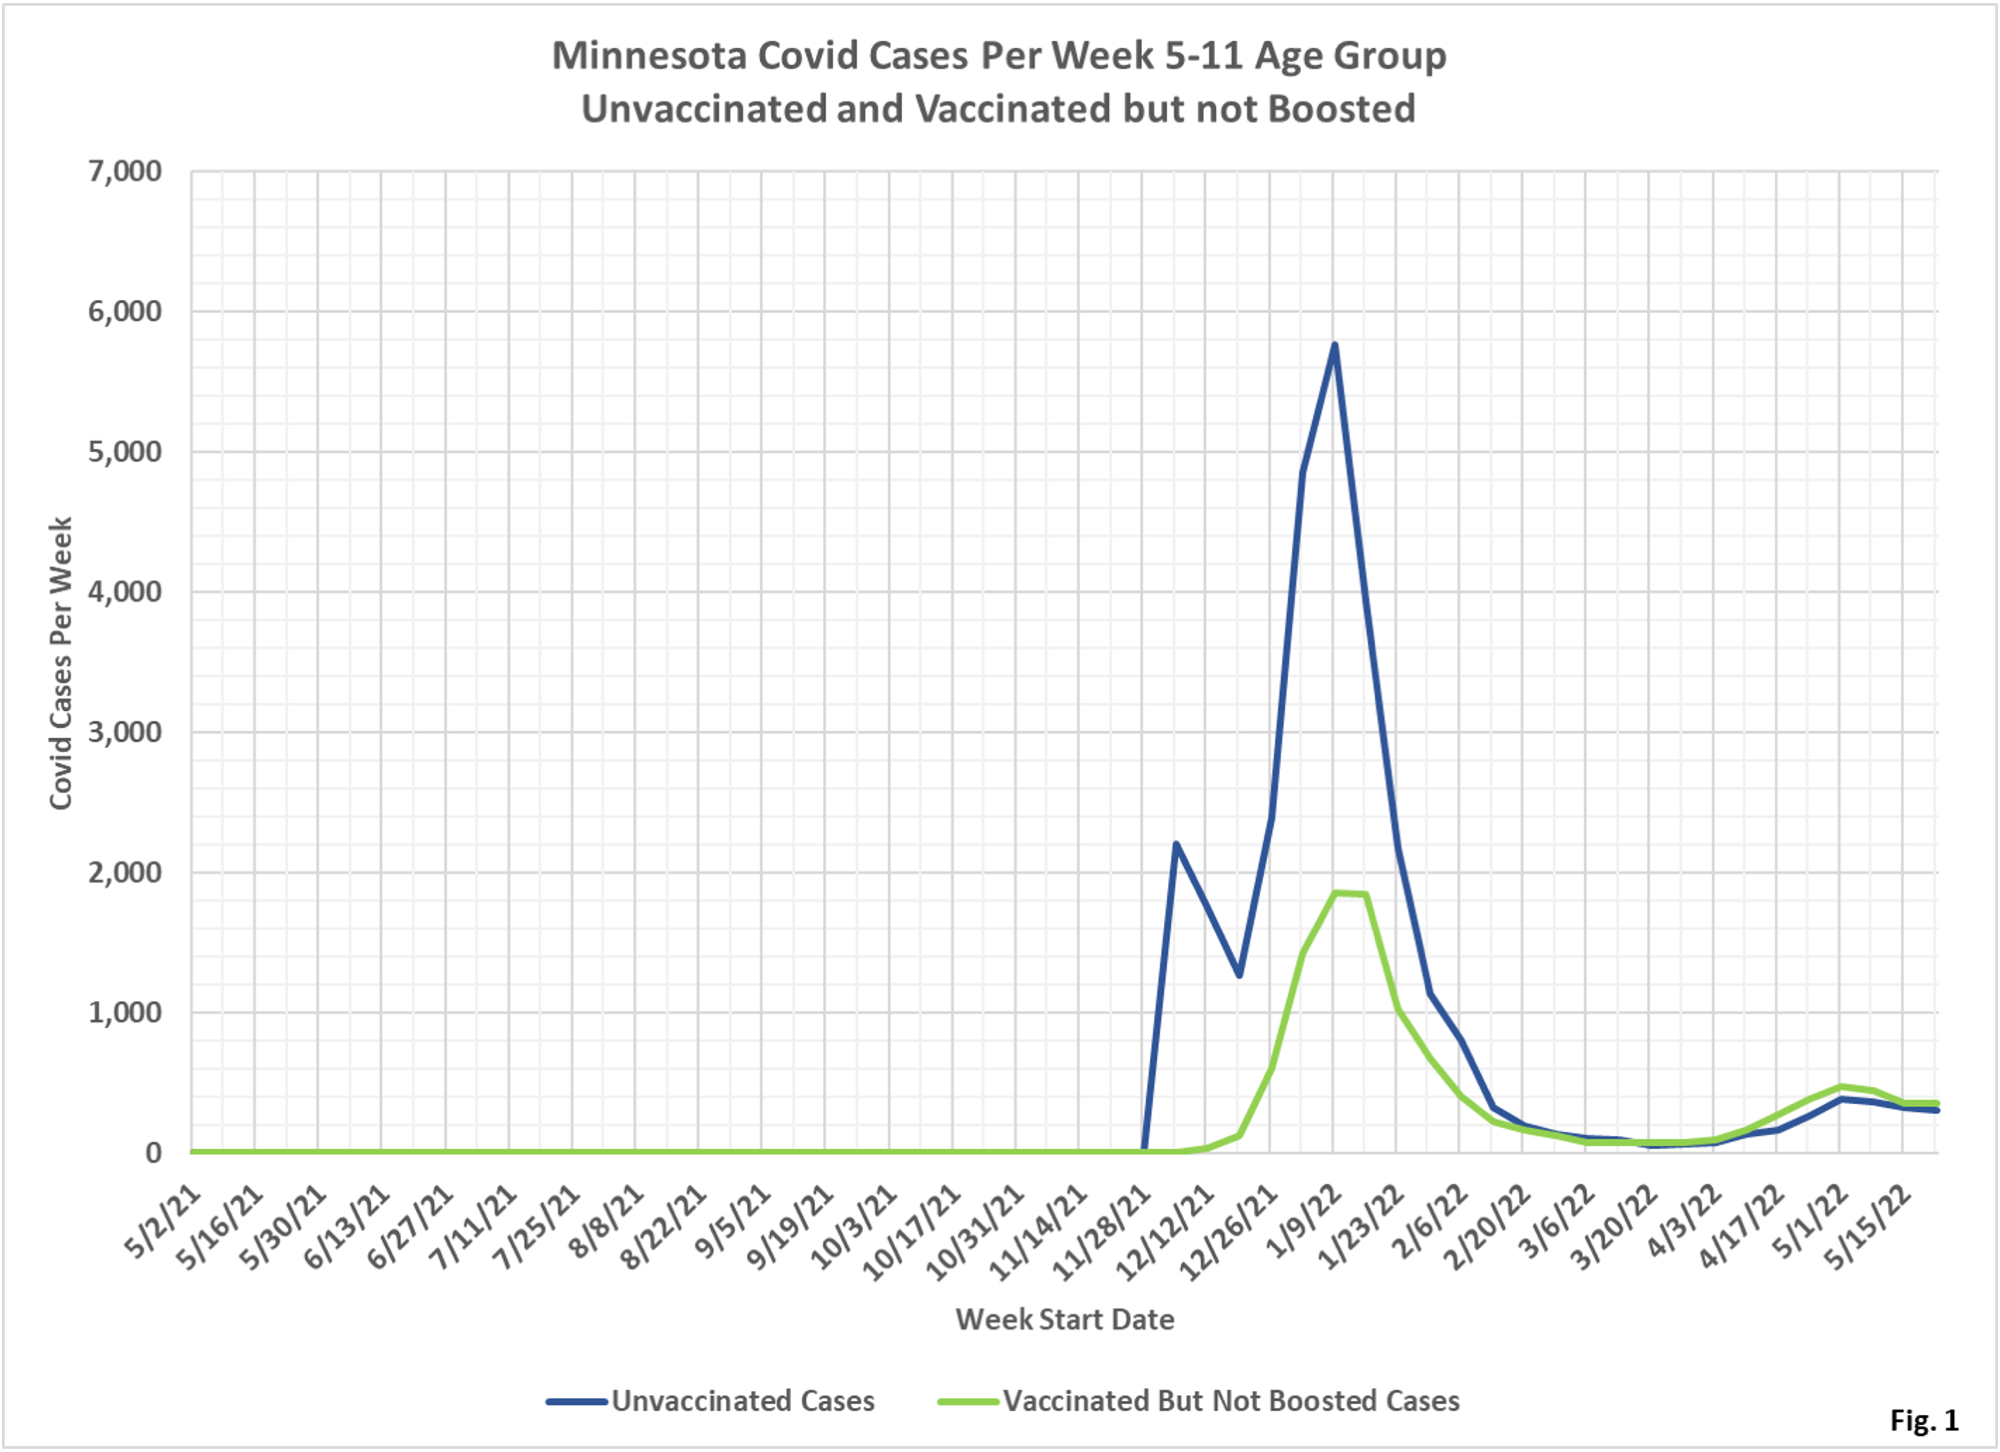
- Fig. 1: This chart plots the cases in the 5-11 age group per week among the unvaccinated and vaccinated but not boosted populations each week. Since the week of 3/20/2022 there have been more cases each week among the vaccinated than among the unvaccinated, although in the last 2 weeks the gap between these two subgroups has narrowed.
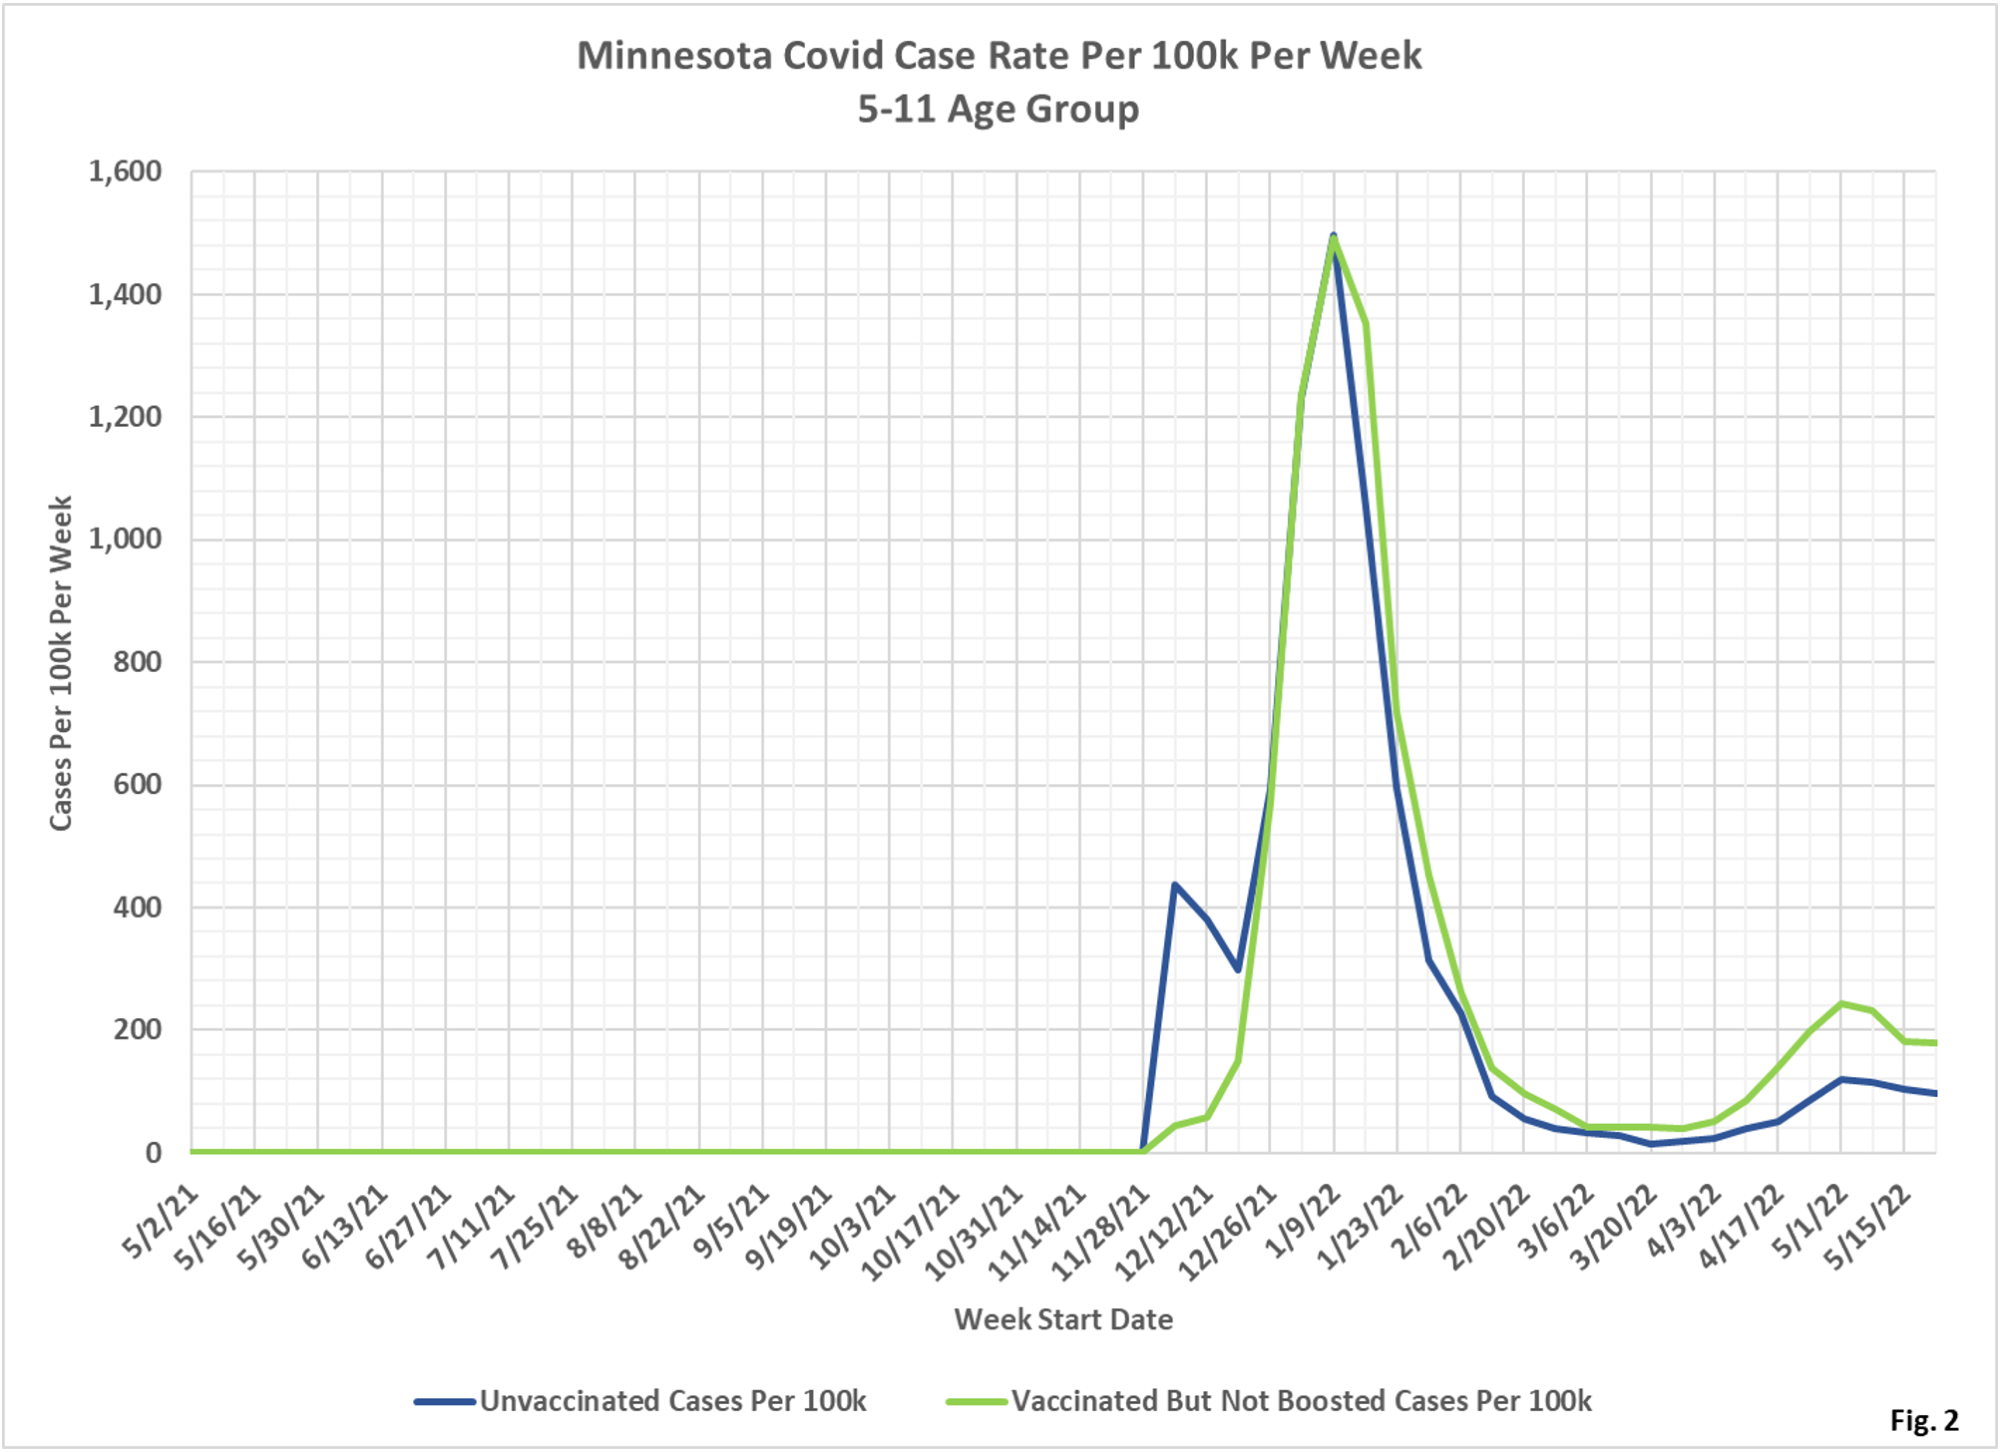
- Fig. 2: This chart displays the case rates per 100k for each subgroup in the 5-11 age group. The vaccinated case rate equals or exceeds the unvaccinated case rate since 12/26/2021.
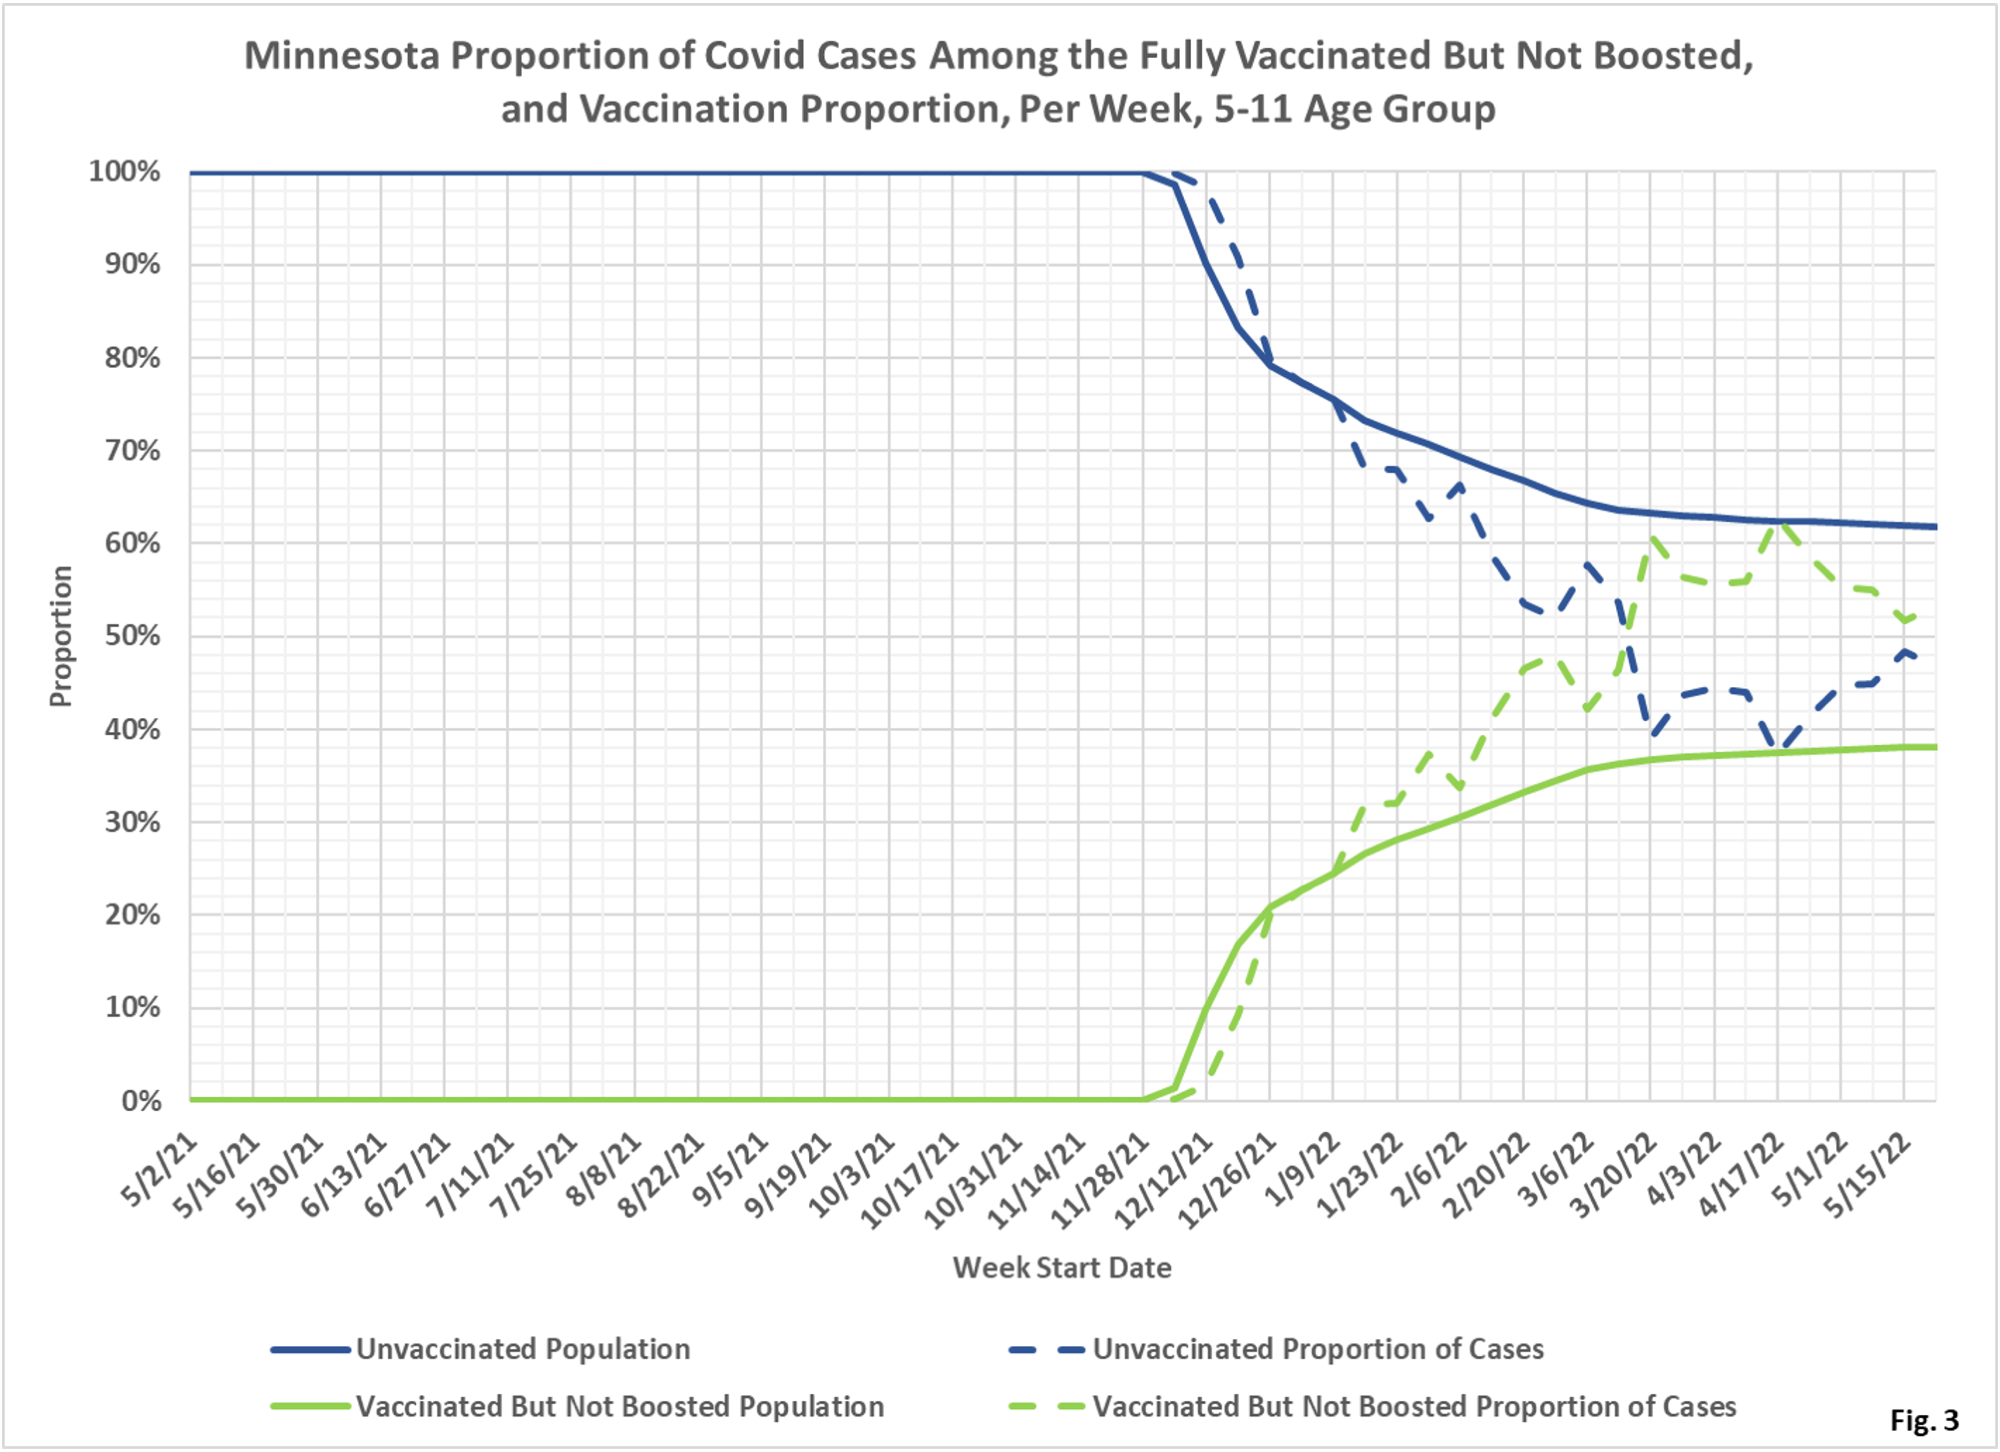
- Fig. 3: This chart displays the proportion of the 5-11 population who are unvaccinated (solid blue) and vaccinated but not boosted (solid green). For each population group we also display the proportion of cases each week (dashed lines of same color). The way to interpret this chart is to compare the proportion of breakthroughs to the proportion of vaccinations for each group. Whenever the dashed breakthrough proportion line is below the solid vaccination line of the same color, then that category is underrepresented for population, and that vaccination status might be said to be beneficial. For the week of 5/22/2022, for example, 38% of this age group was vaccinated (solid green line) while this group accounted for 53% of the cases (dashed green line). We would interpret this to show that being vaccinated did not reduce an individual’s chances of testing positive for Covid for that week. At no point in the pandemic does vaccination show a material benefit for testing positive for Covid for this age group.
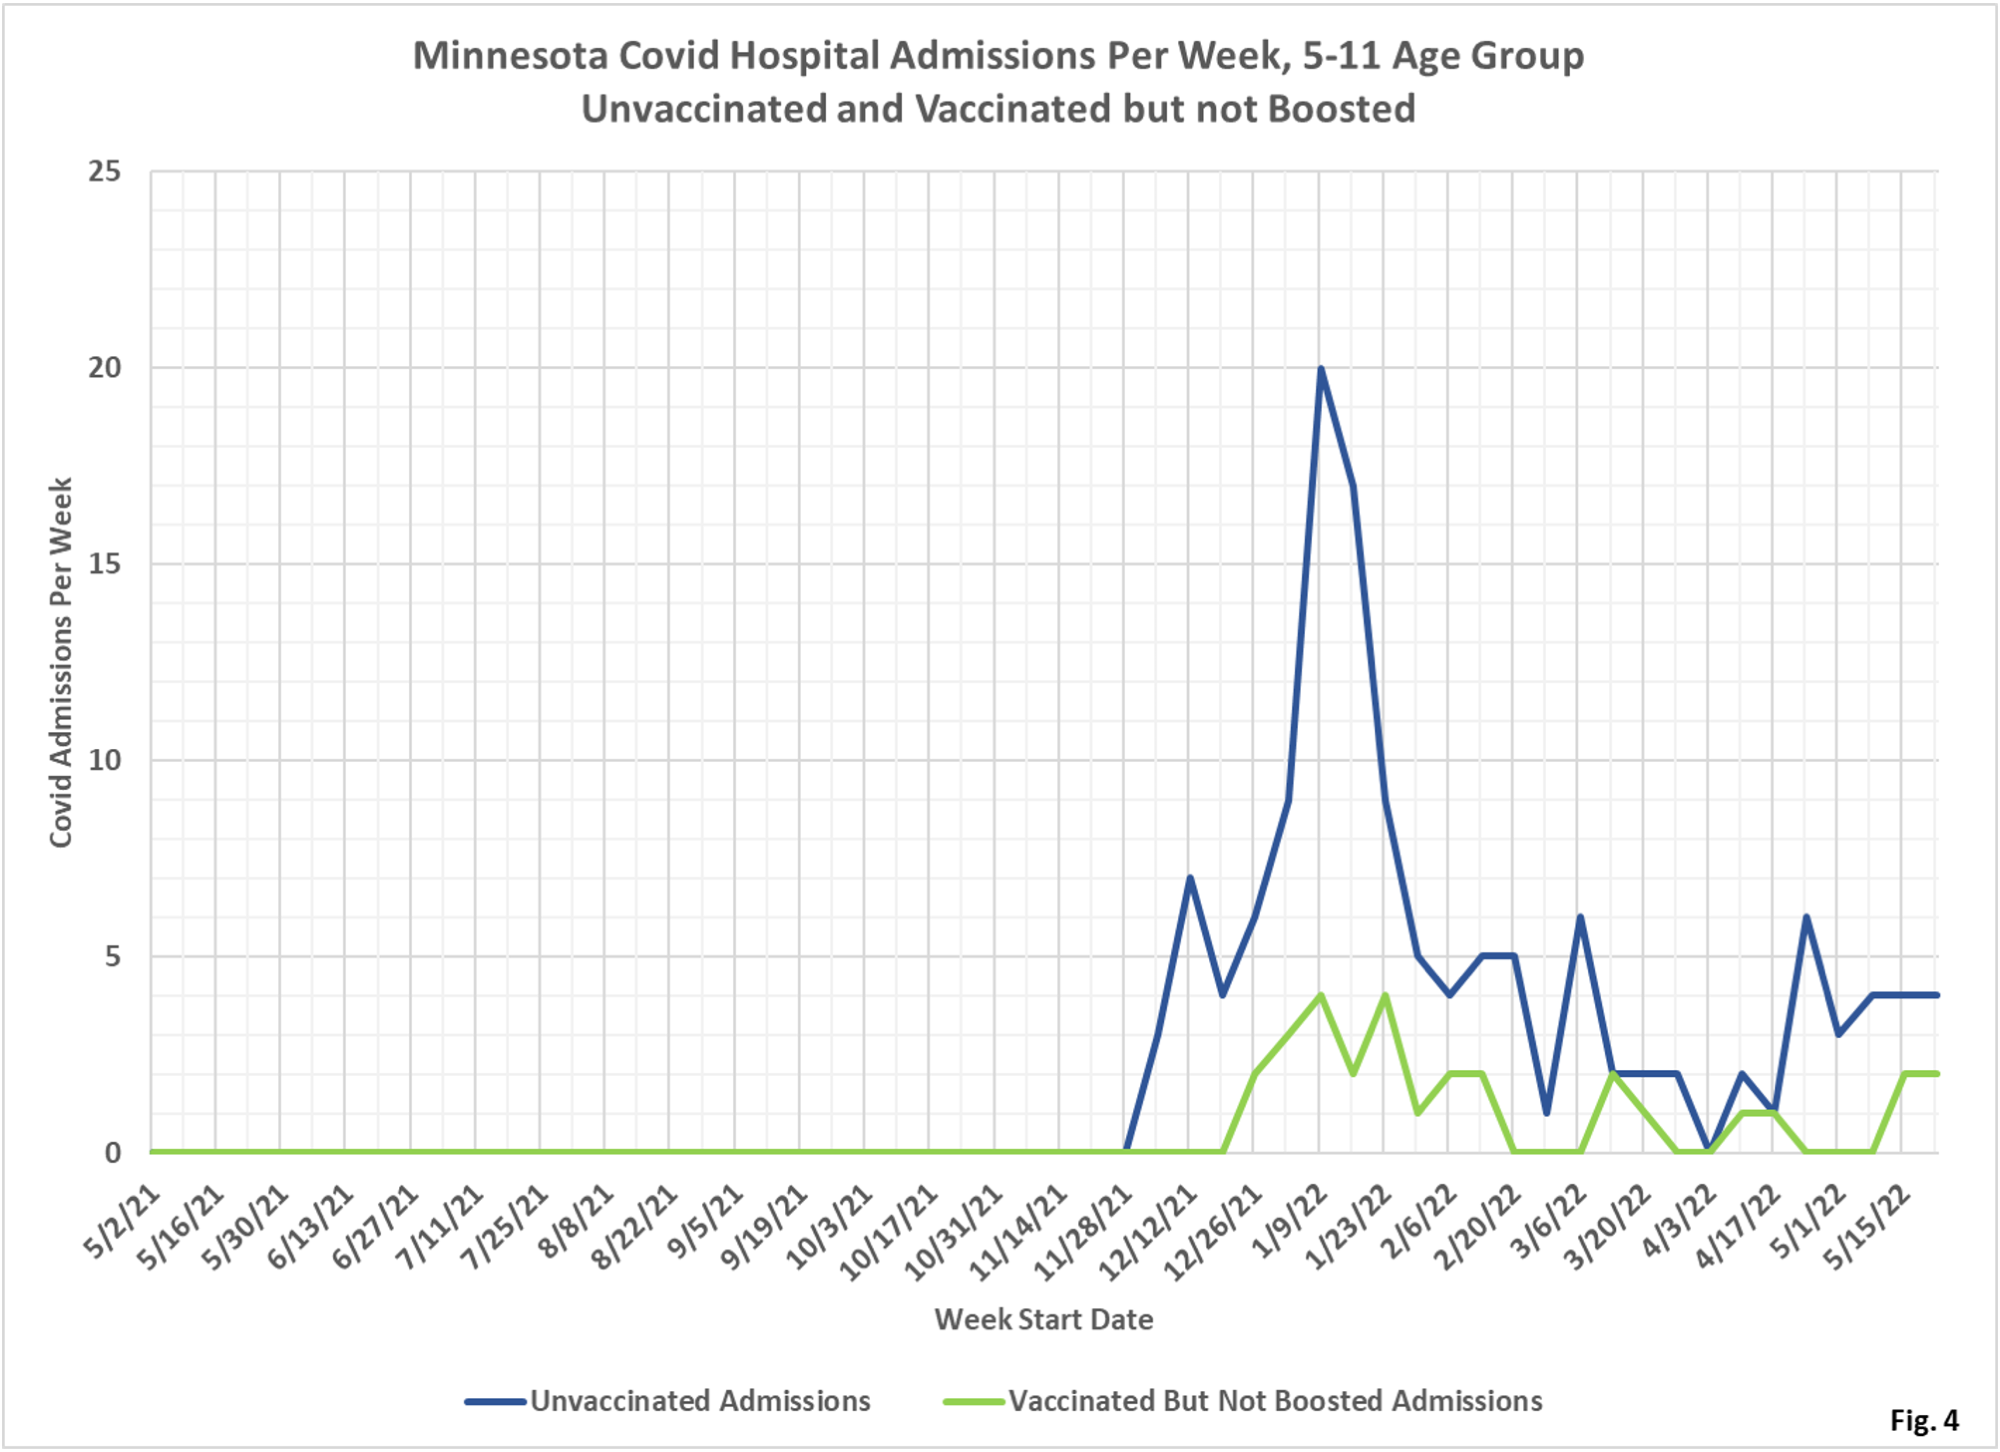
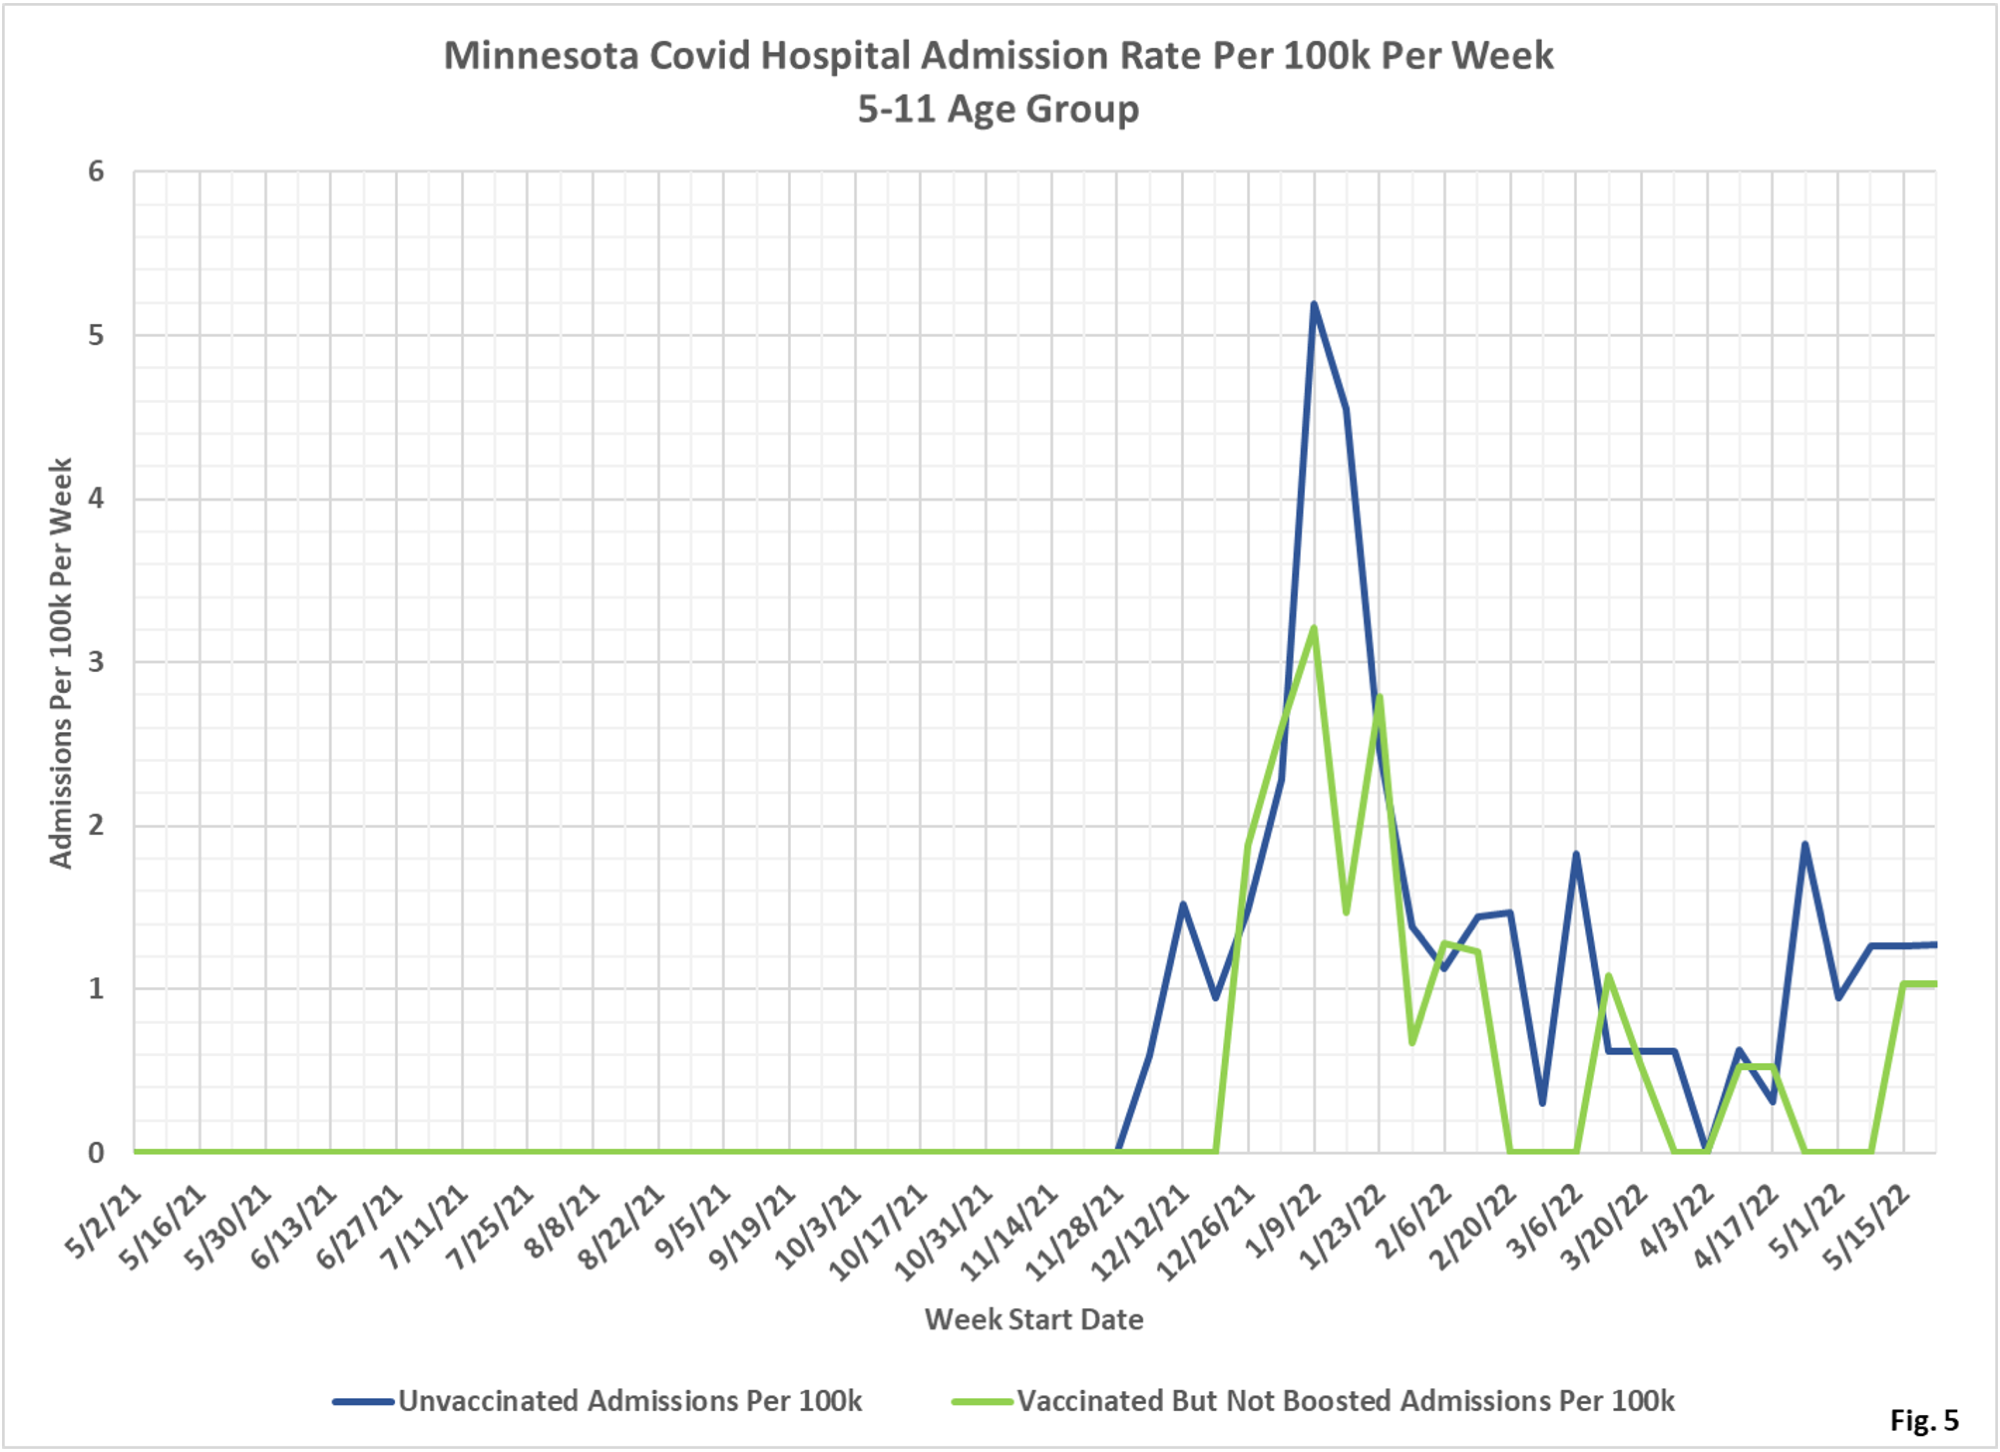
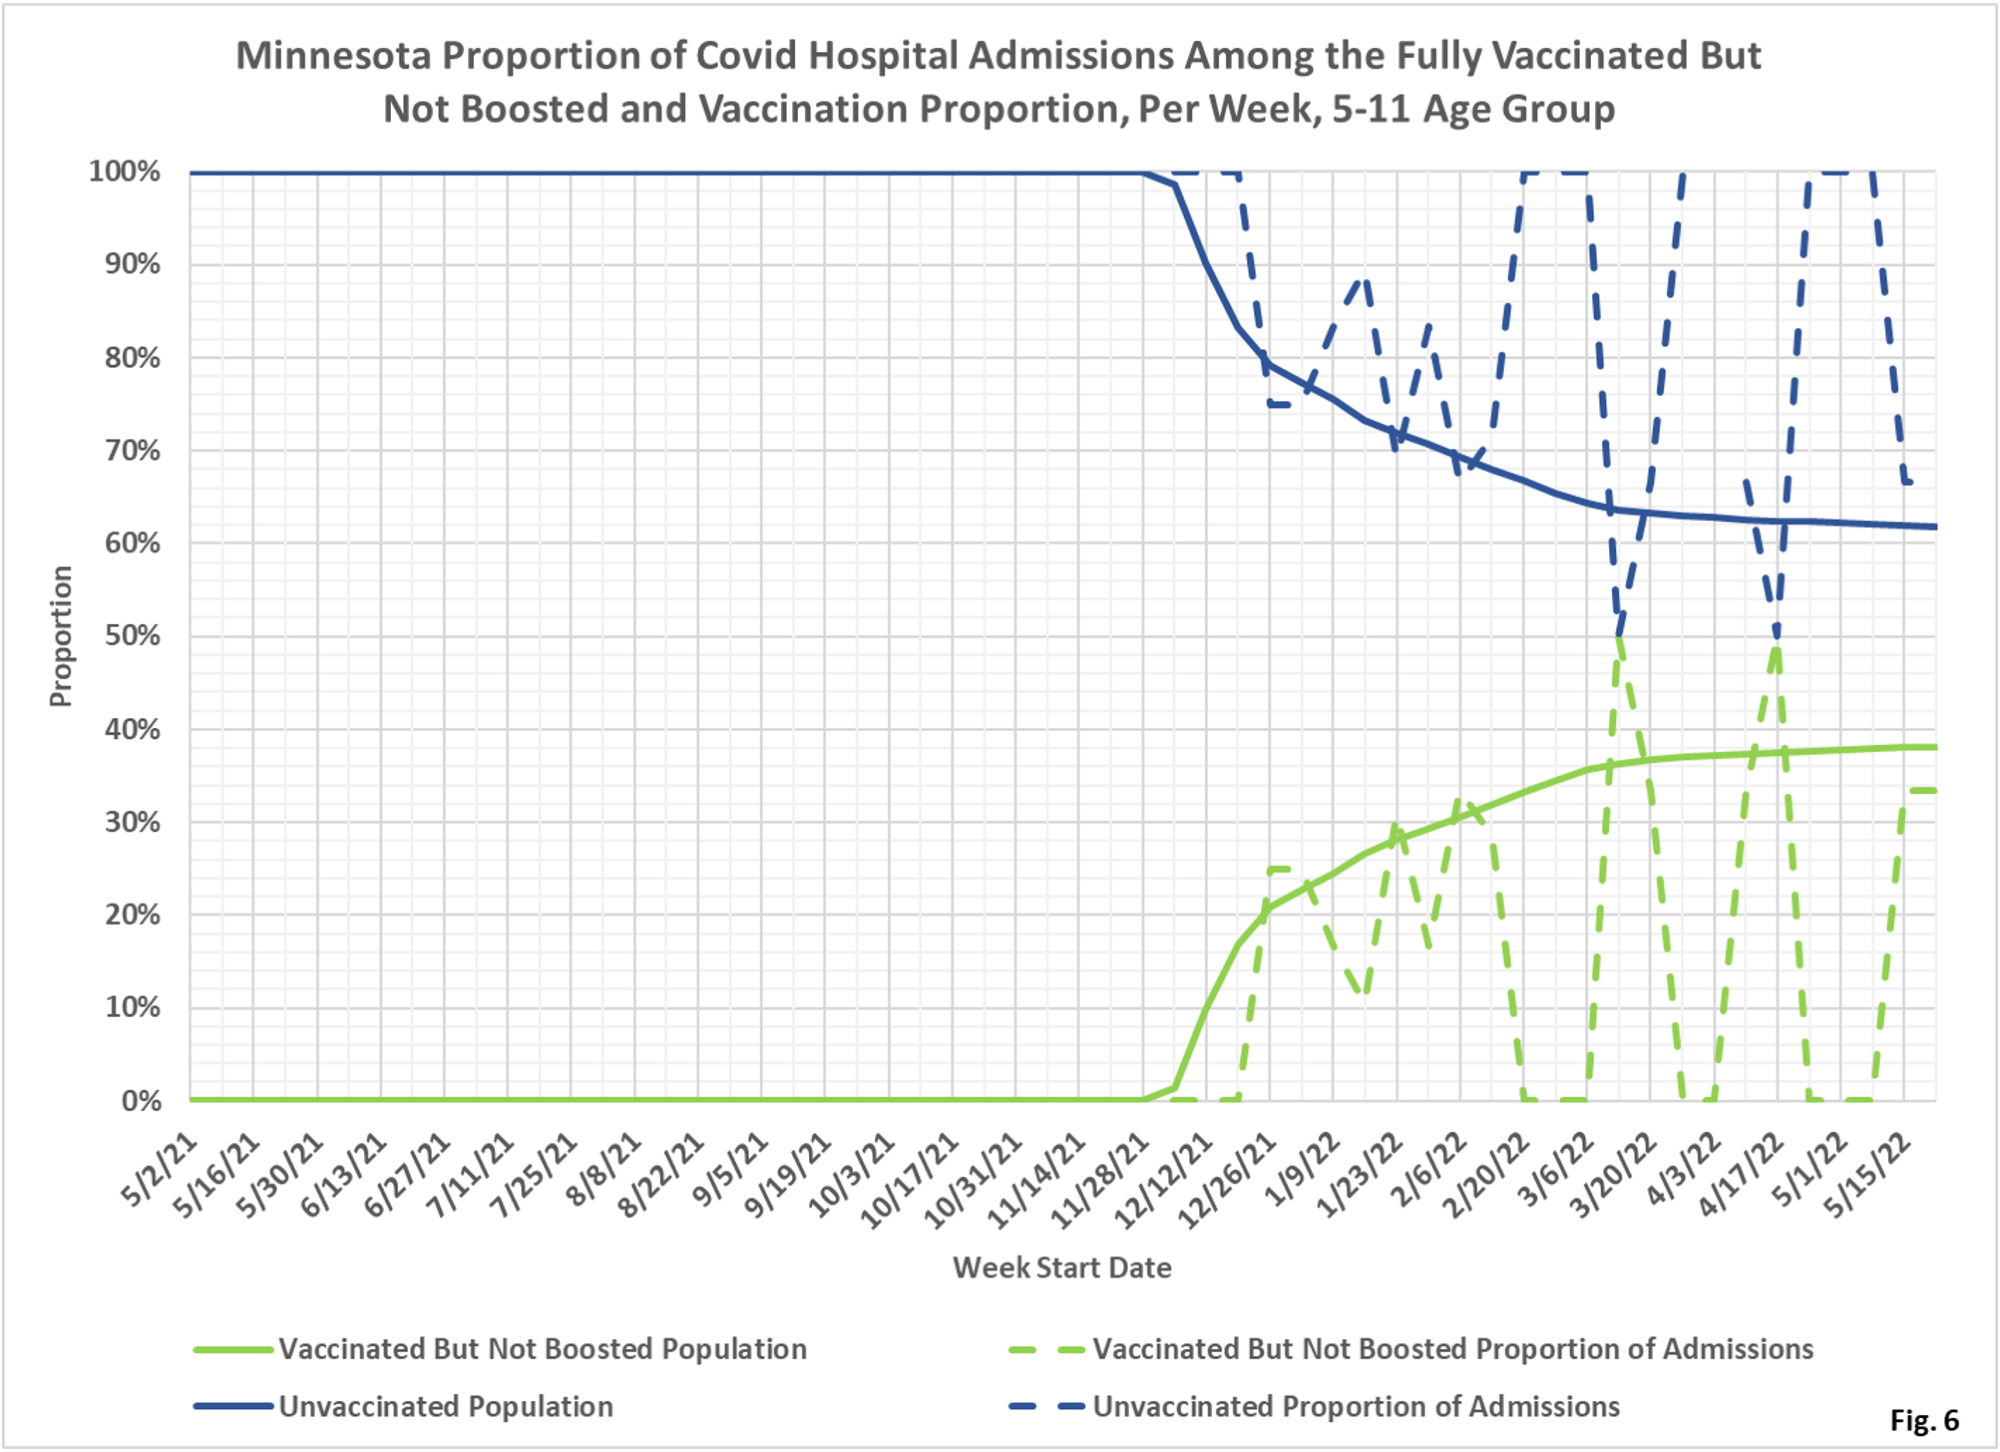
- Fig. 4-6: These charts display the hospital admissions, hospital admission rates per 100k, and hospital admissions proportions for the 5-11 age group, in an identical format to the case charts in Fig. 1 through Fig. 3. The vaccinated have made up the lower number of admissions throughout the pandemic (Fig. 4). The admissions per 100k for the vaccinated are not too dissimilar from the rates for the unvaccinated, but there are very few admissions in this age group anyway (Fig. 5). Fig. 6 shows that admissions among the unvaccinated have generally been disproportionately high throughout the pandemic, but the very small number of admissions make the data quite choppy.
- All data is obtained from the Minnesota Department of Health (MDH) Vaccine Breakthrough Weekly Update web site https://www.health.state.mn.us/diseases/coronavirus/stats/vbt.html. A data file on this site, vbtpedscirates.xlsx, contains all of the age group data.
- MDH defines the fully vaccinated (what we have termed vaccinated but not boosted) as those who have not received a booster after completing their primary vaccination series, and had been vaccinated at least 14 days prior to testing positive.
