Most notable thing is how much the current wave looks like the spring of 2021, just displaced by six weeks. Which is odd given the much more extensive home testing now.
 Dave’s notes:
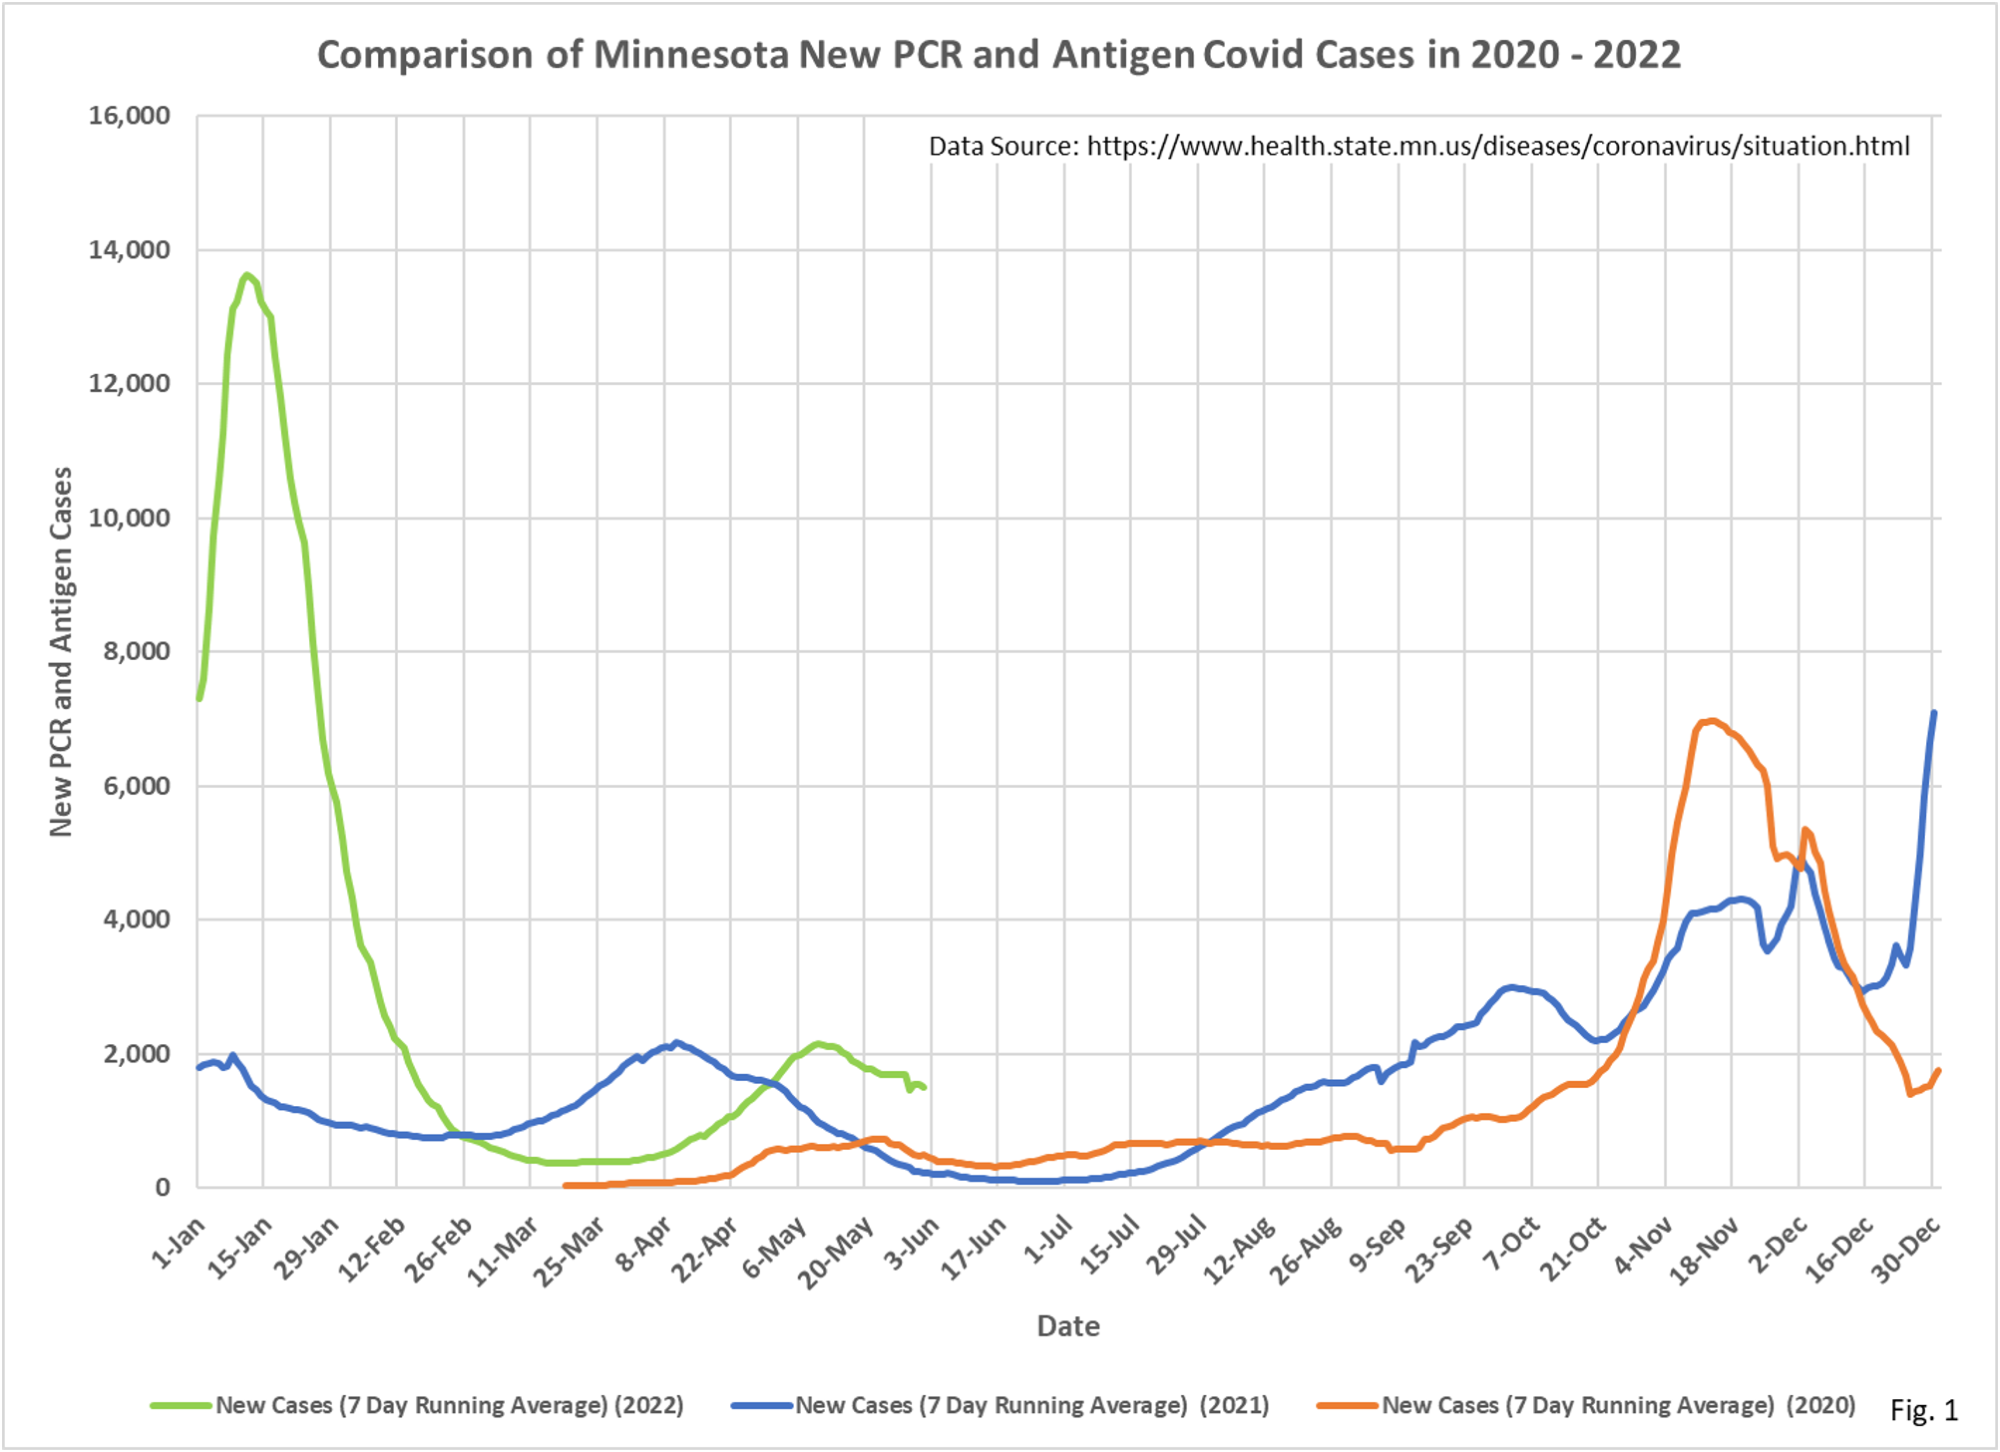
- Fig. 1: The recent surge in new daily cases per day peaked at 2144 average cases per day on 5/11/2022, and have slowly been drifting lower. Of course, we have no data on how many people tested positive only with a home test and were never sick enough to seek medical care and have an official test in the system.
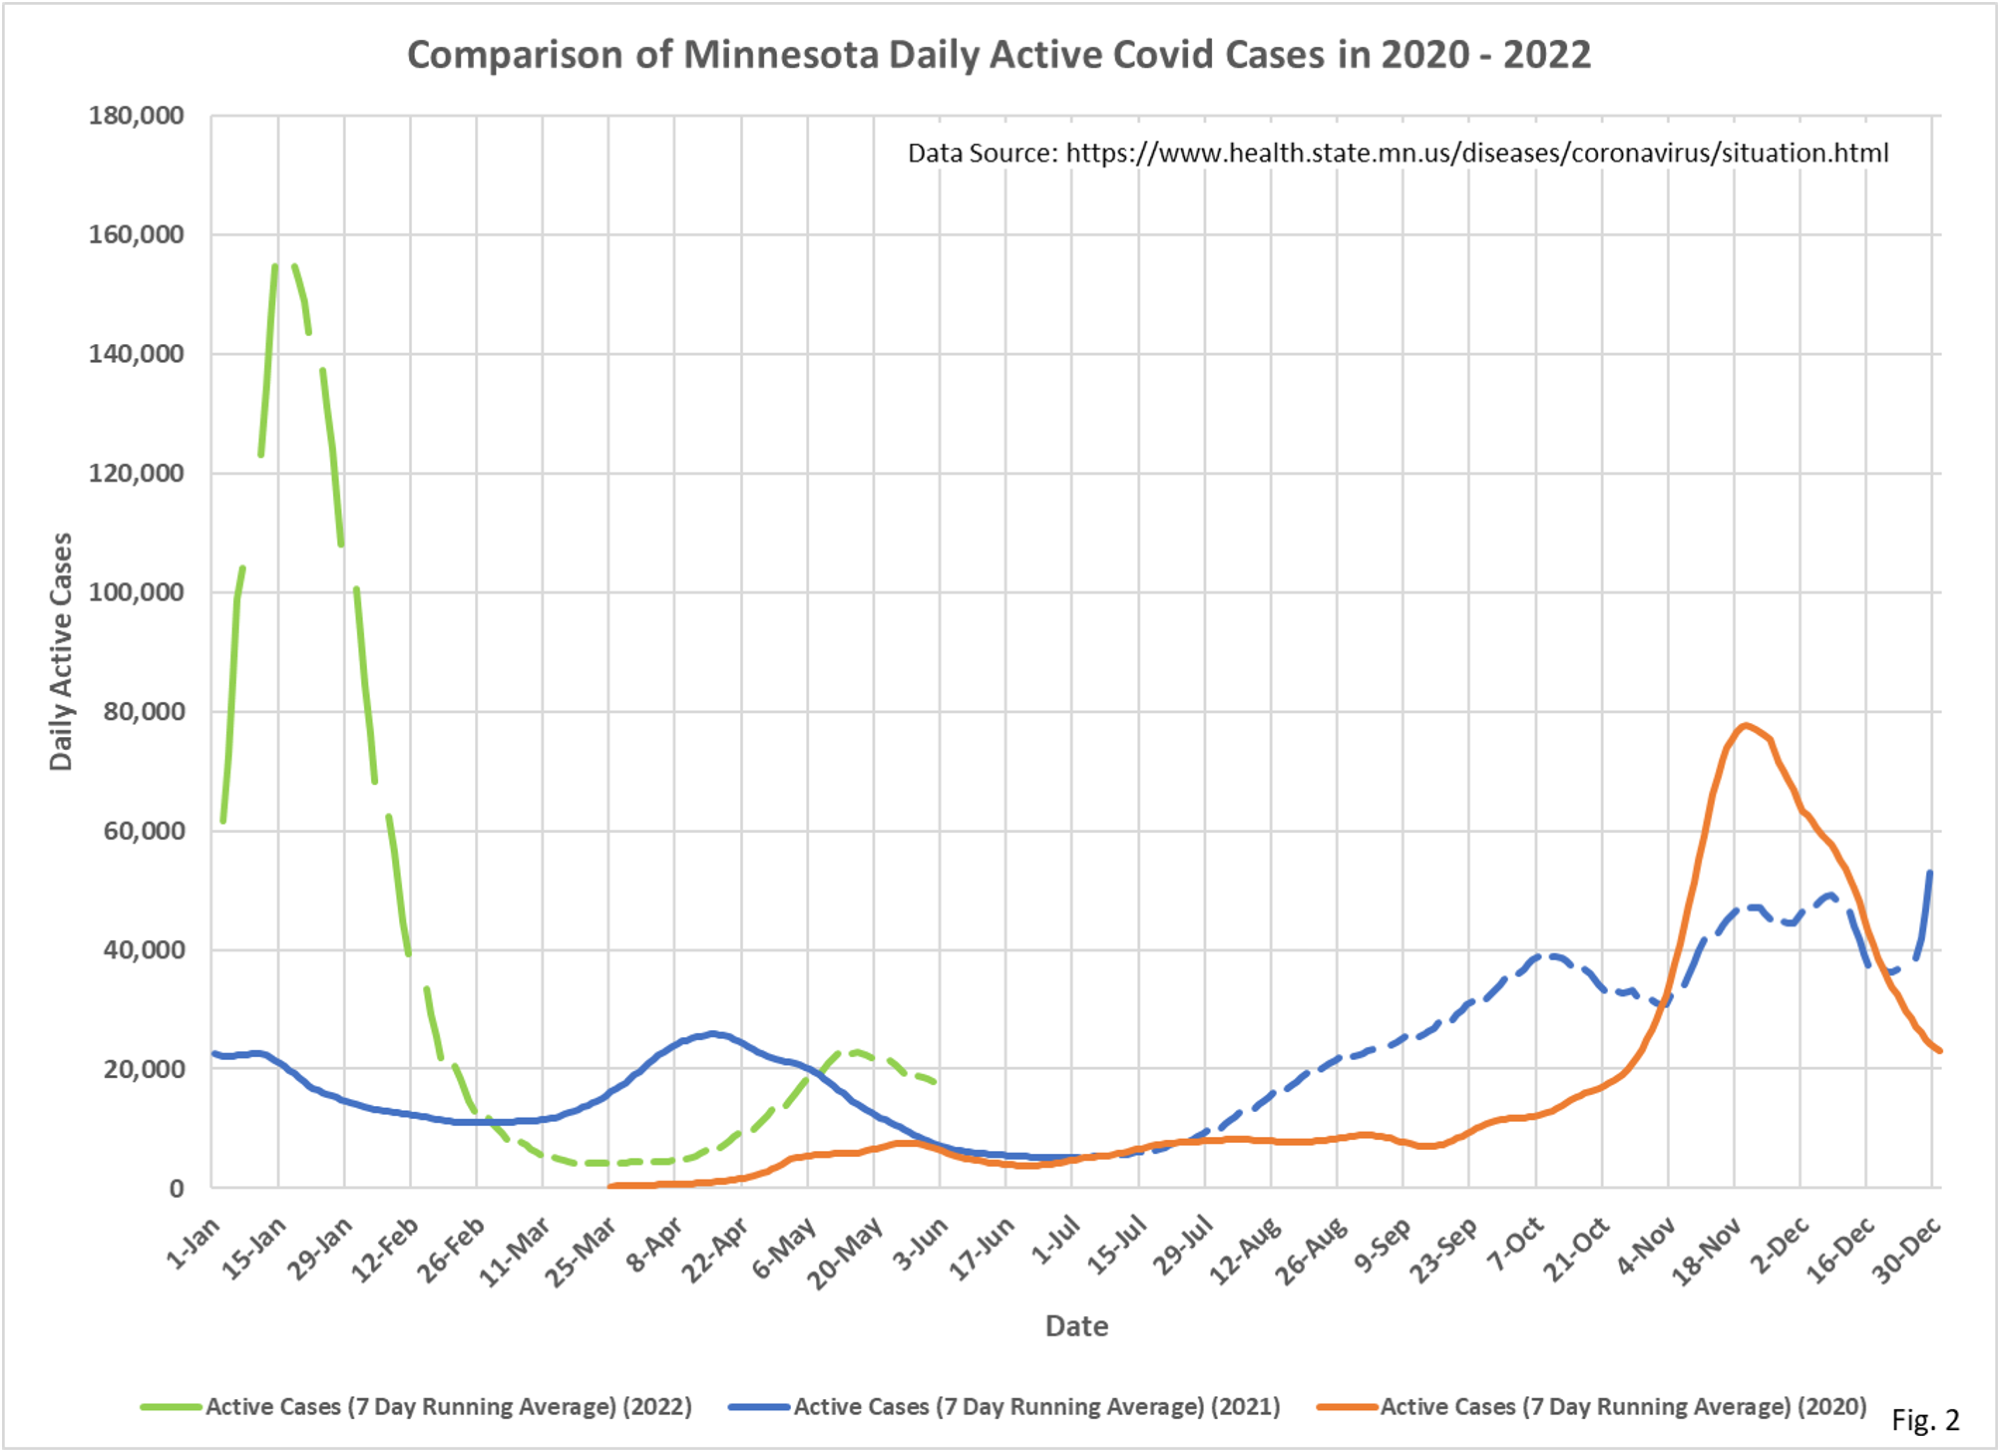
- Fig. 2: Active cases peaked at 22,720 active cases on 5/17/2022.
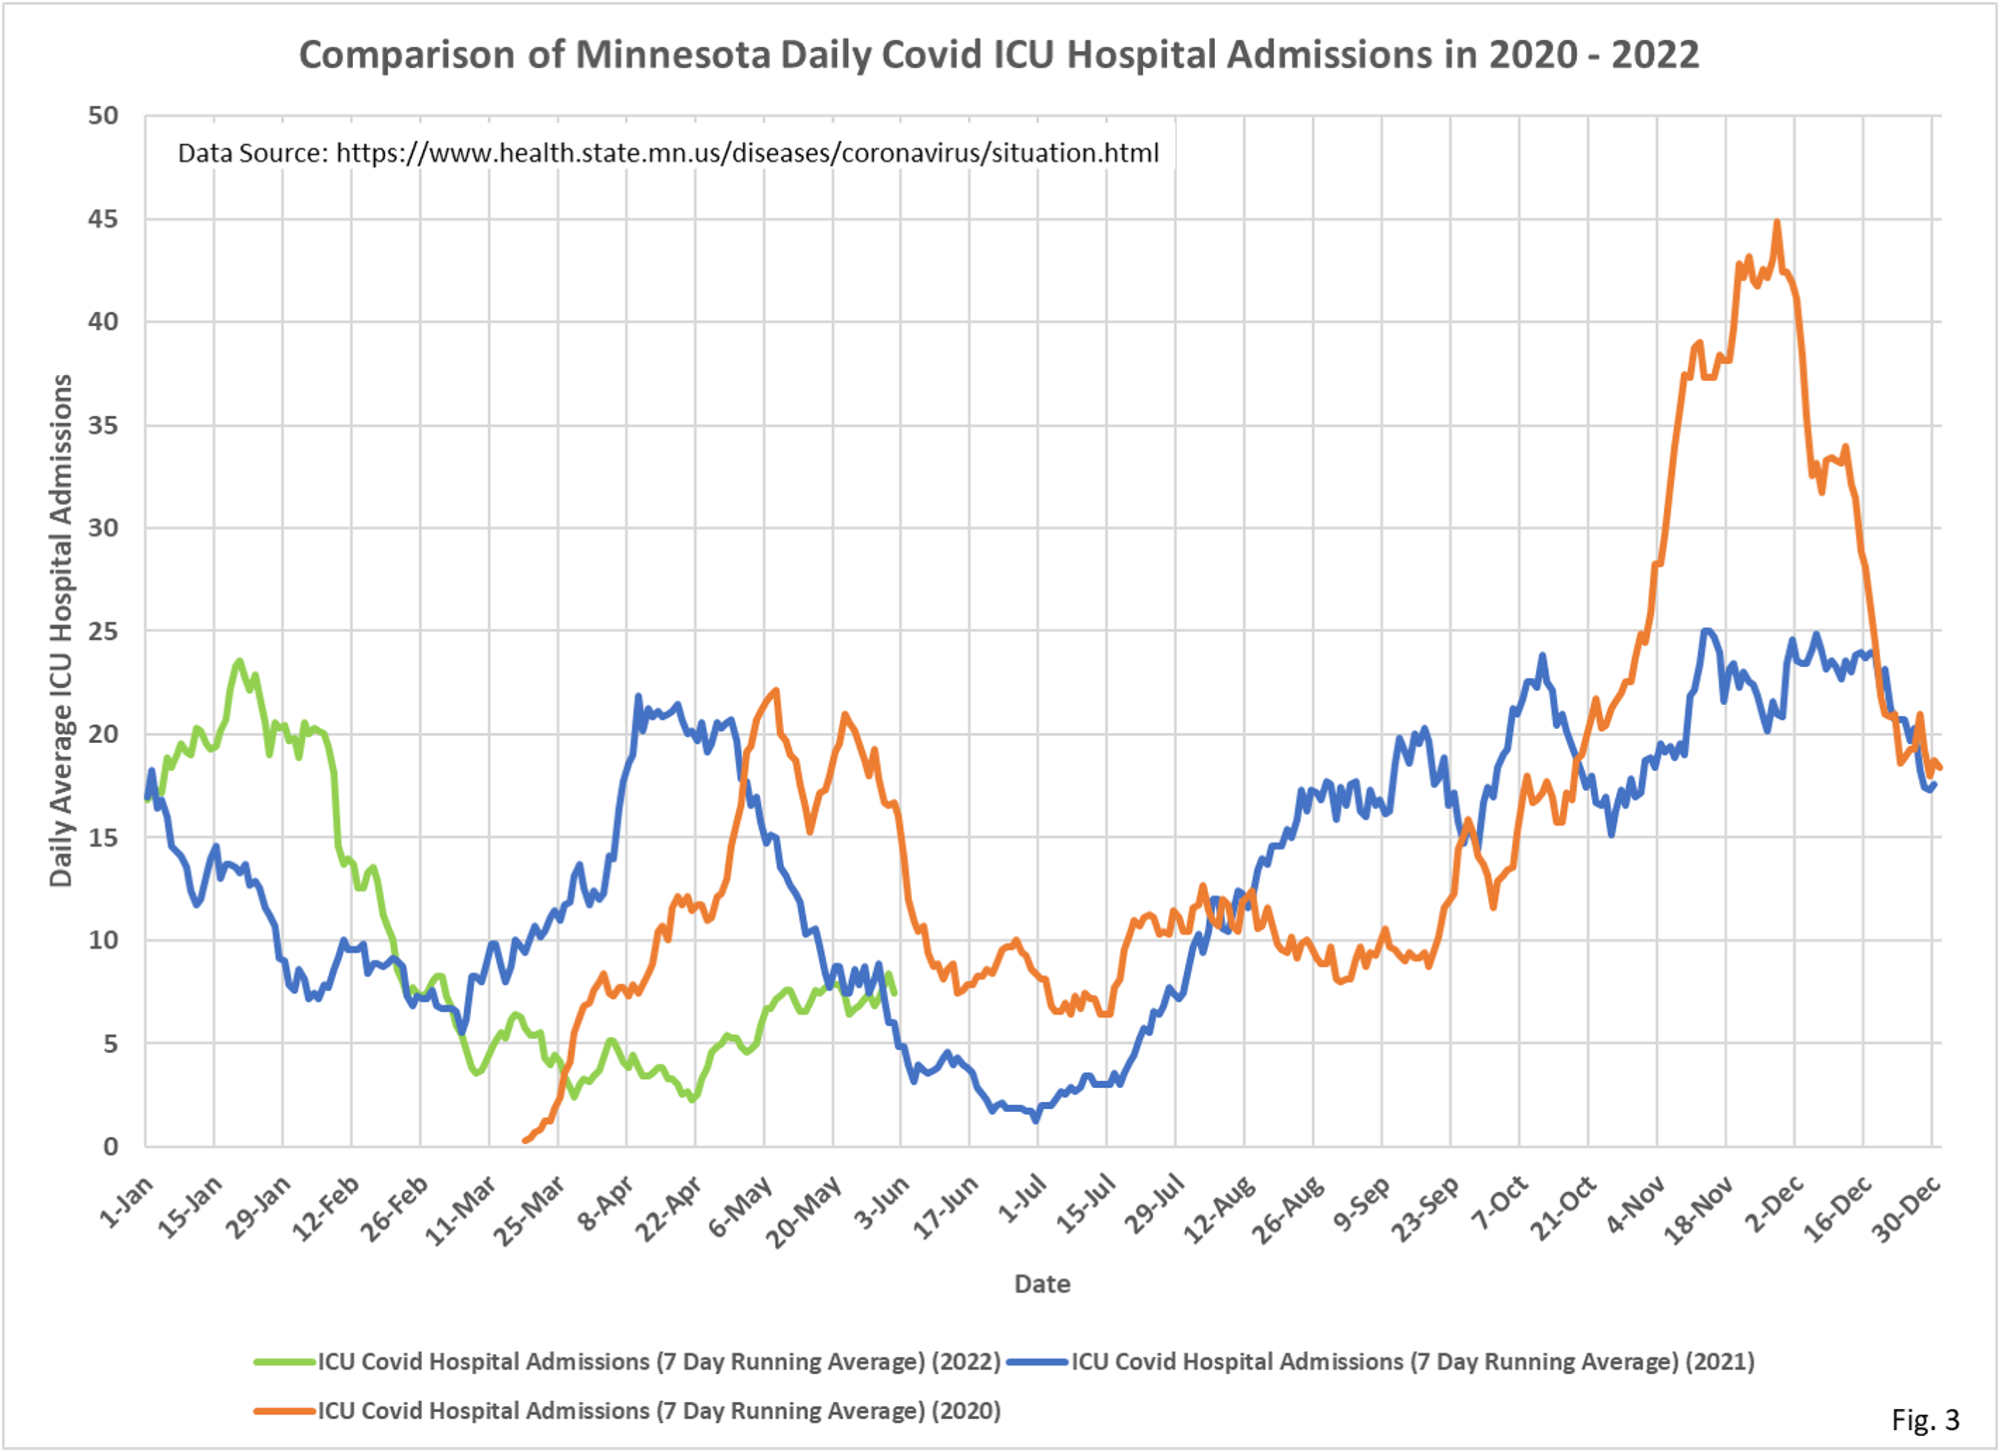
- Fig. 3: Covid ICU admissions achieved recent lows of 2.3 average admissions per day on 3/22/2022 and since have risen to 8.4 admissions per day on 6/01/2022.
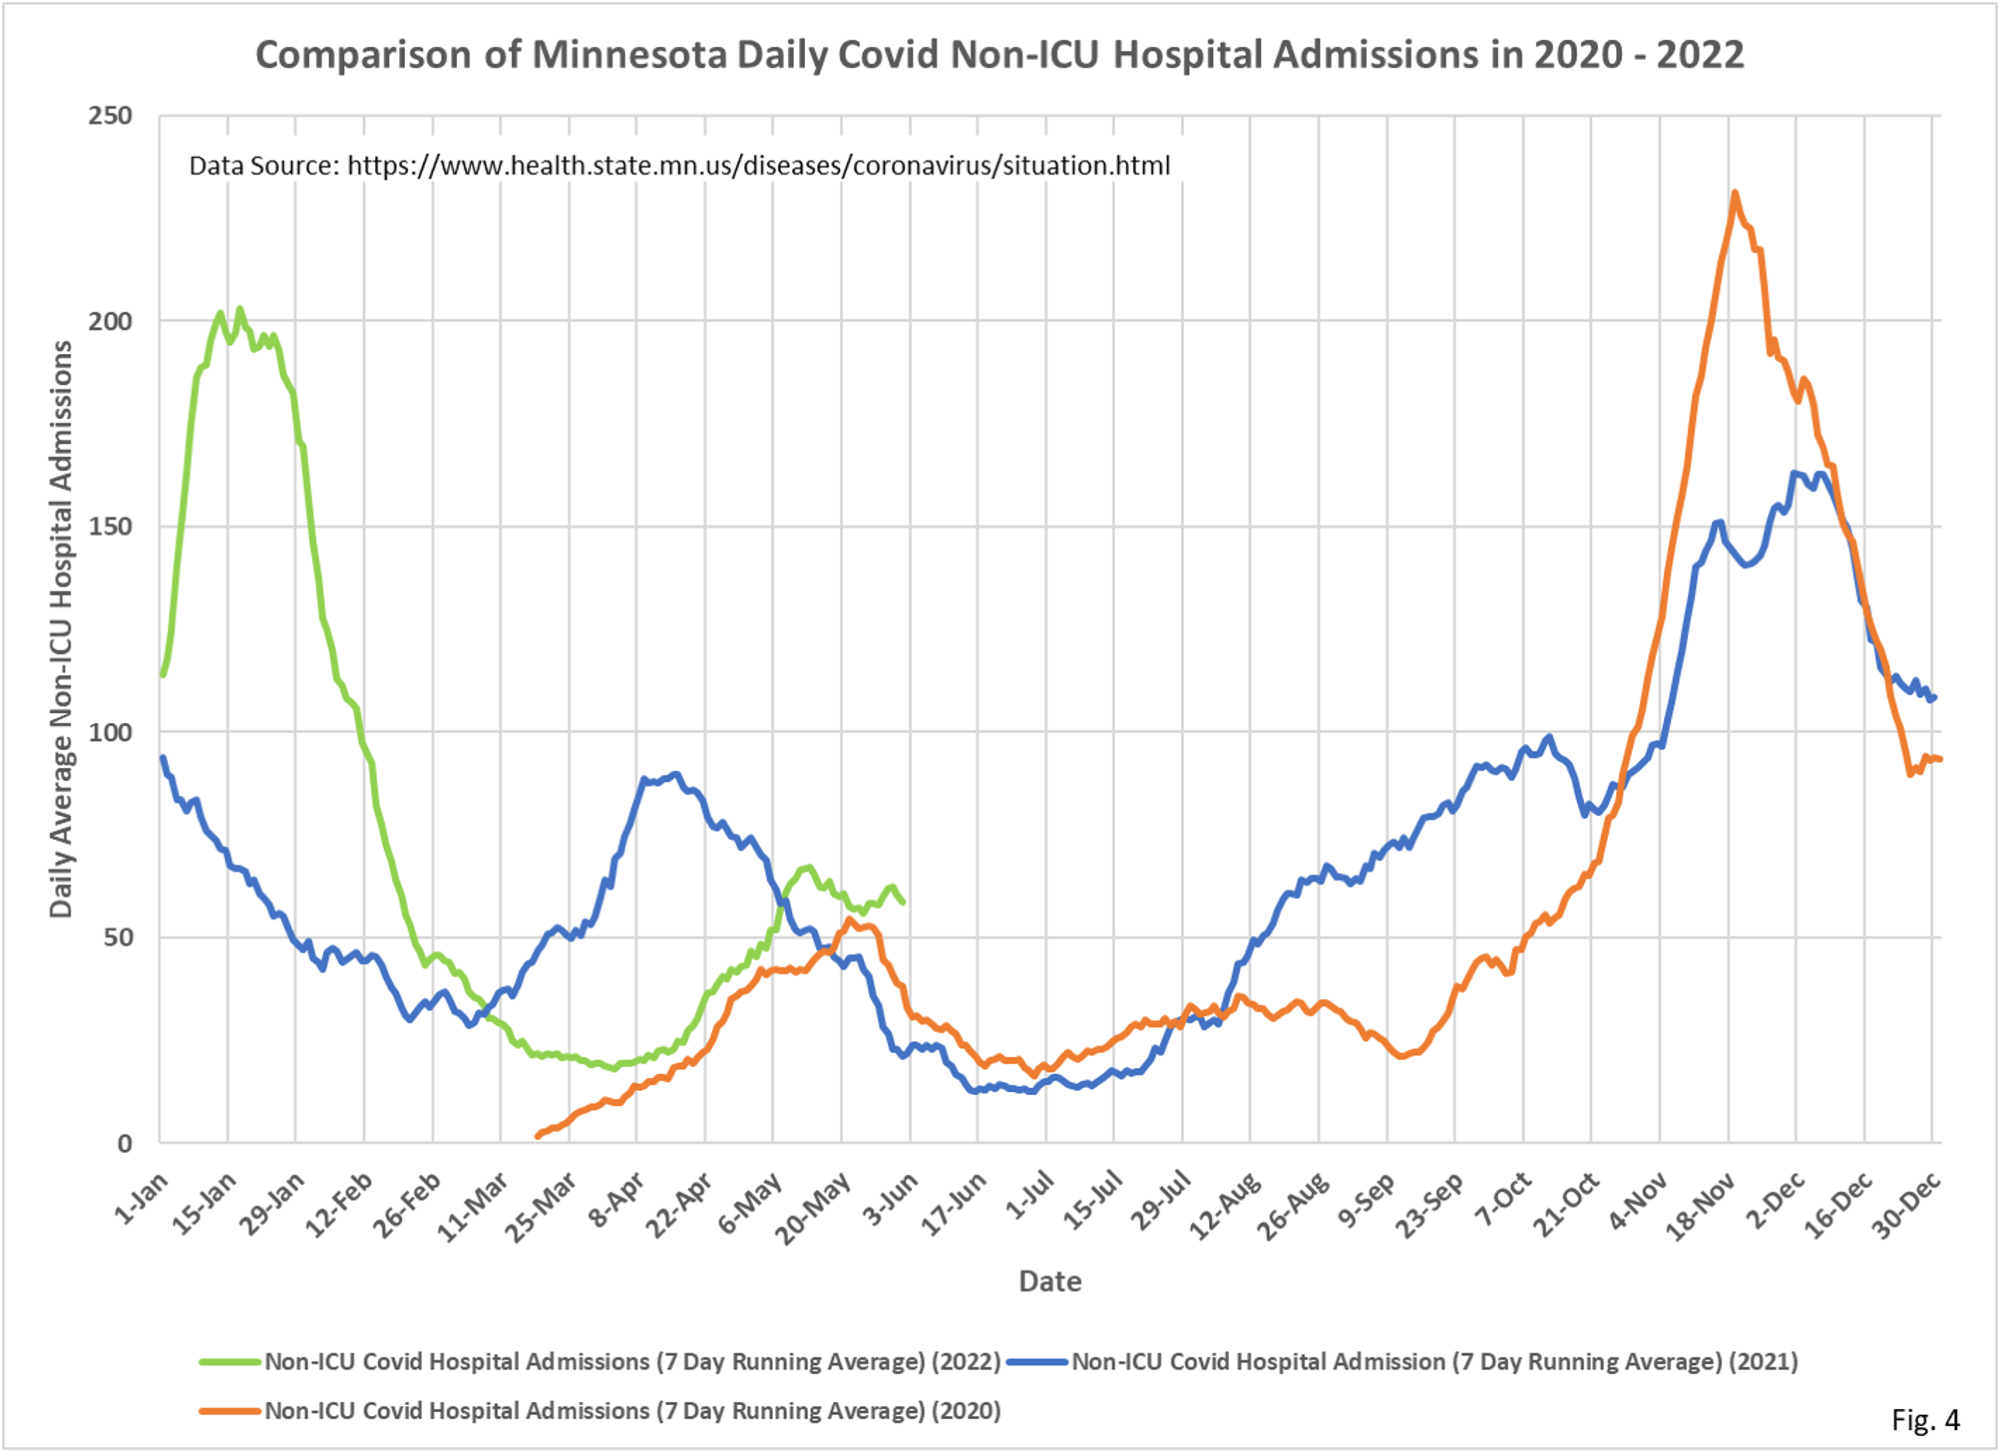
- Fig. 4: Covid Non-ICU admissions have hopefully peaked at 67.3 admissions per day on 5/14/2022, and have slowly drifted lower since then.
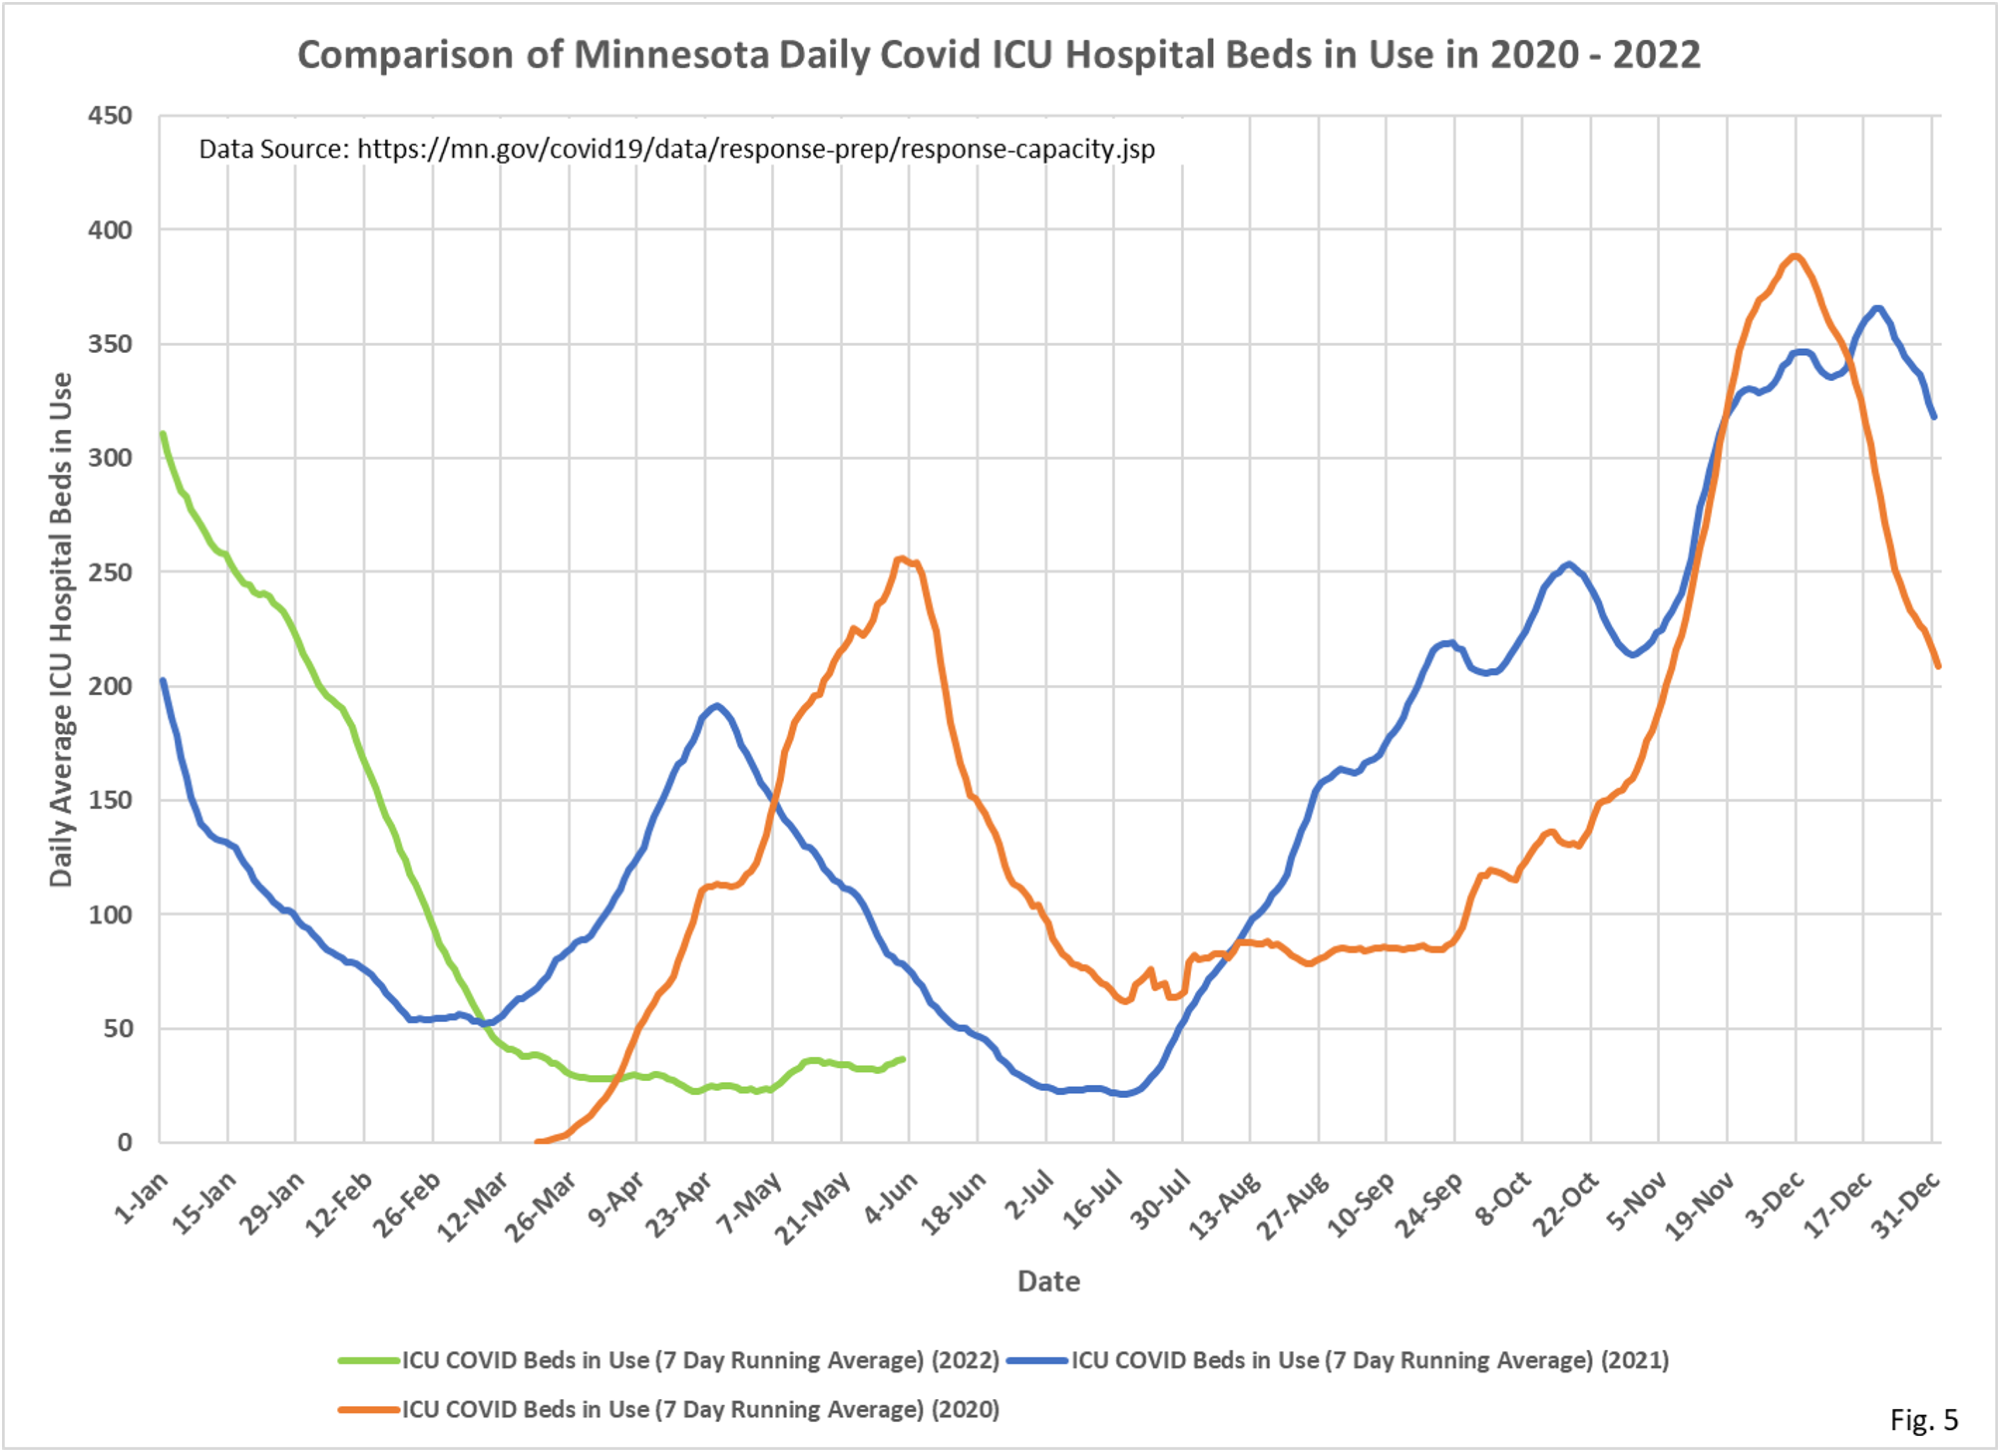
- Fig. 5: ICU Covid hospital beds have stayed quite level during the recent surge in cases, most recently at 36.9 average daily ICU beds in use for Covid patients.
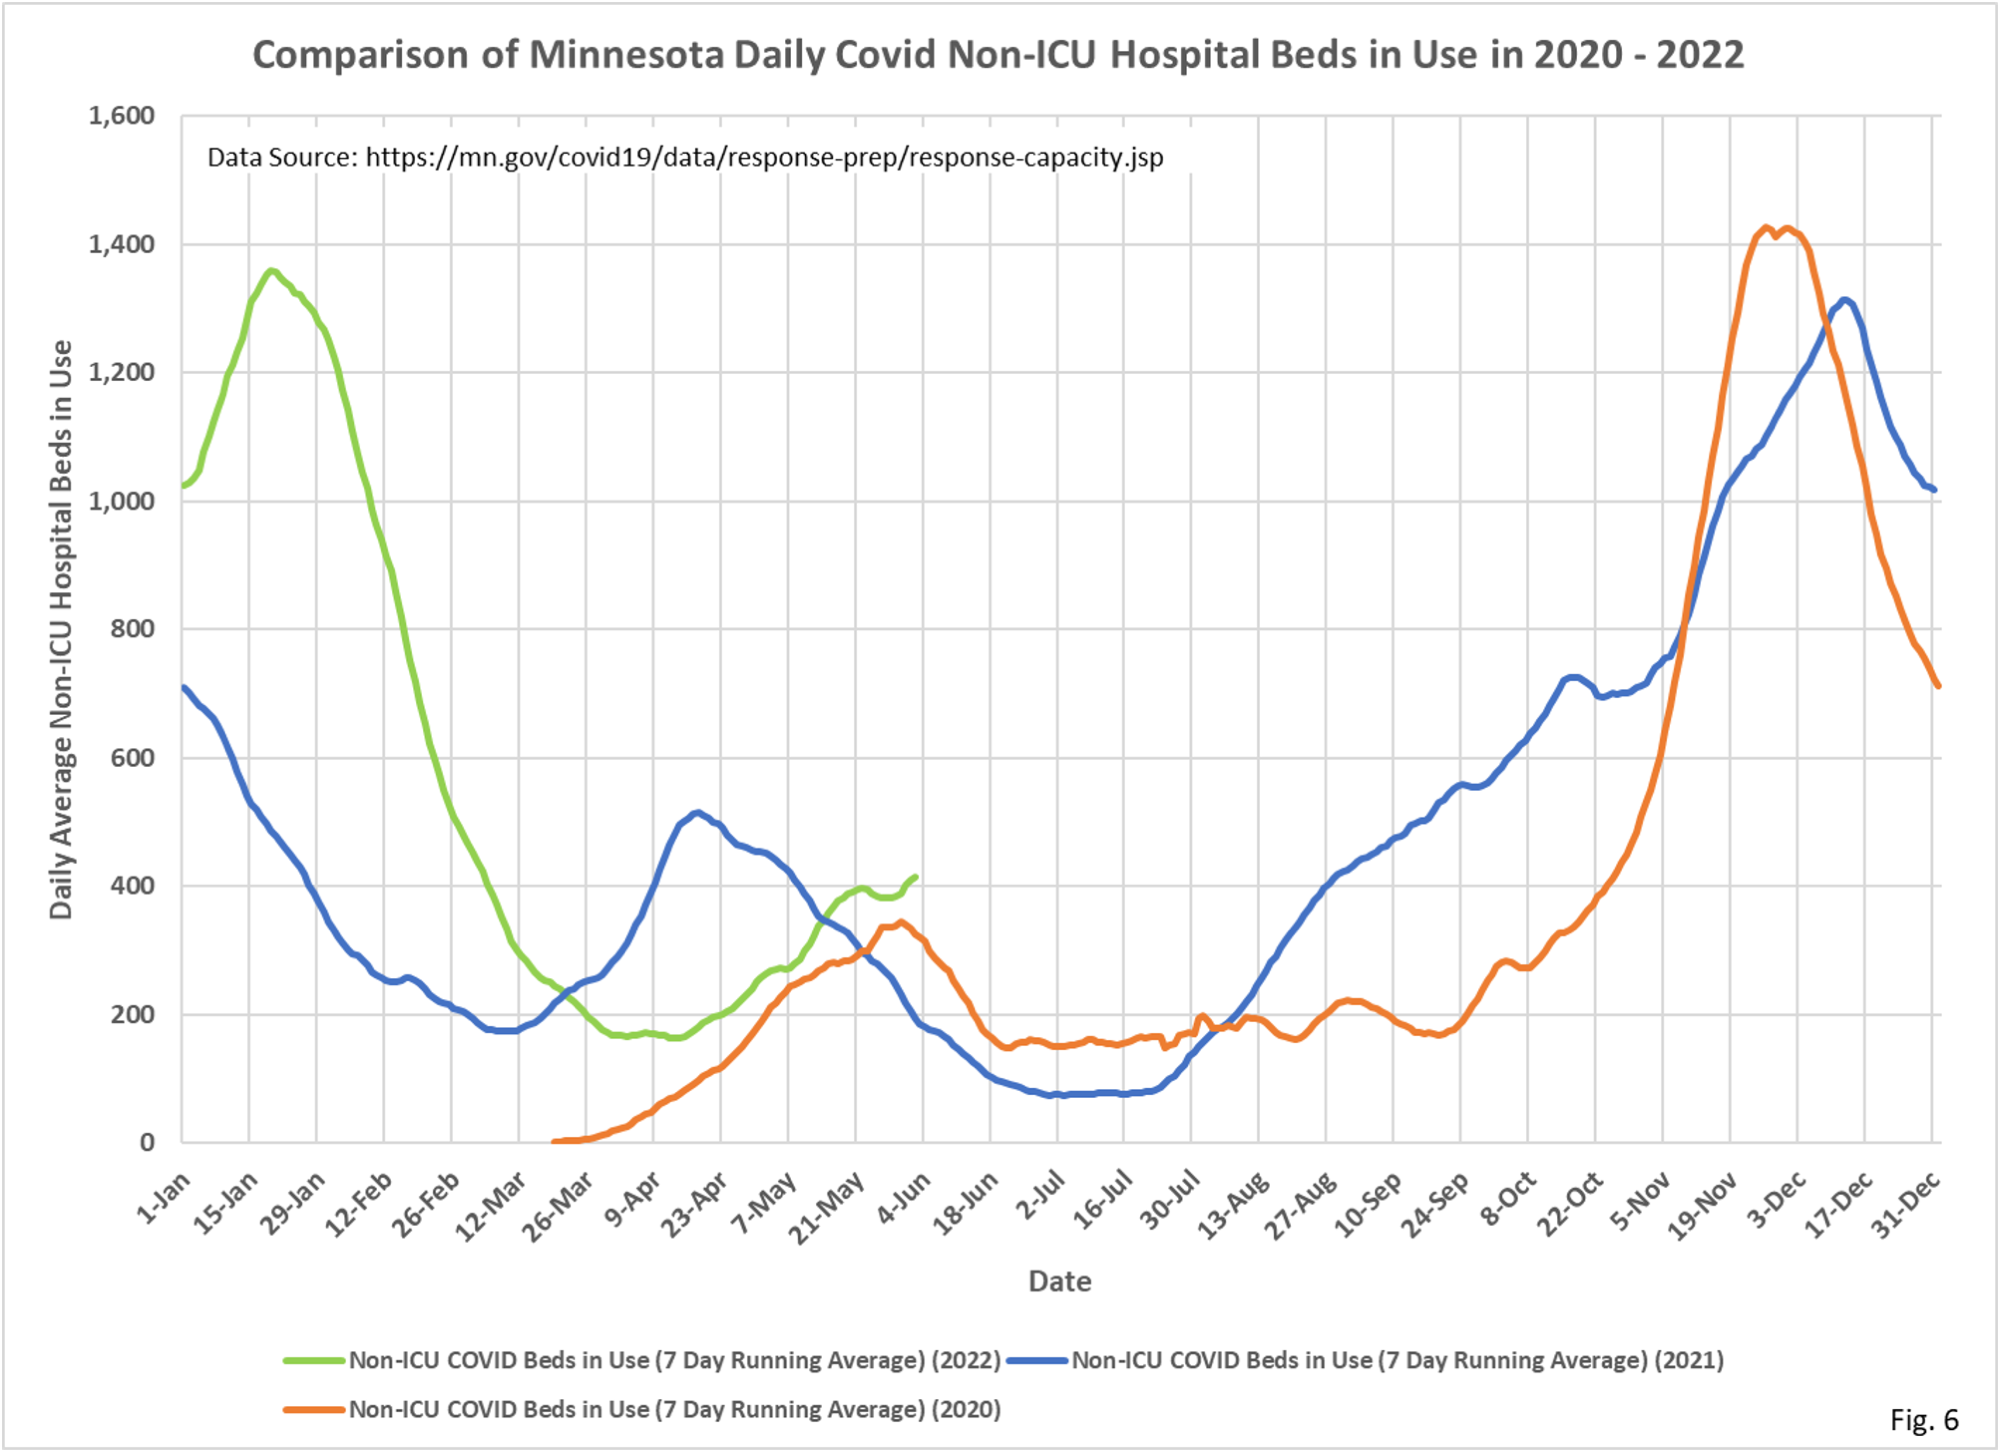
- Fig. 6: Non-ICU Covid hospital beds in use still have hit an obvious peak, most recently at 413.7 average daily beds in use.
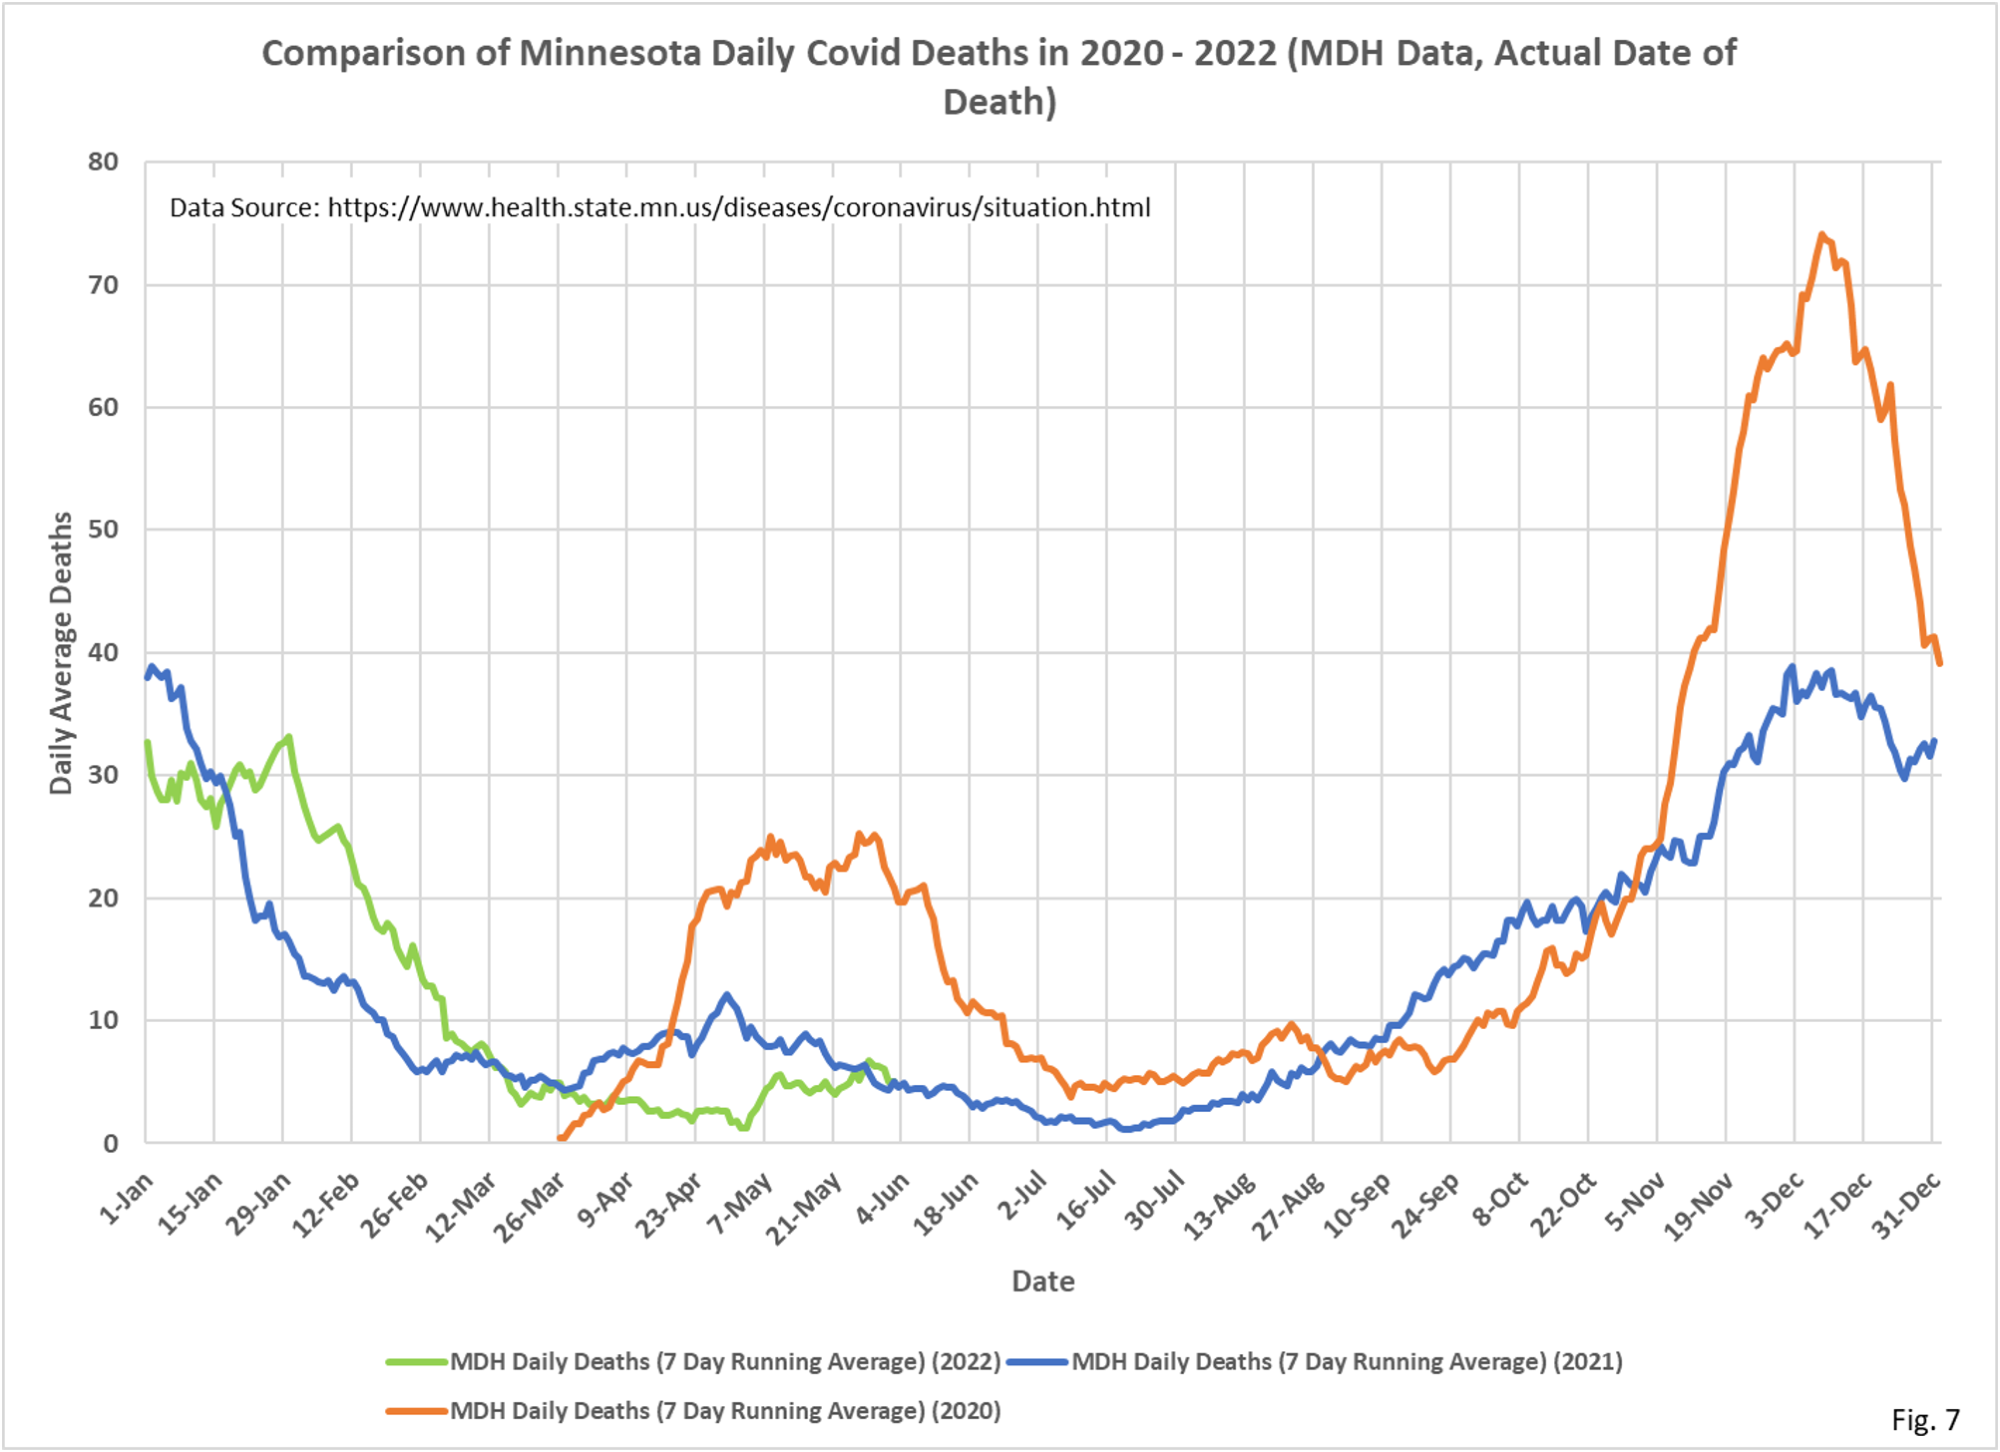
- Fig. 7: Deaths attributed to Covid continue to gradually increase, with hopefully the peak occurring on 5/26/2022 at 5.9 deaths per day.
- For all charts the last 7 days of data is excluded to avoid charting incomplete data.
- All data is taken from the Minnesota Department of Health Situation Update for OCVID-19 web page https://www.health.state.mn.
us/diseases/coronavirus/ situation.html and from the Response and Preparation web page https://mn.gov/covid19/data/ response-prep/response- capacity.jsp. - All data is shown as 7 day running averages.
