These charts by Dave Dixon are based on the weekly report put out by the state and show for the entire epidemic what events happen in which age groups.
 Dave’s notes:
- Overall, Covid cases are now well past peak (although last week’s sharp reported decrease in cases was revised into a modest decline in cases), while ICU and non-ICU admissions and deaths are perhaps at or near their peak.
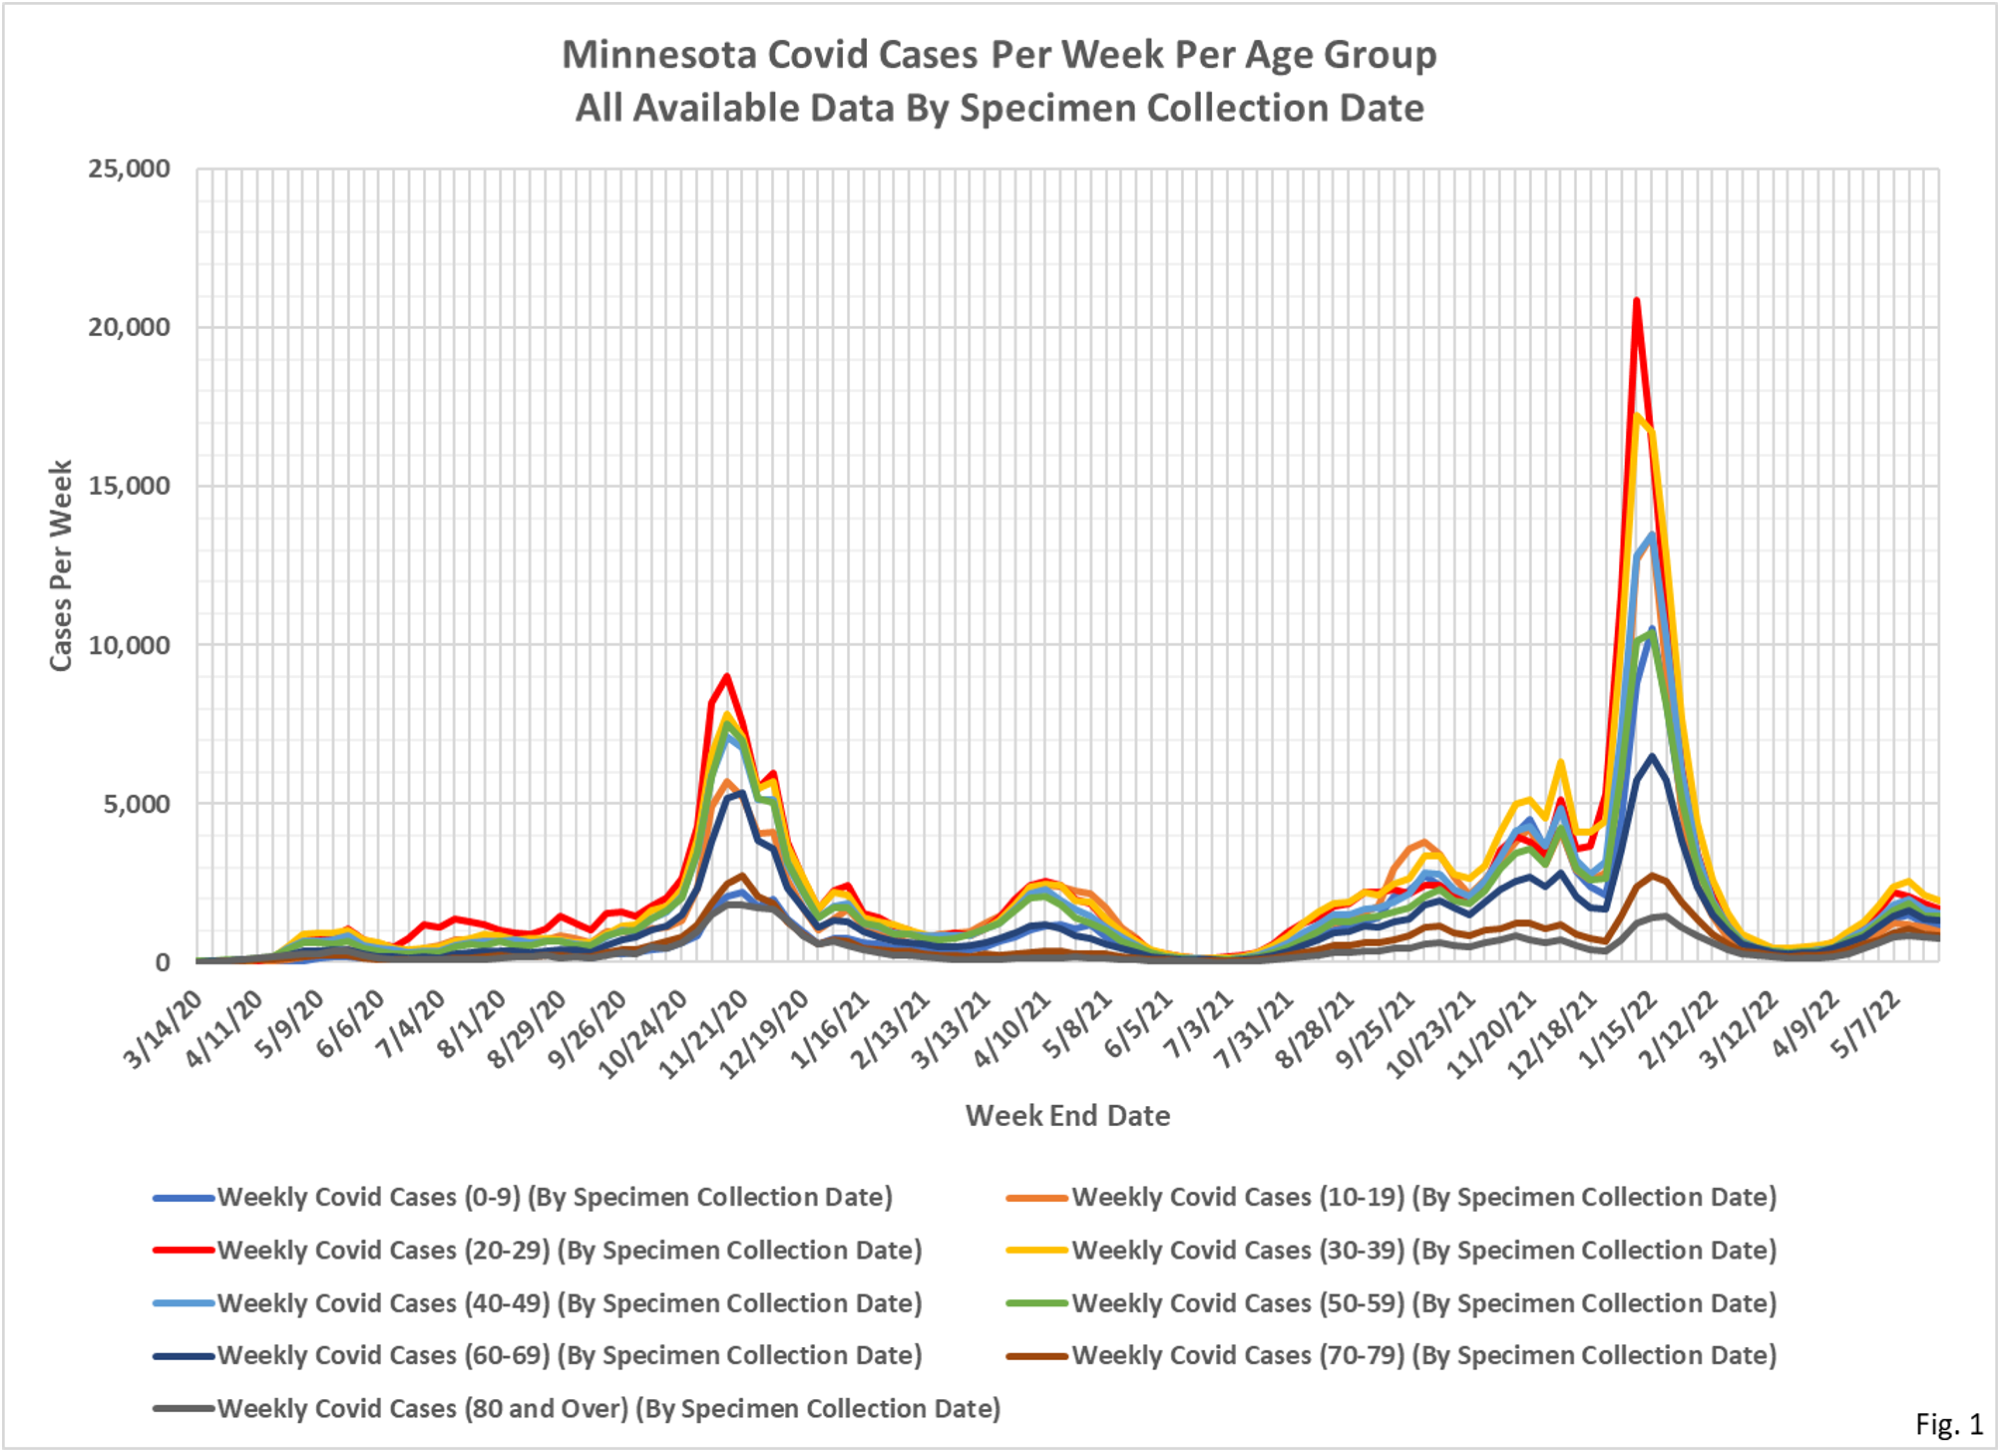
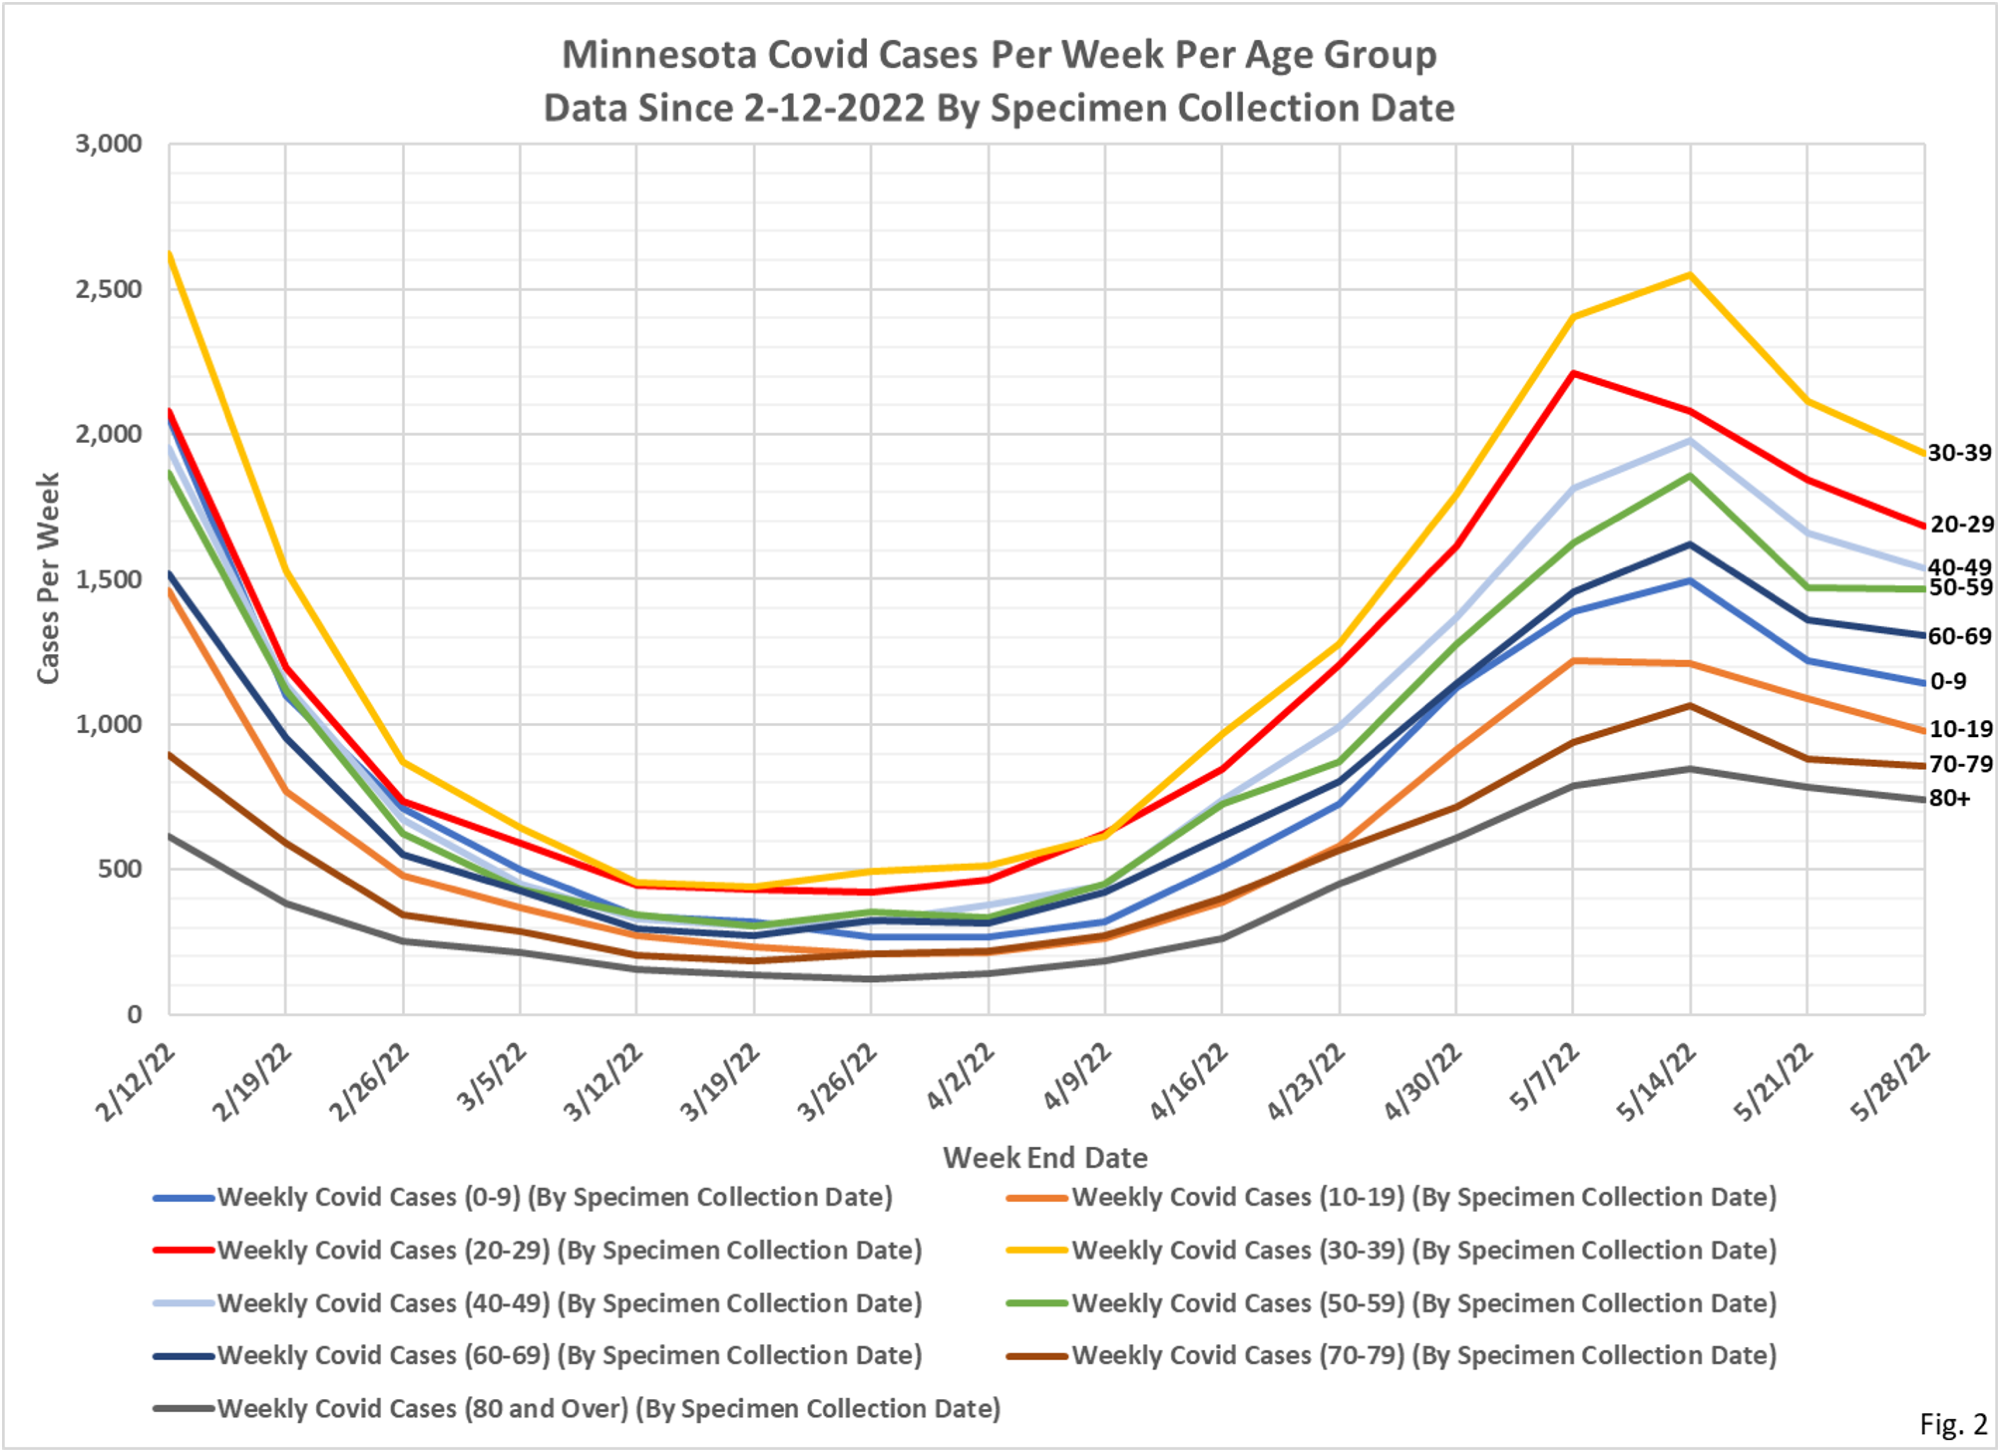
- Fig. 1 and 2: Covid Cases Per Week. The reported Covid cases this week are moderately lower for all age groups, for the second week in a row. Total reported cases for the week were 11,642 total for all age groups, down from 12,417 revised cases reported last week (originally reported as 2,785), and 14,702 cases 2 weeks ago.
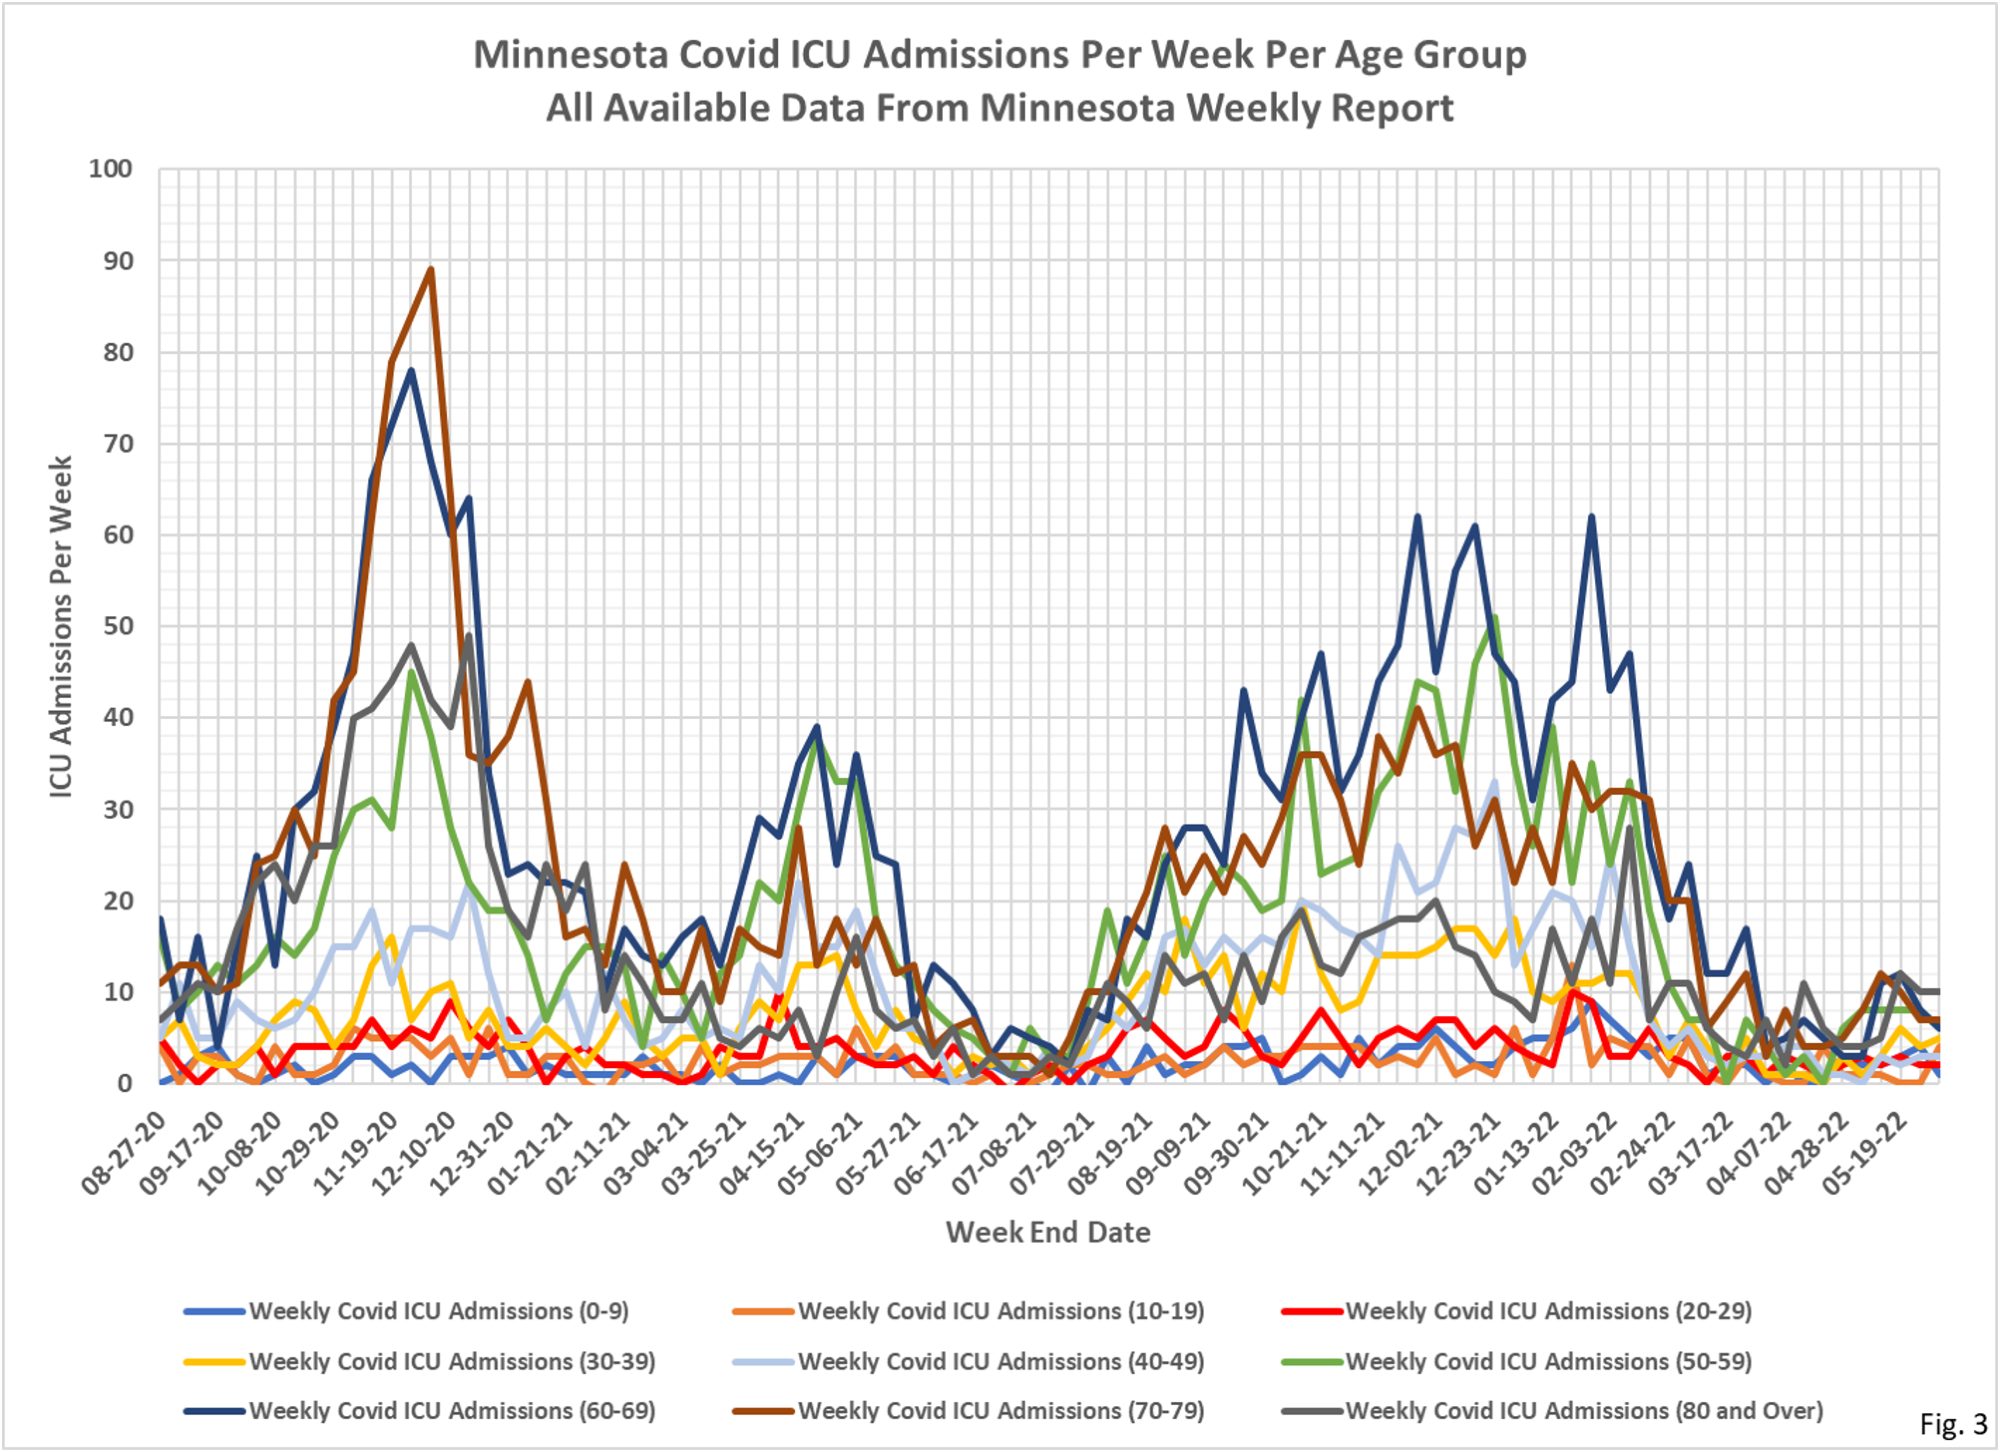
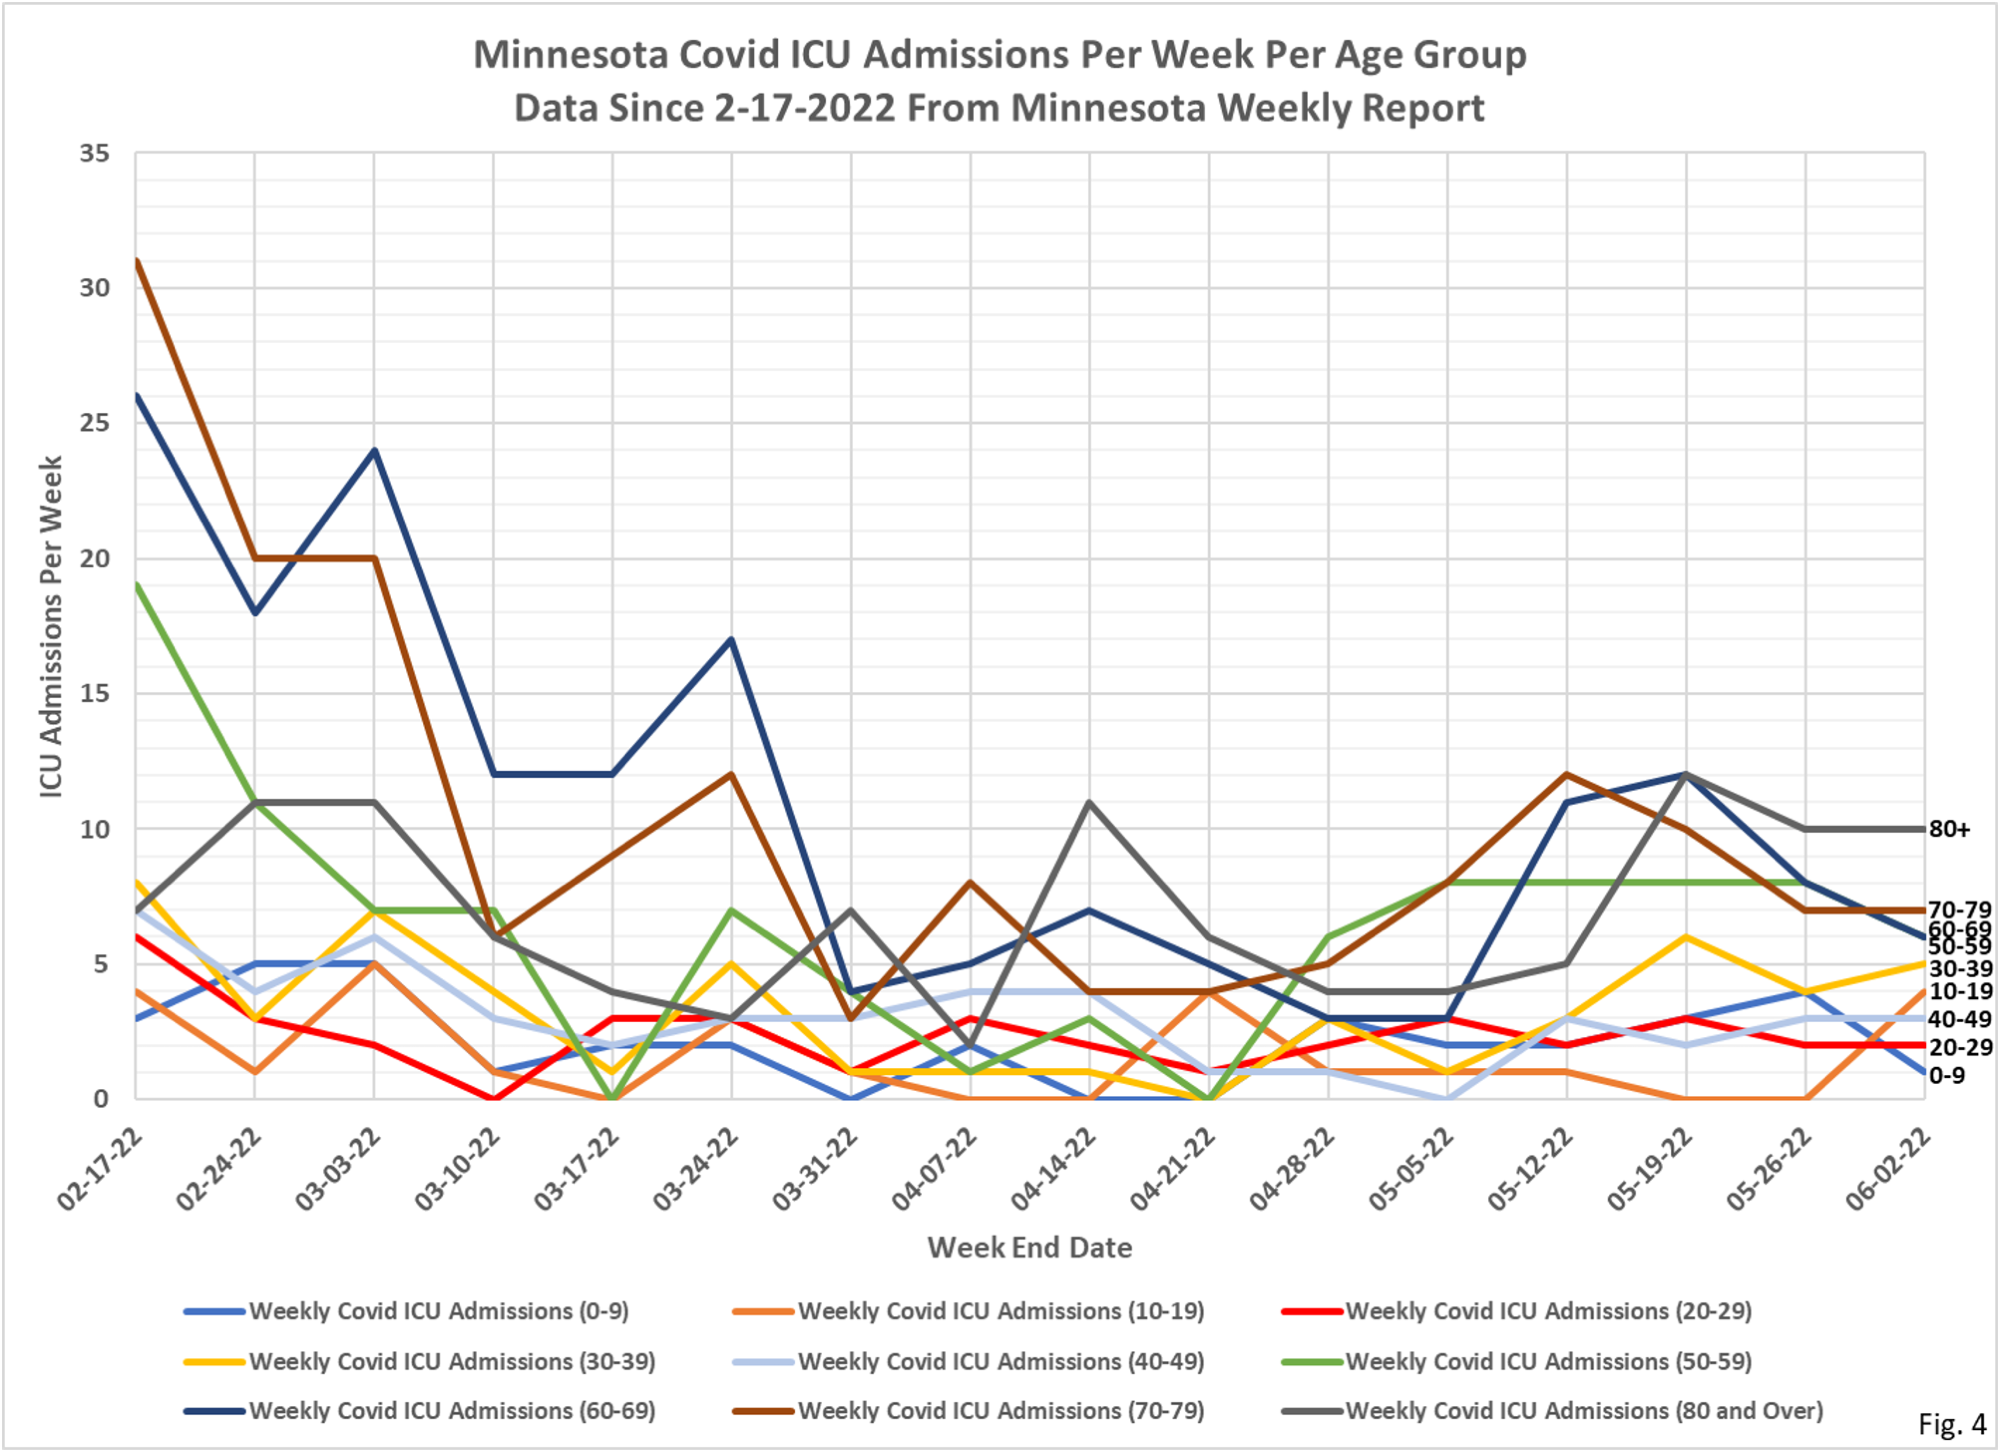
- Fig. 3 and 4: ICU Covid Admissions Per Week. Reported total ICU admissions for the week were 44, an decrease of 2 from the total of 46 admissions reported last week. The 10-19 and 30-39 age groups were higher, while all other age groups were flat or lower for the week.
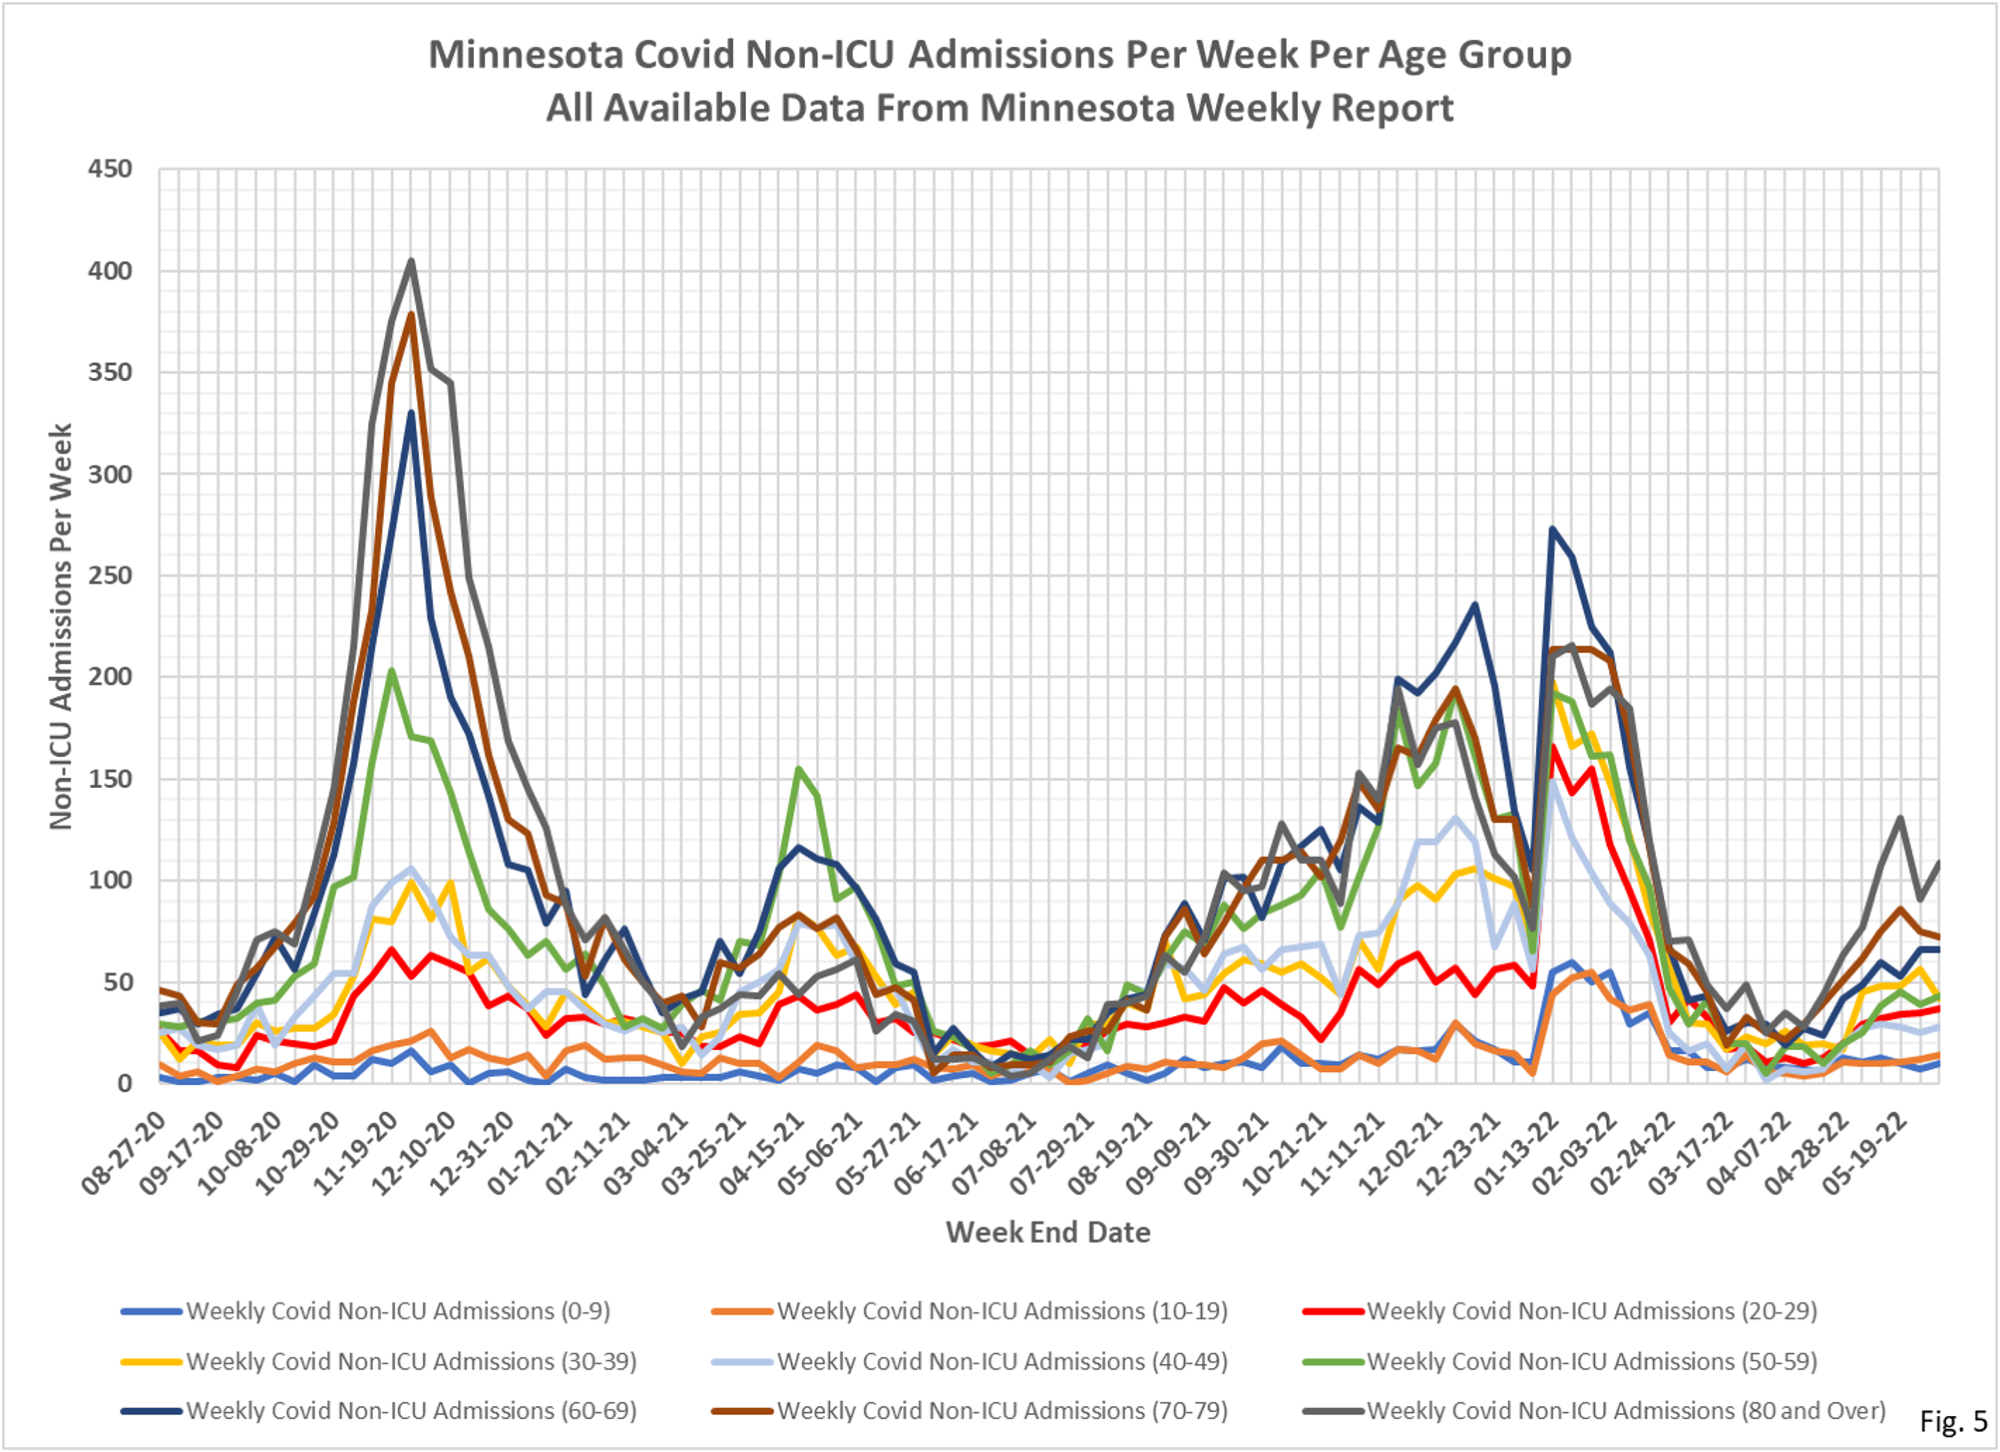
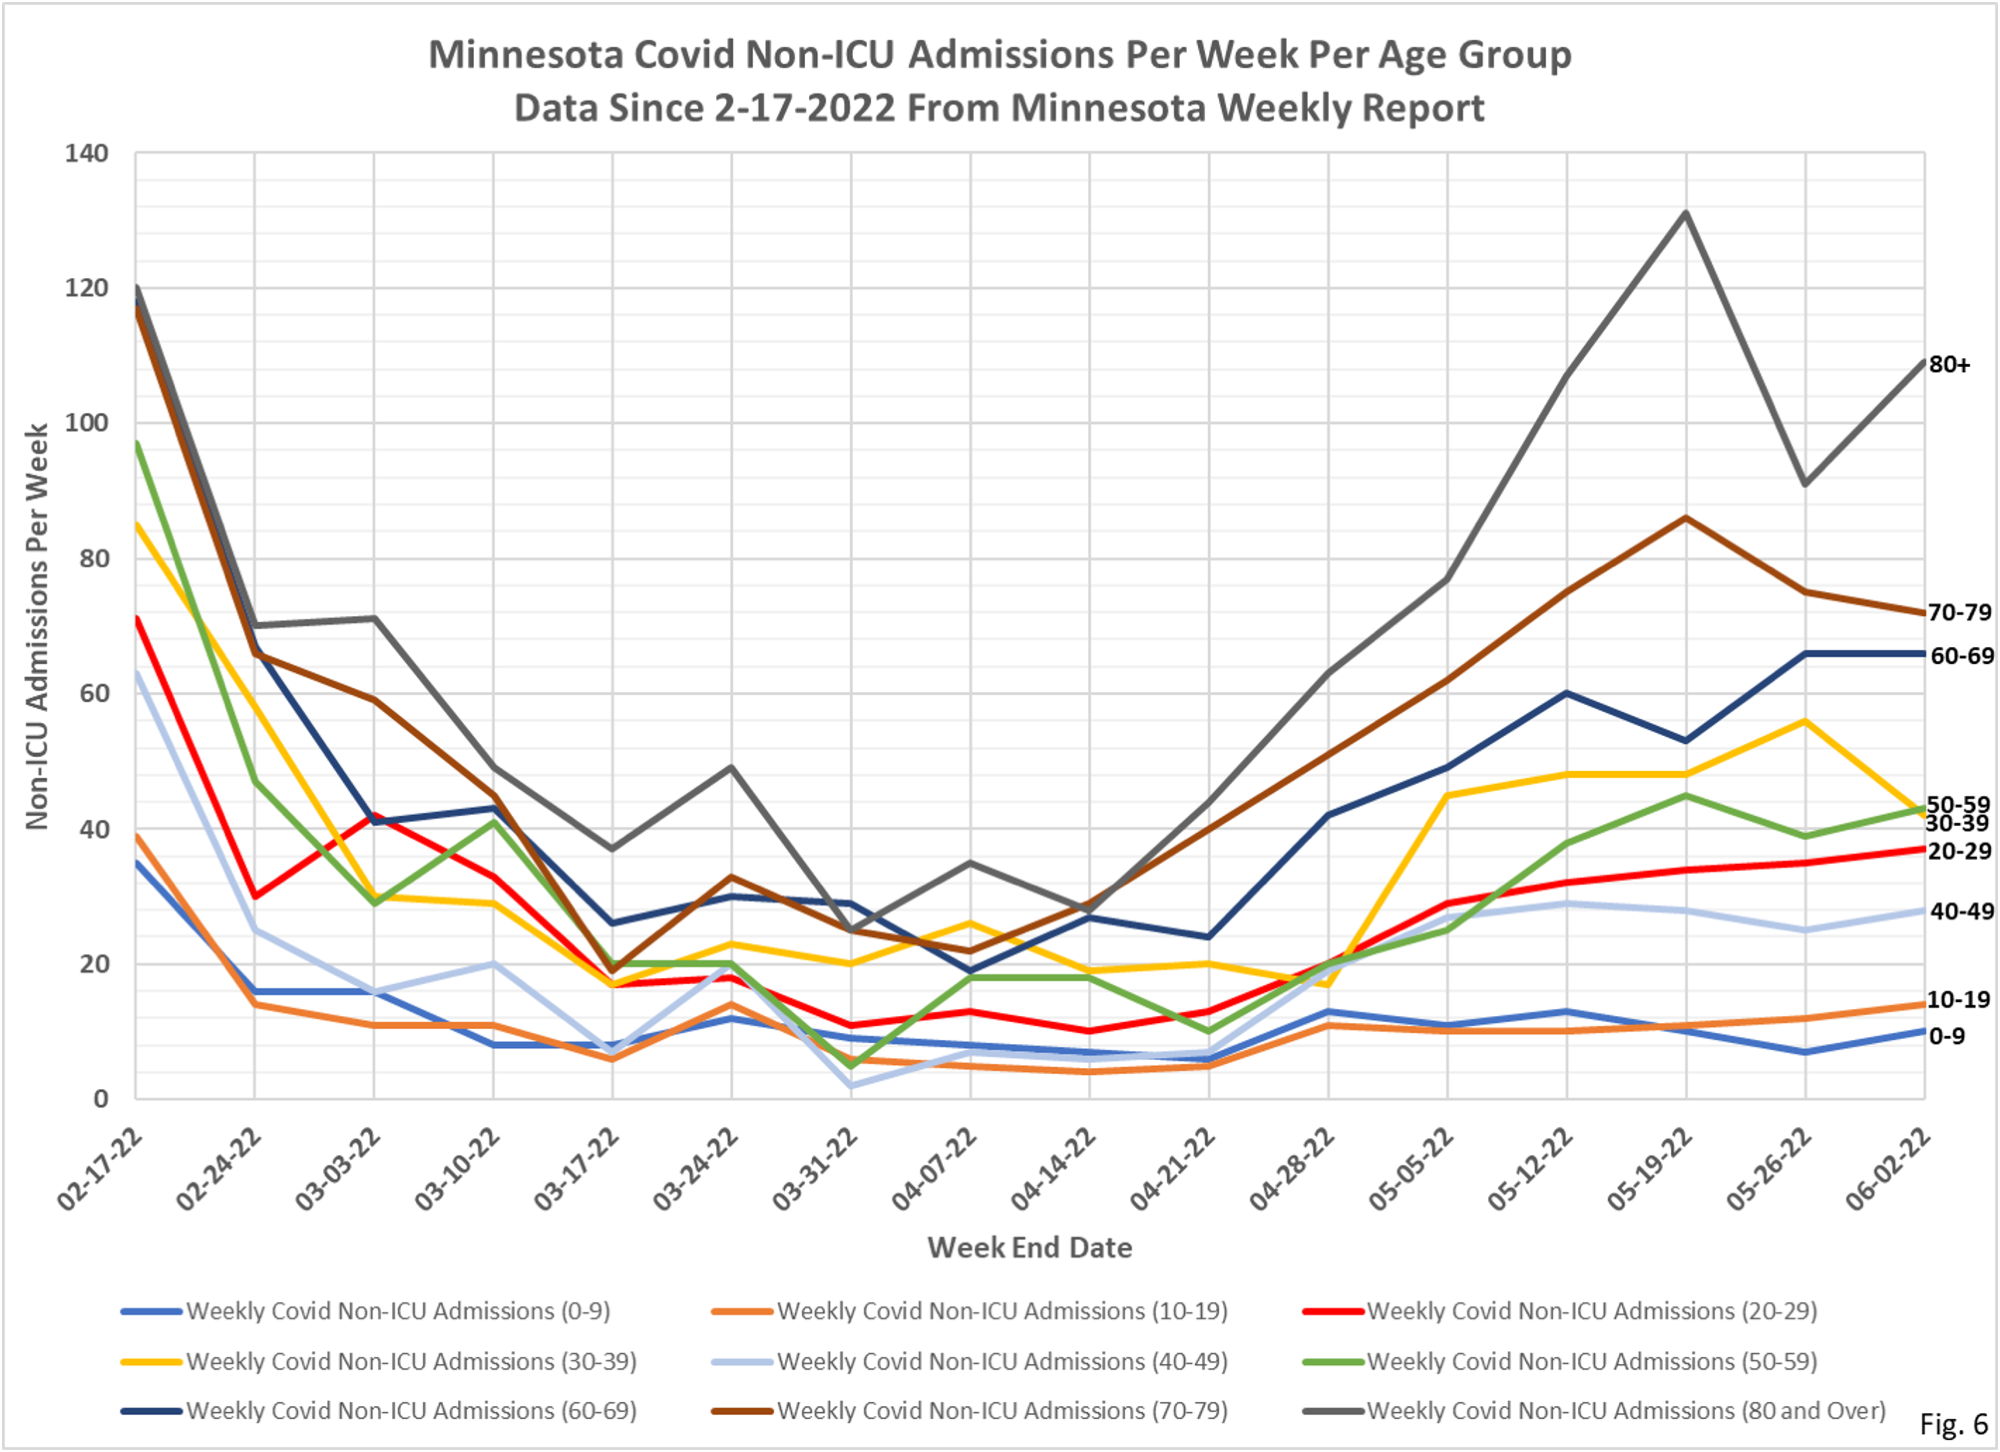
- Fig. 5 and 6: Non-ICU Covid Admissions Per Week. Reported total non-ICU admissions for the week were 421, up from 406 last week. Generally all groups were higher, especially the 80+ age group, while only the 50-59 and 70-79 age groups were lower.
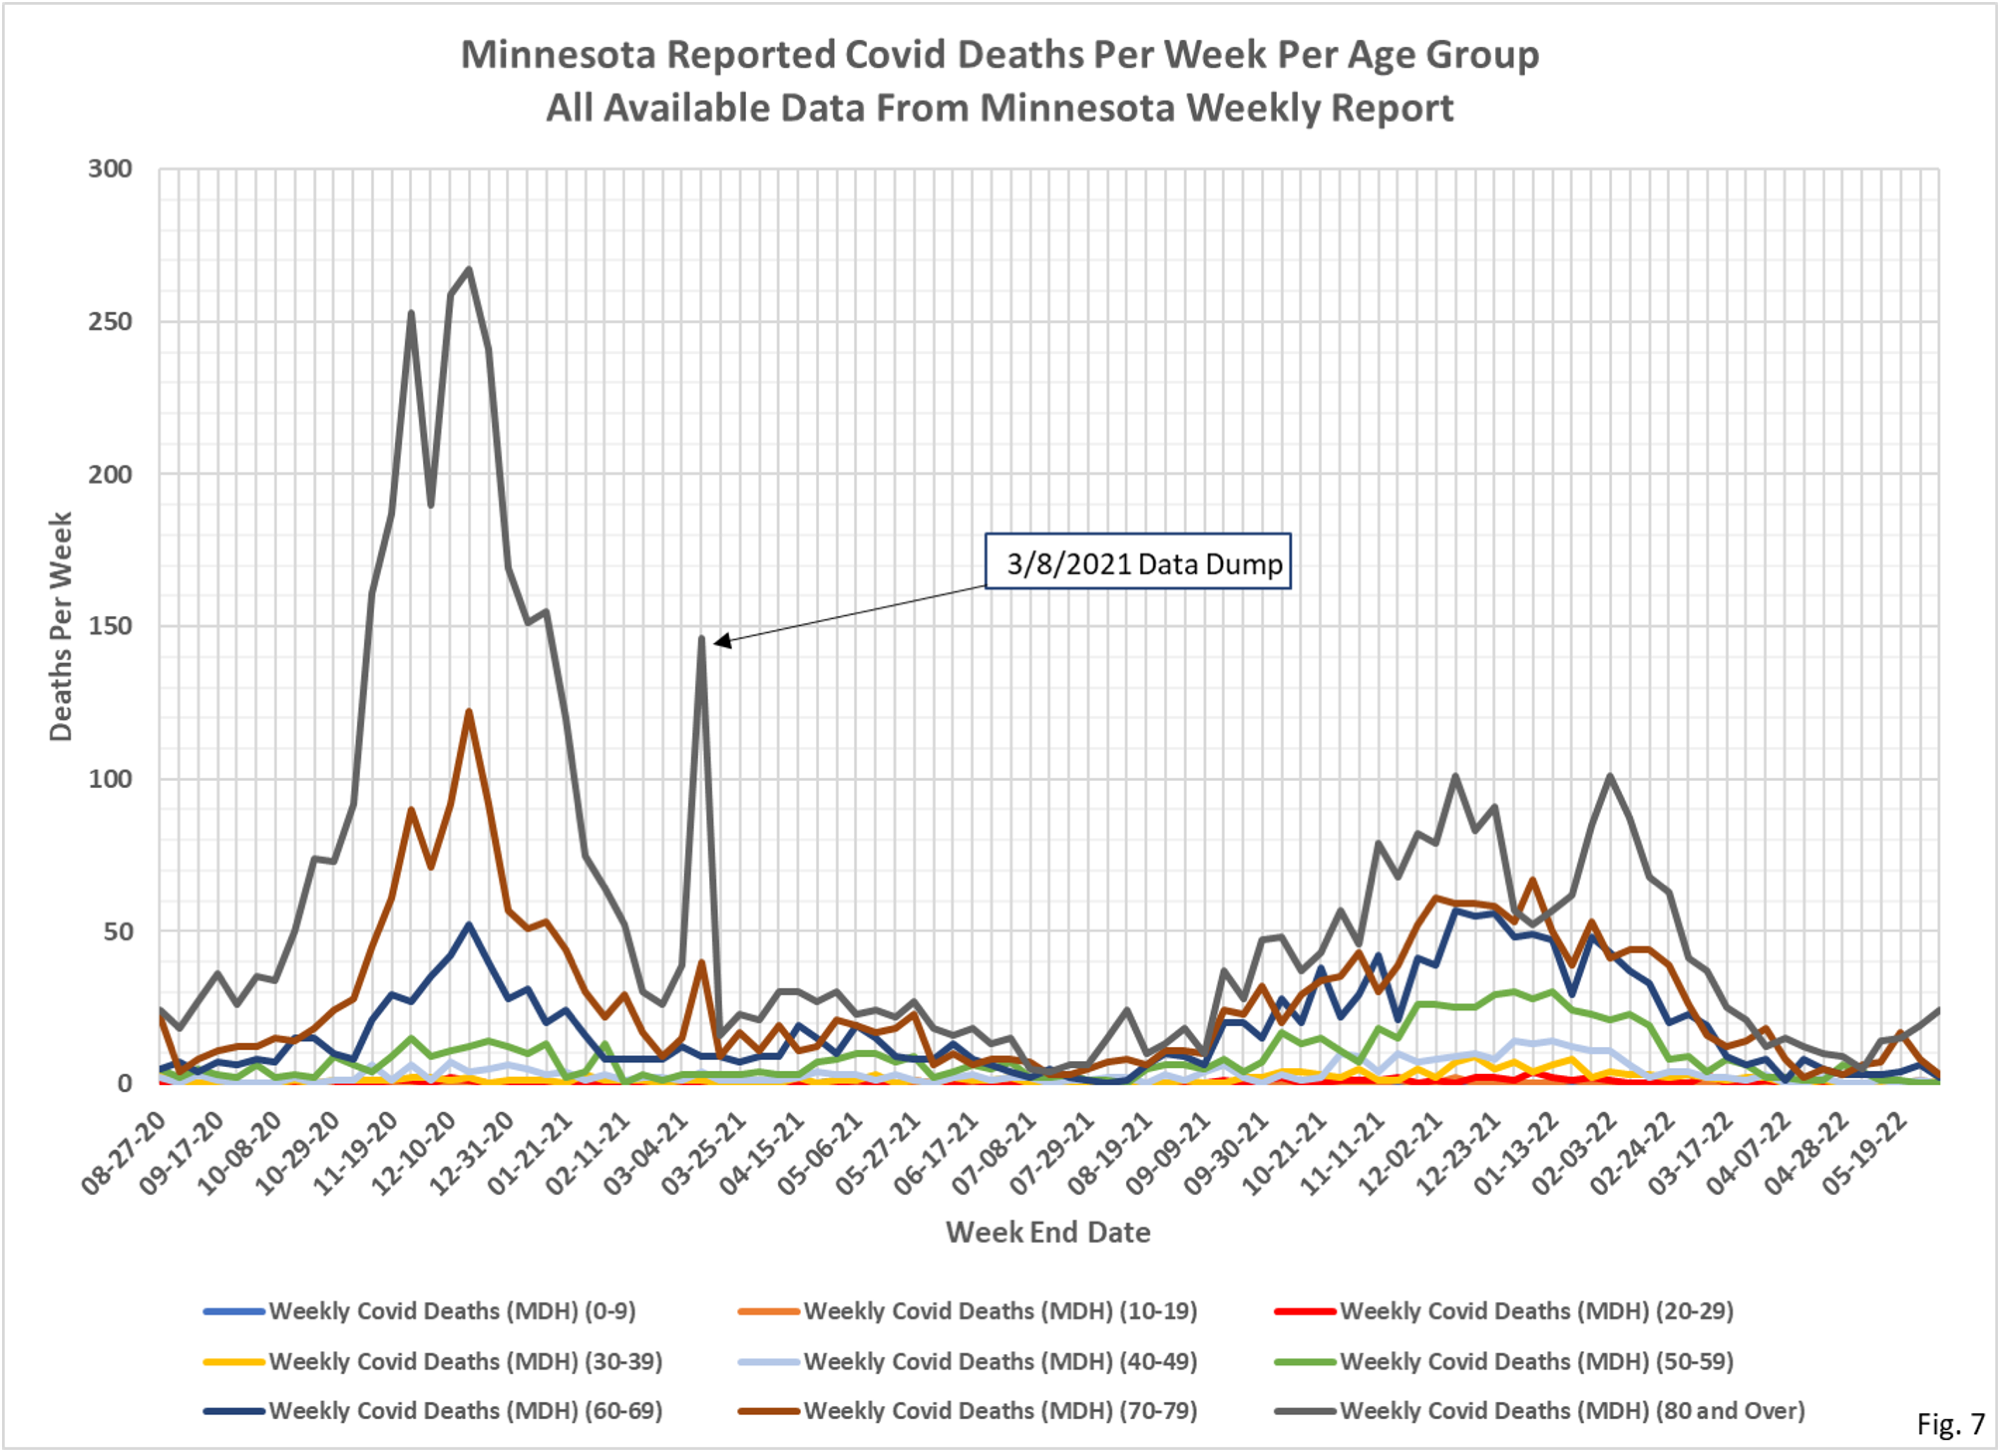
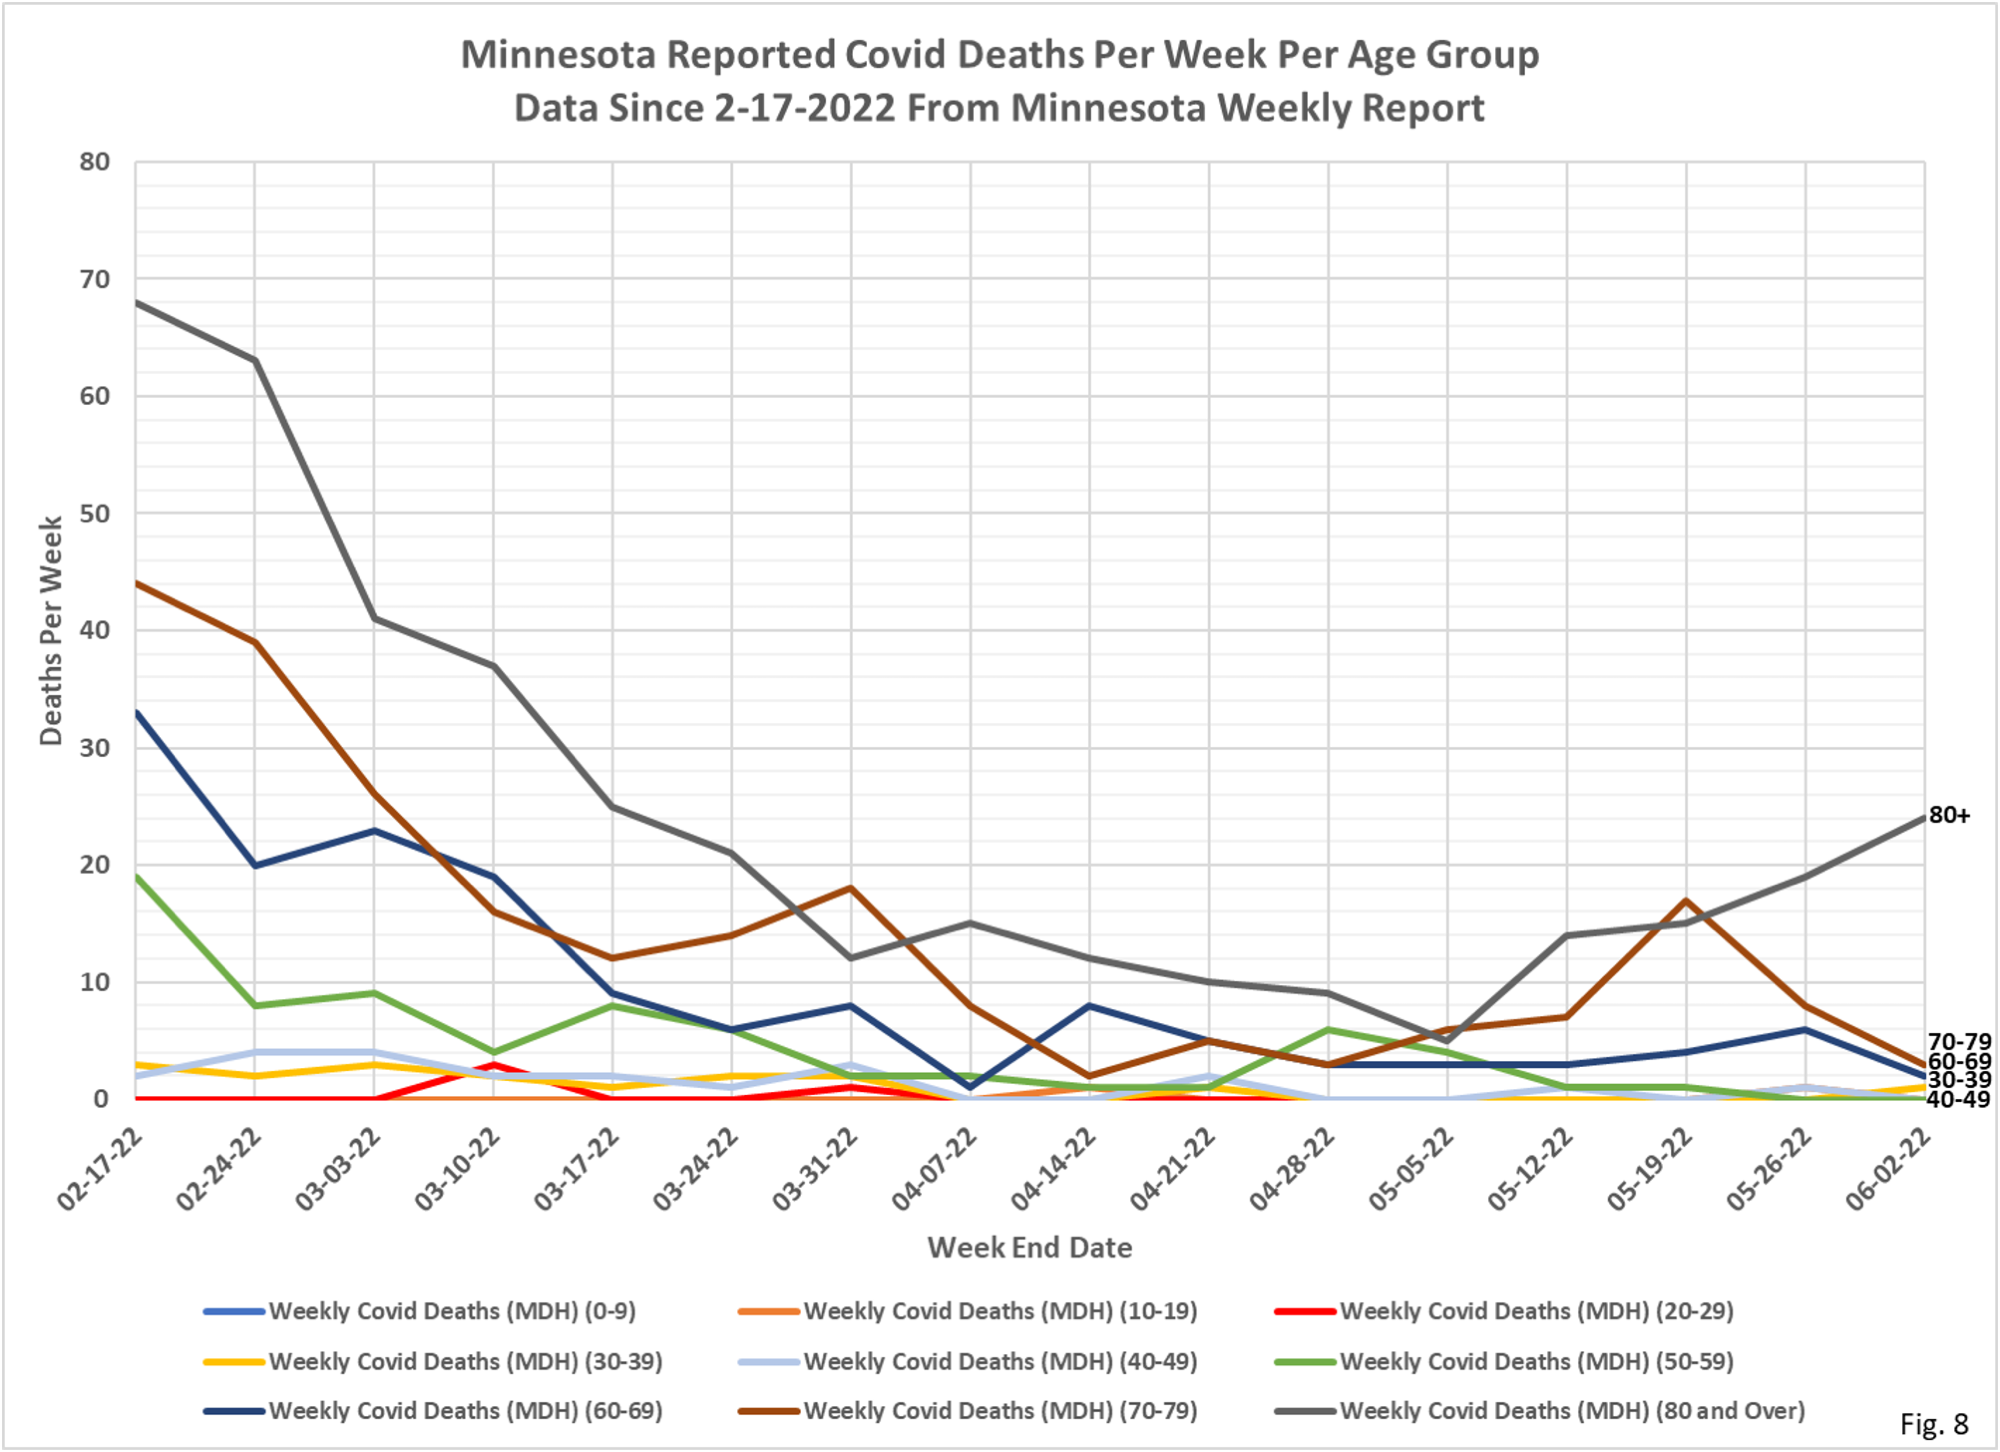
- Fig. 7 and 8: Covid Deaths Per Week. Total reported Covid deaths for the week were 30, down from 35 reported deaths last week. Decreases in deaths in the 60-69 and 70-79 age groups were offset by an increase in deaths in the 80+ age group.
Data Sources:
The data for the charts on testing, hospital admissions, and deaths comes from the Minnesota Weekly Report (available here: https://www.health.state.mn.us/diseases/coronavirus/stats/index.html). The data in the Weekly Report is presented as cumulative totals for each data type each week. I am taking weekly differences and assembling the data into charts. This data is by date of report, meaning the charts are documenting new events reported this week, even though the underlying event occurred sometime in the past. The data is provided for 5 year age groups, and I am assembling into 10 year age groups to make the charts more readable.
The data for the Covid cases per week come from a data file published along with the Minnesota Weekly Report, here: https://www.health.state.mn.us/diseases/coronavirus/stats/index.html#wagscd1 This data is published by date of specimen collection, rather than by date of report as the other data is. The data is provided as cases per week in 5 year age groups. I am compiling the data into 10 year age groups in order for the charts to be more readable. This data is updated by date of specimen collection, so it is likely that the past week’s data will be updated.
