As Dave suggests, it looks like our current “wave” has peaked. Summer should be completely low-level, we will see what fall brings.
 Dave’s notes:
- Overall, Covid cases are now well past peak, while ICU and non-ICU admissions and deaths are perhaps at or near their peak.
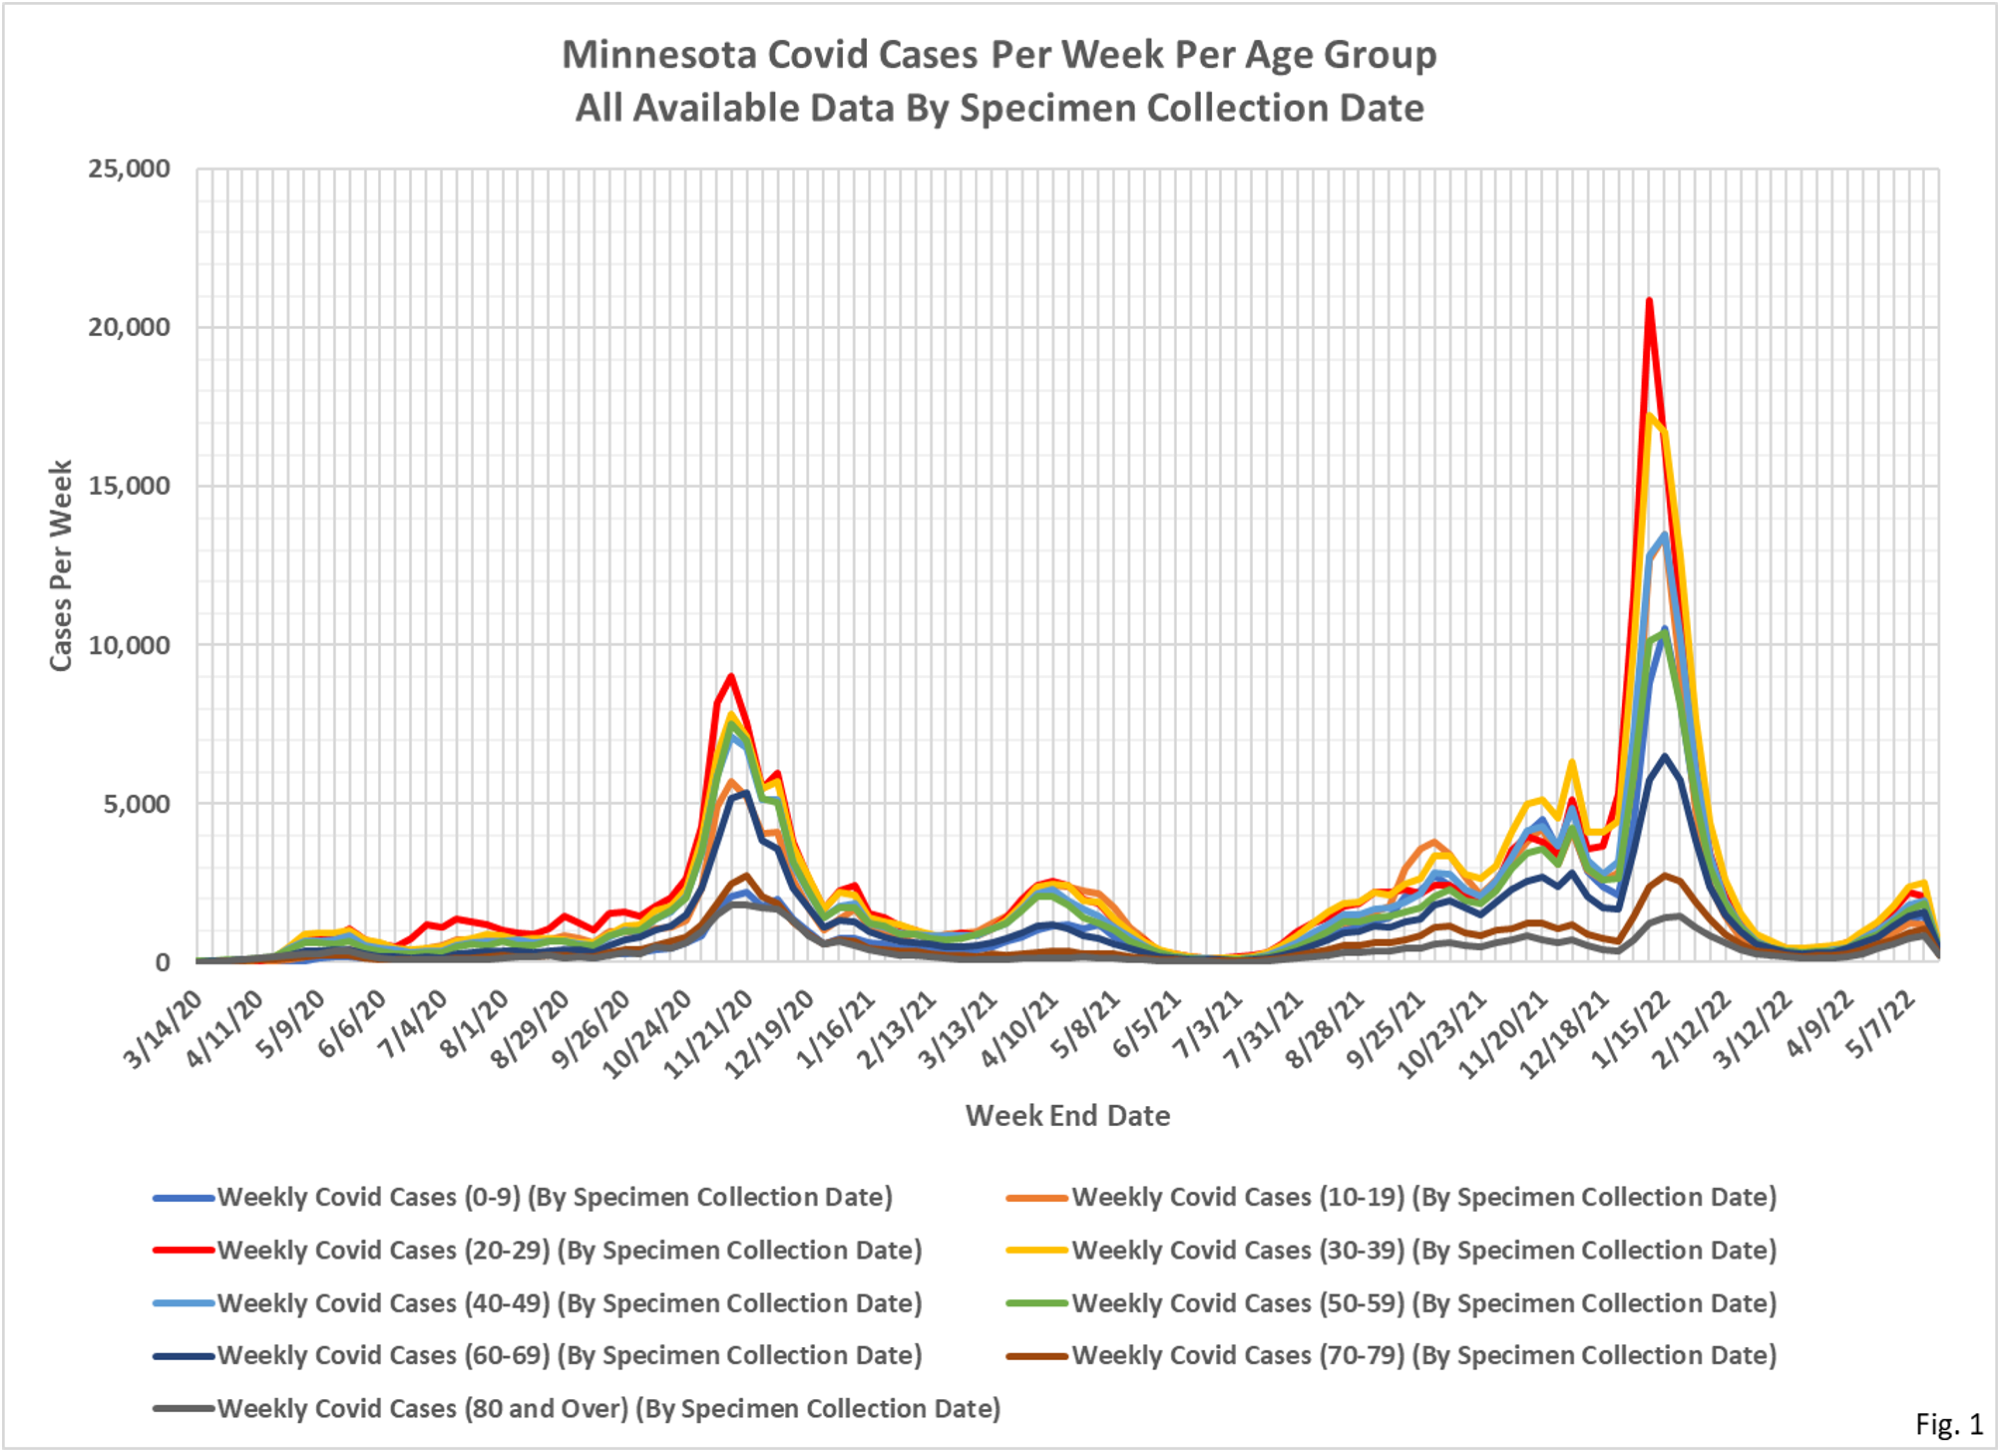
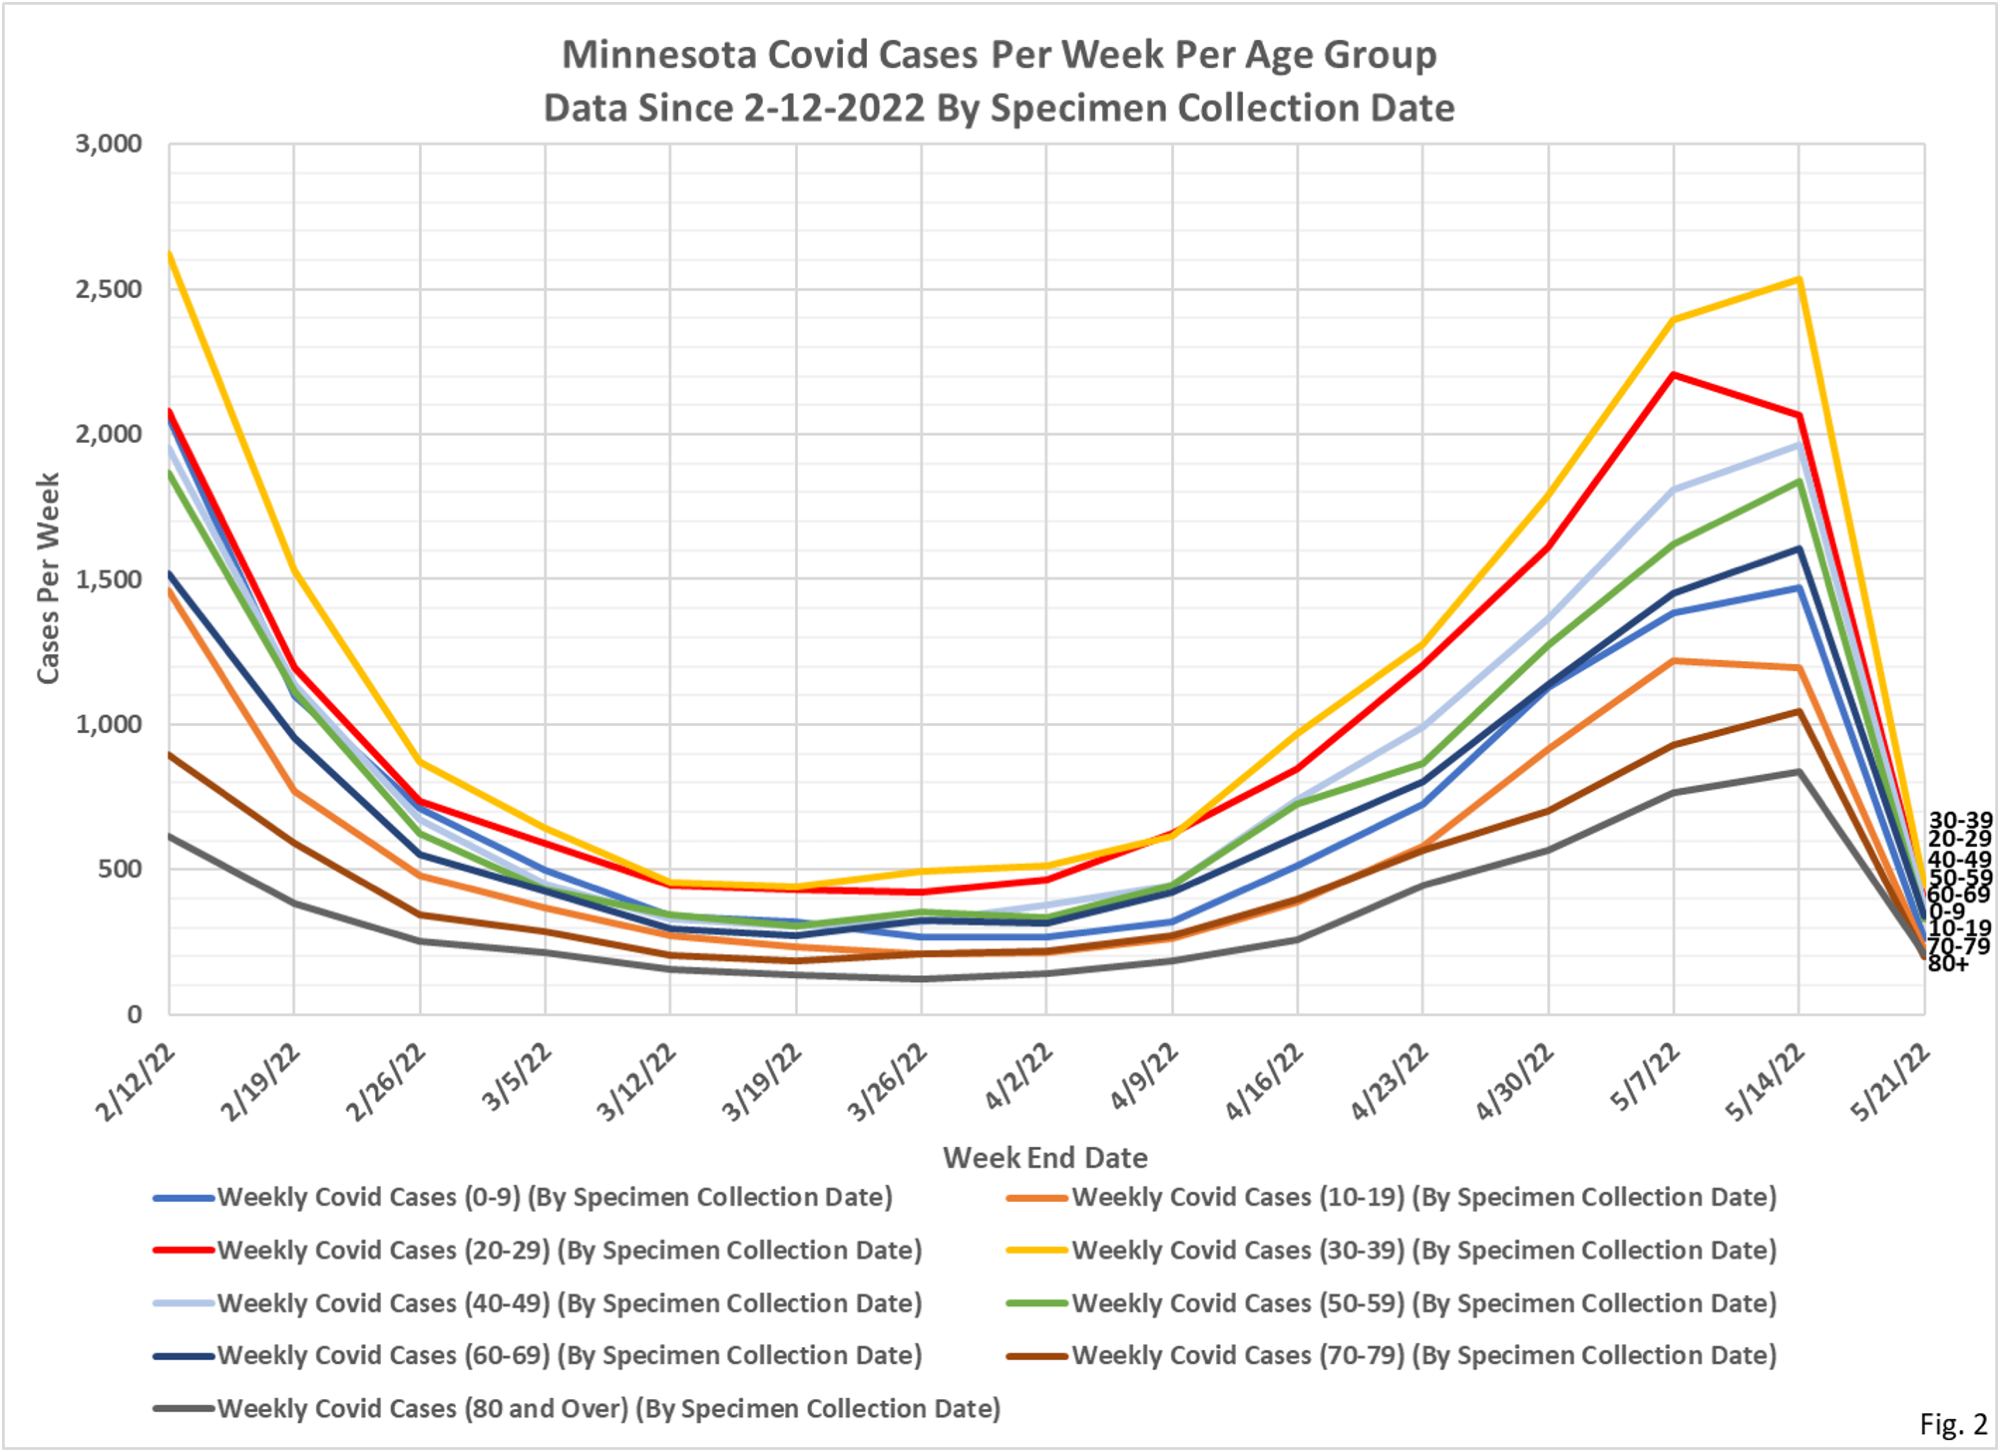
- Fig. 1 and 2: Covid Cases Per Week. The reported Covid cases this week are sharply lower this week for all age groups. Total reported cases for the week were only 2,785 total for all age groups, down from 14,548 revised cases reported last week, and 13,781 cases 2 weeks ago. There is sometimes a longer lag in reporting cases, and it is possible that this week’s total cases will be revised higher next week.
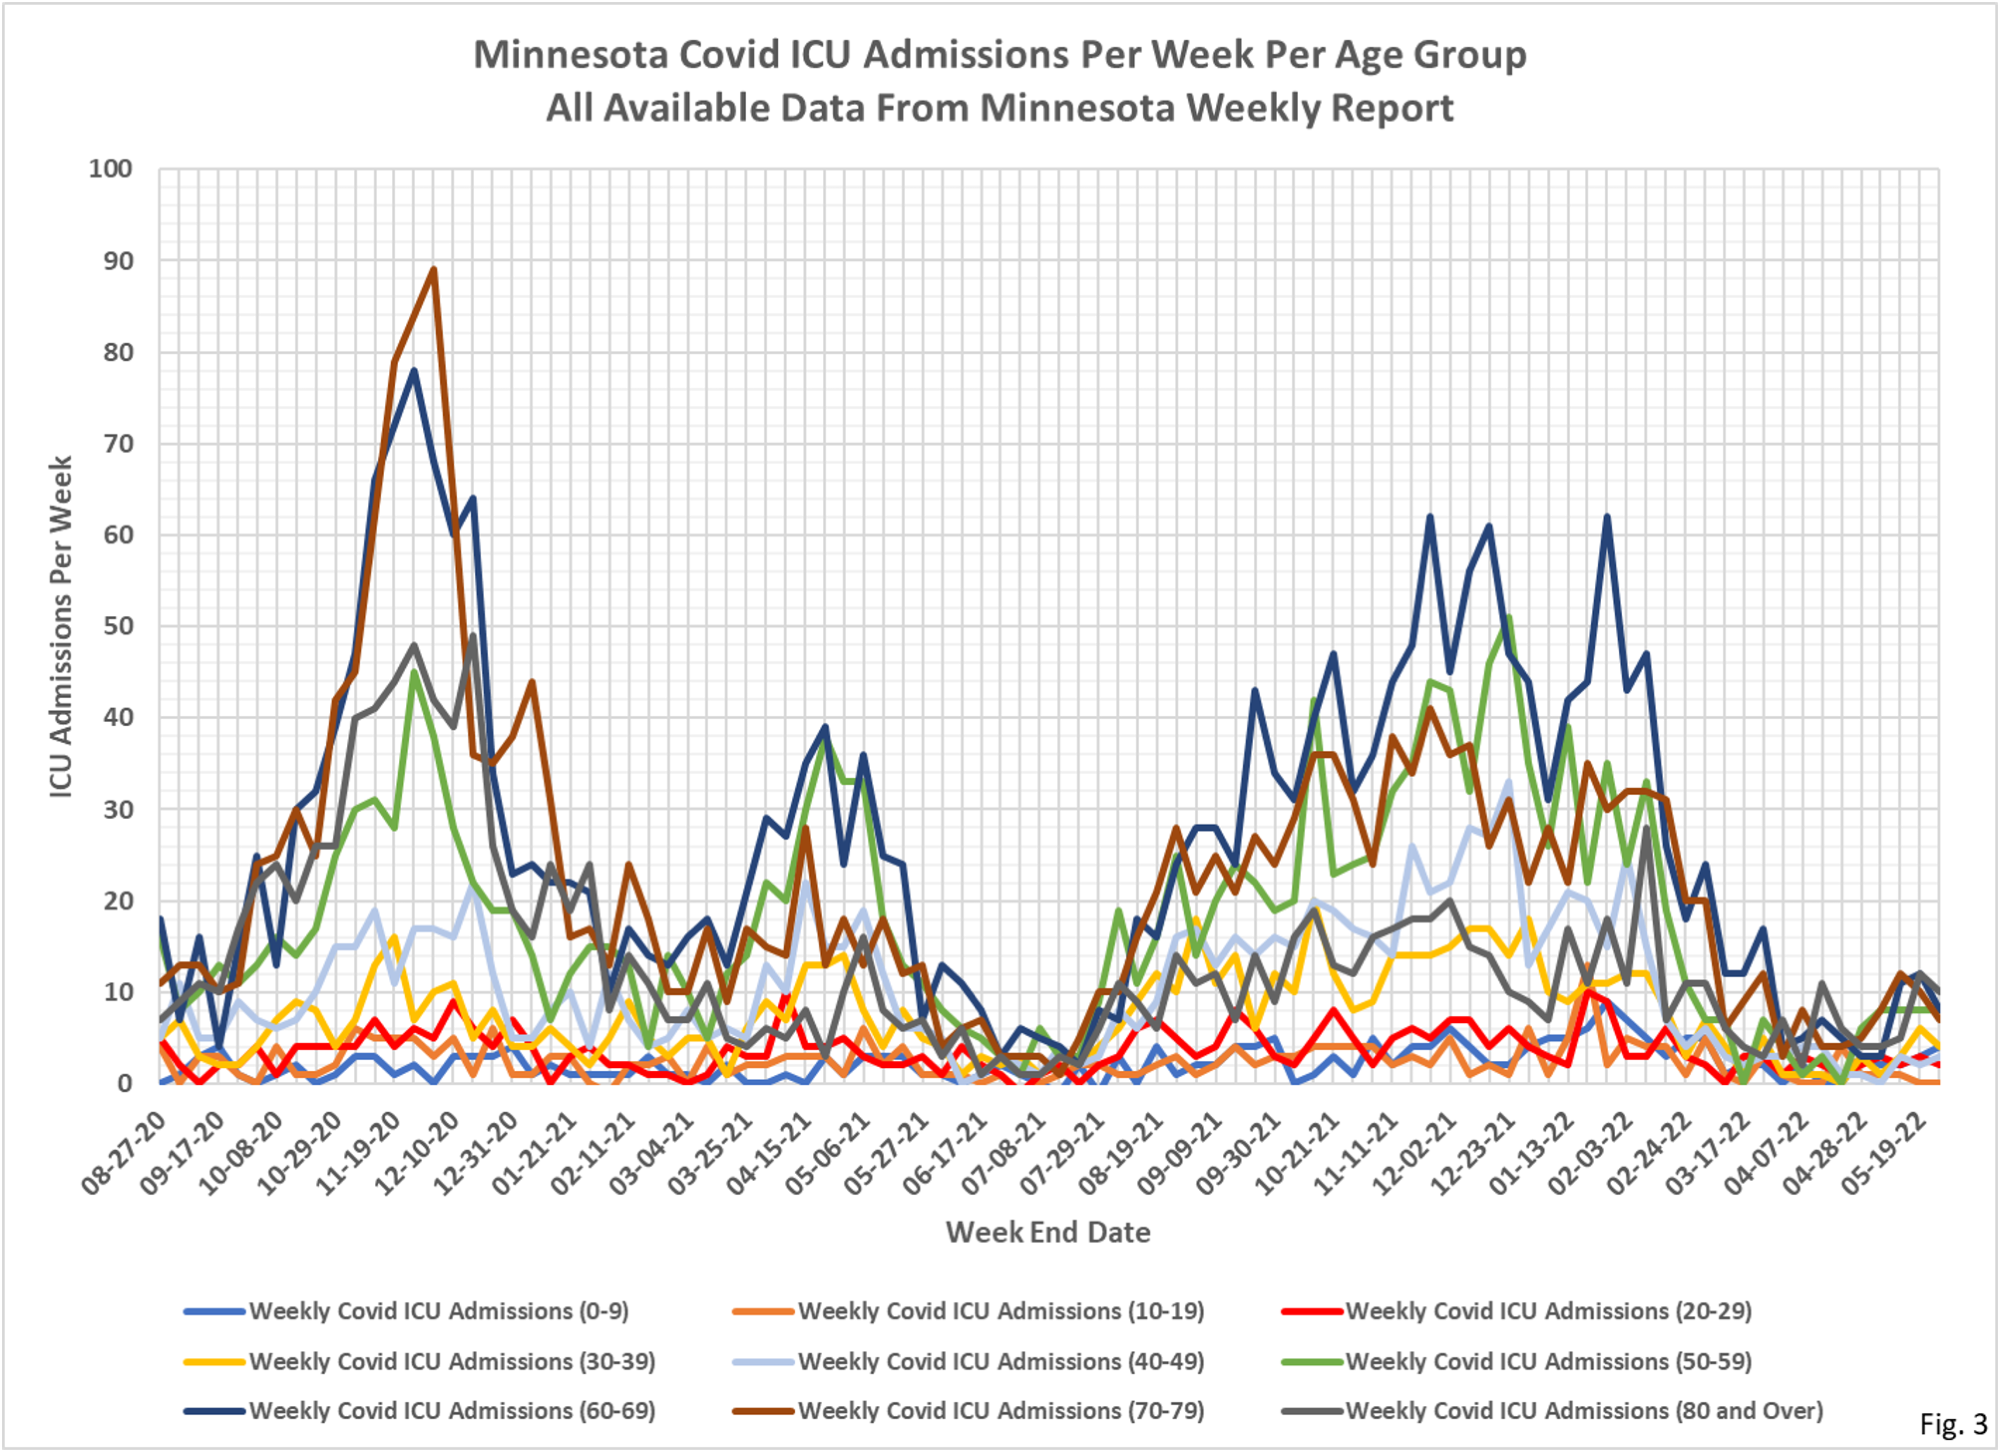
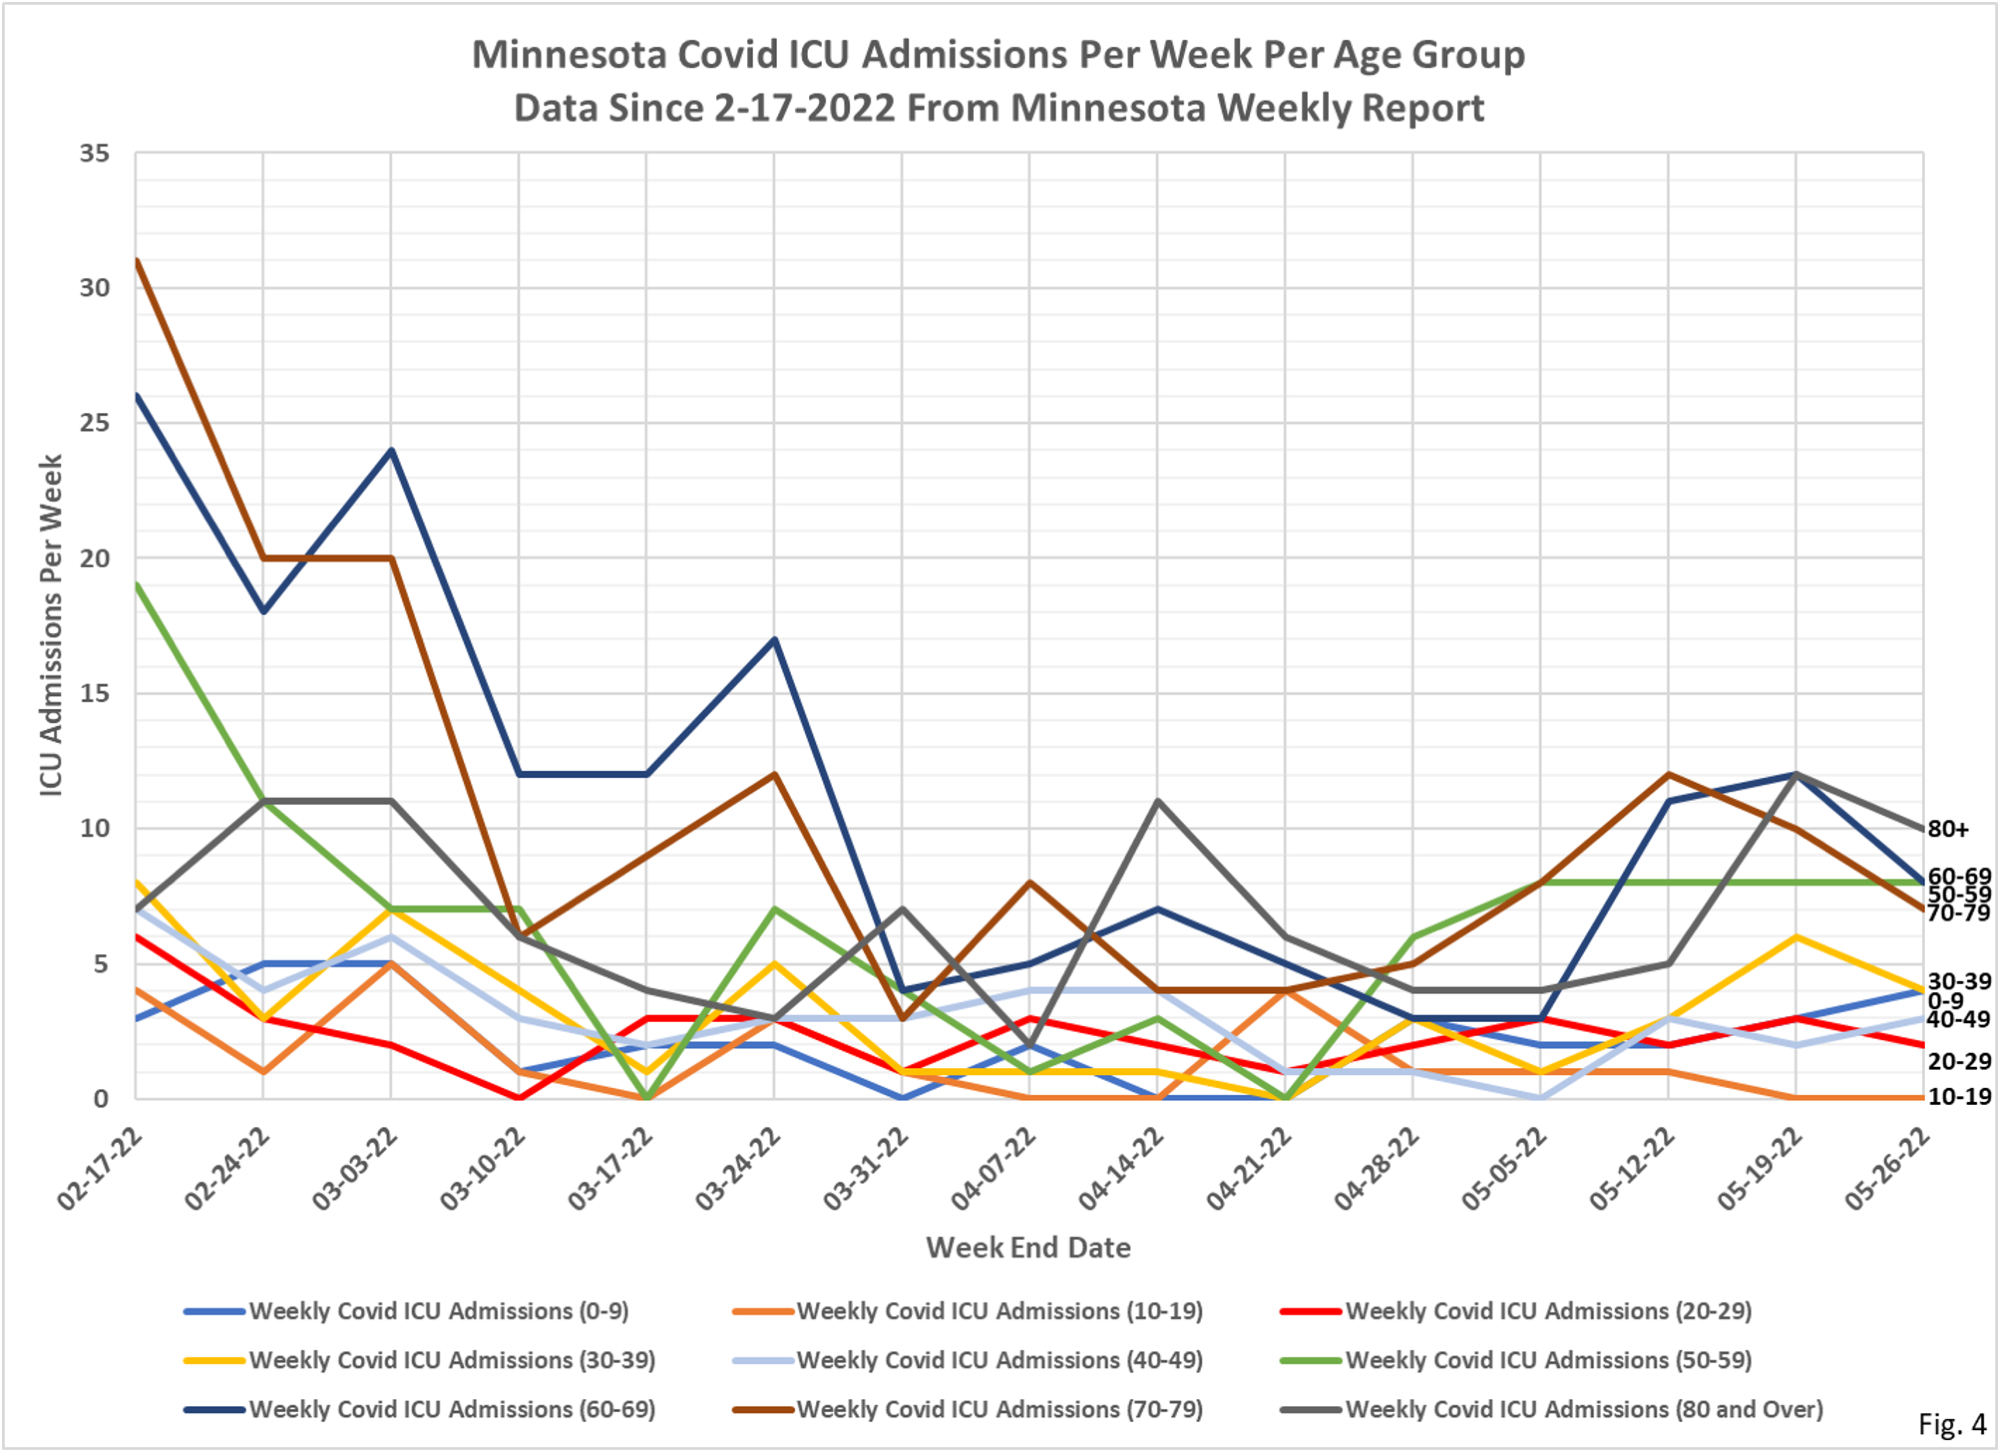
- Fig. 3 and 4: ICU Covid Admissions Per Week. Reported total ICU admissions for the week were 46, an decrease of 109 from the total of 56 admissions reported last week. The 0-9 and 40-49 age groups were higher, while all other age groups were lower for the week.
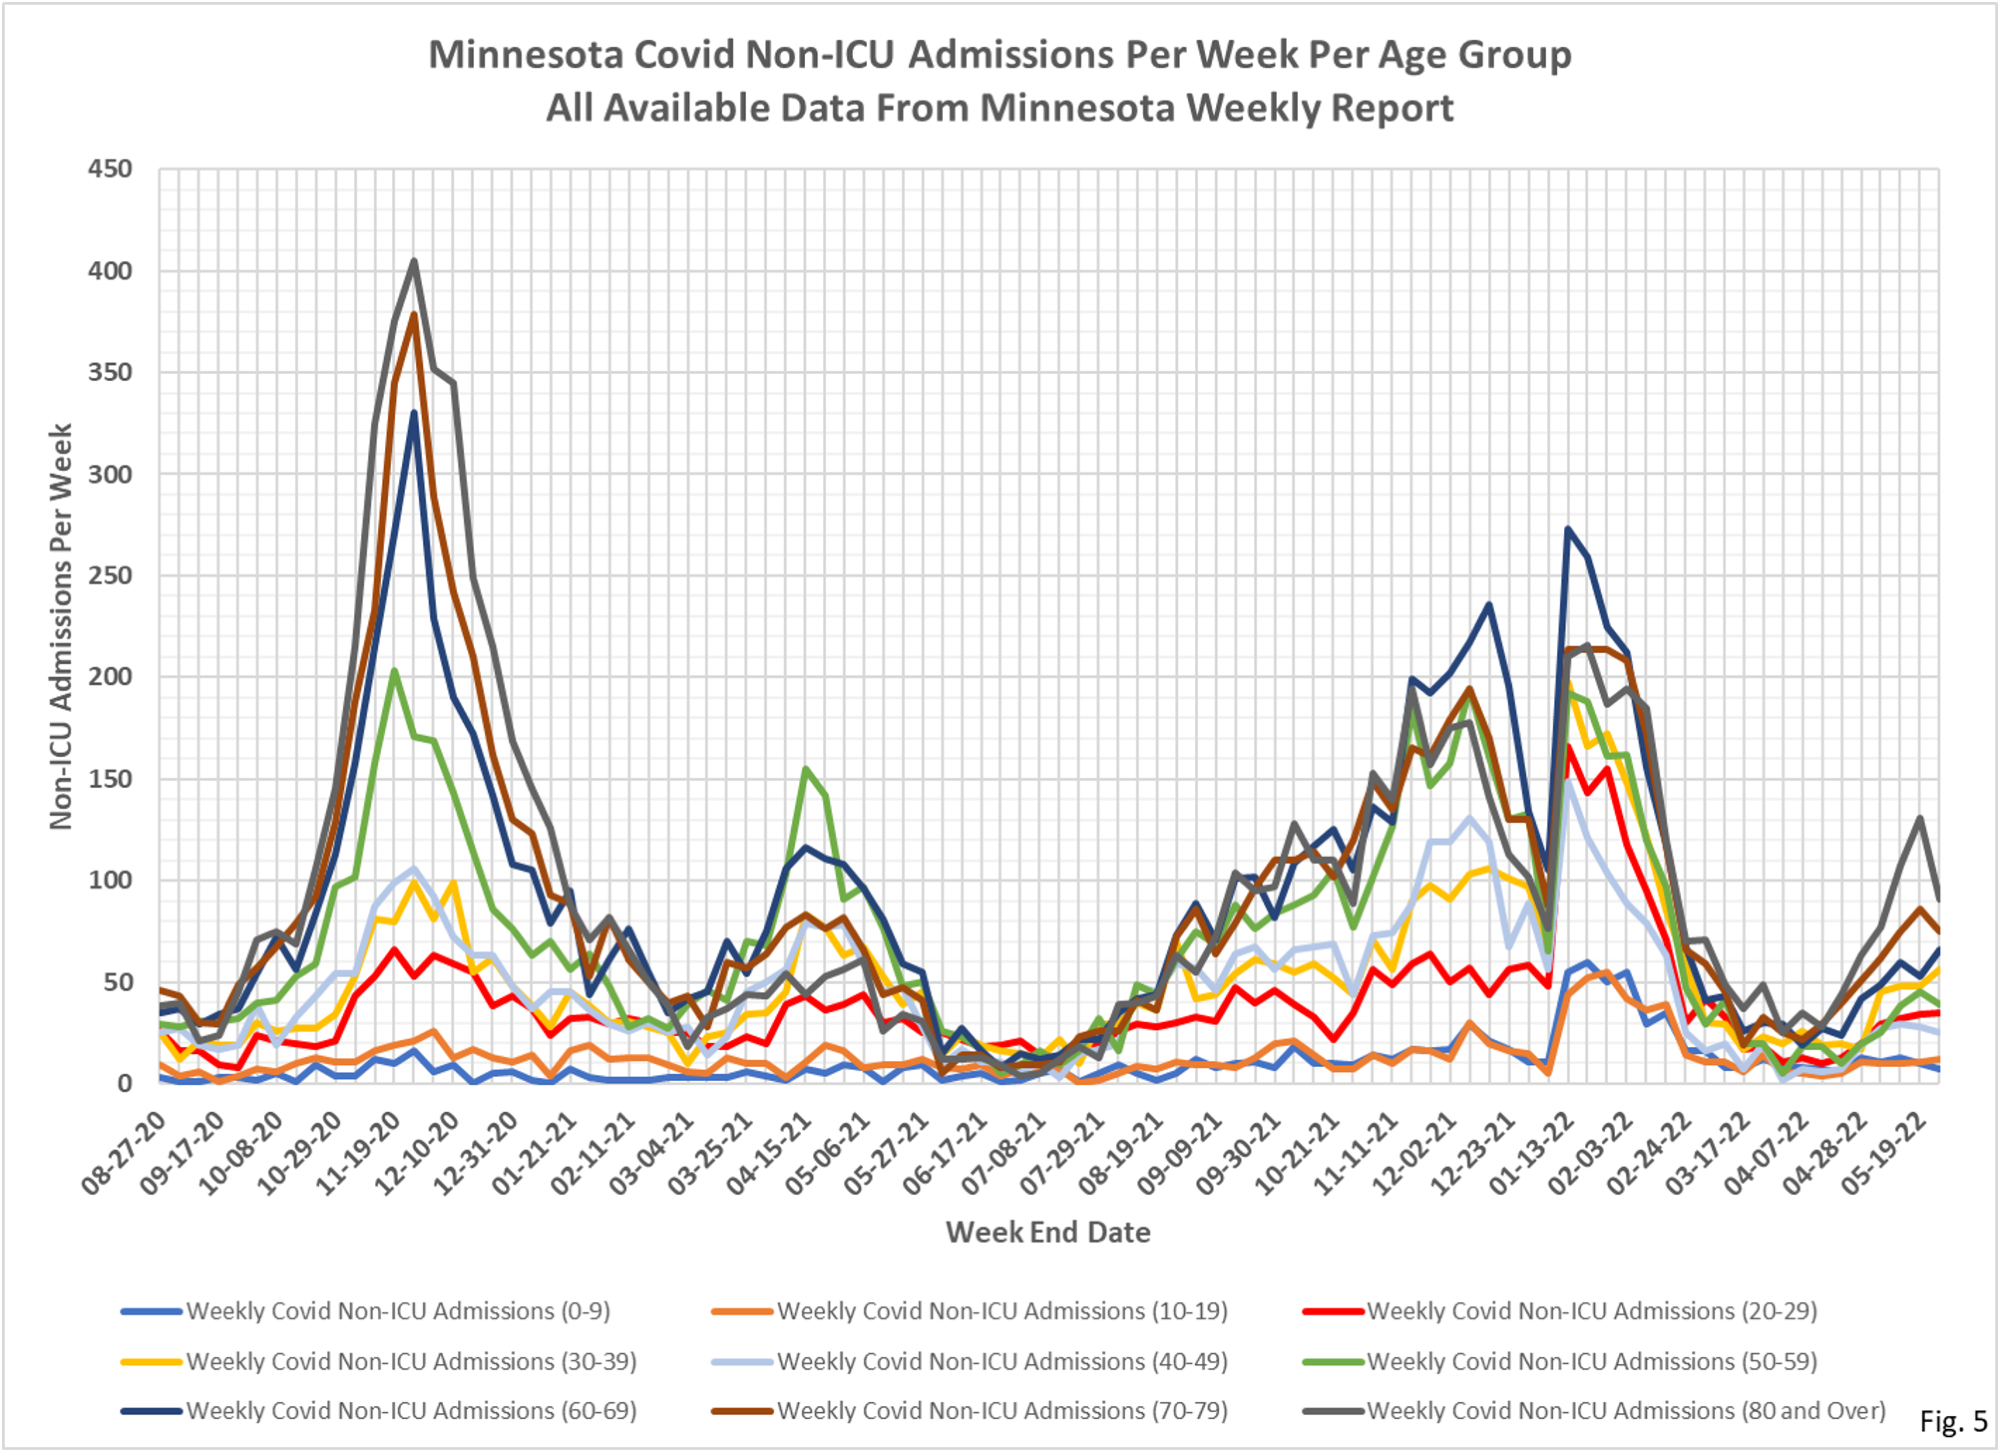
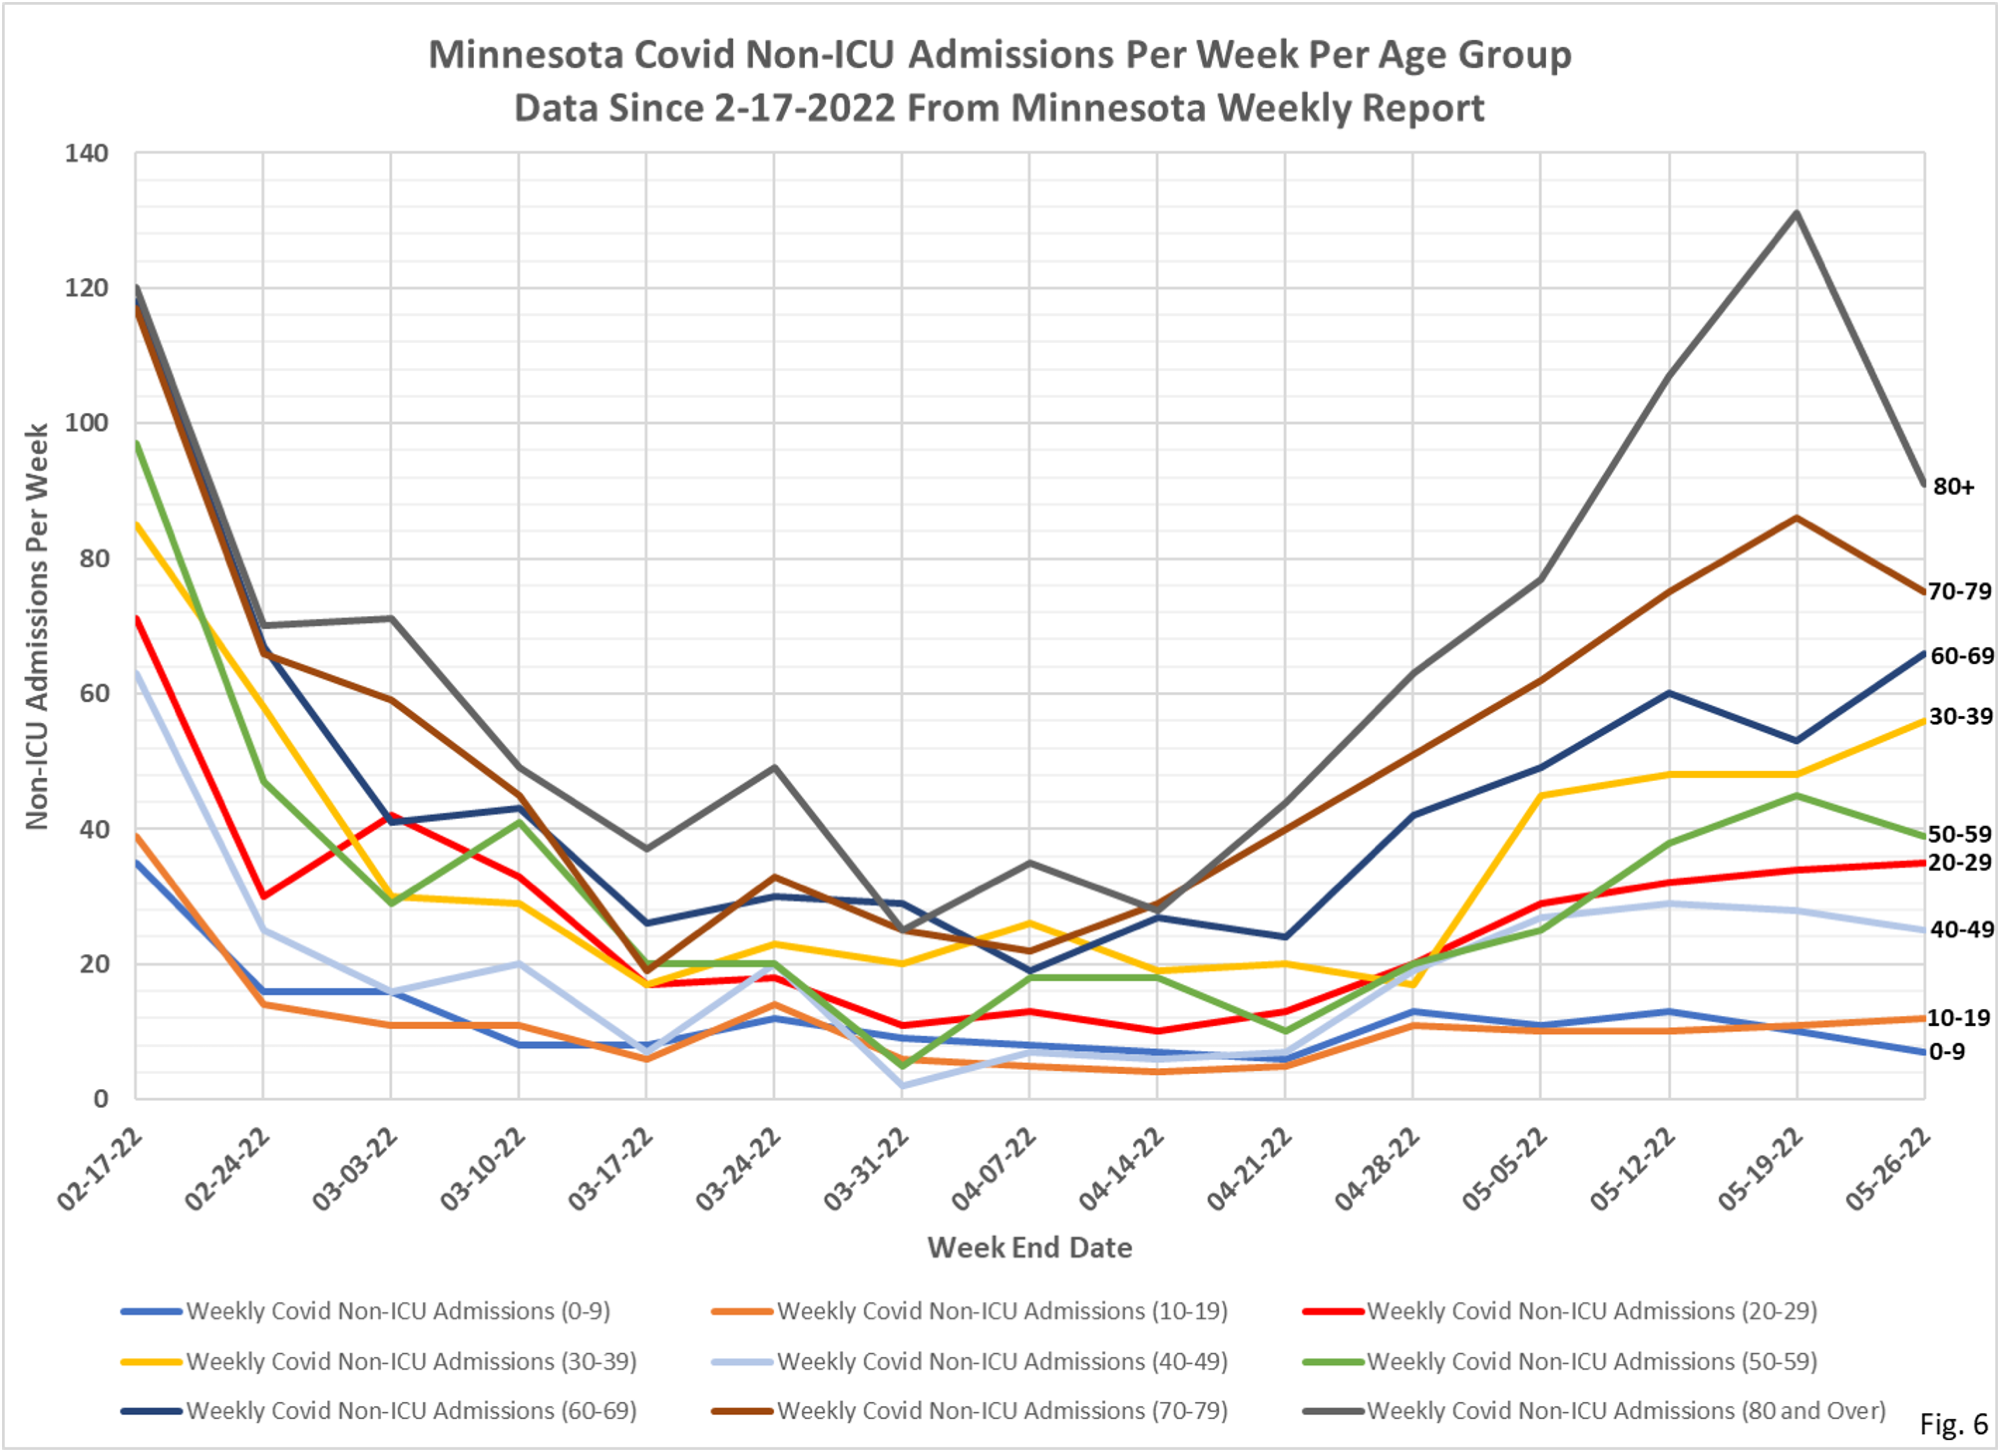
- Fig. 5 and 6: Non-ICU Covid Admissions Per Week. Reported total non-ICU admissions for the week were 406, down from 446 last week. The 30-39 and 60-69 age groups were higher this week, while all other age groups were flat or lower.
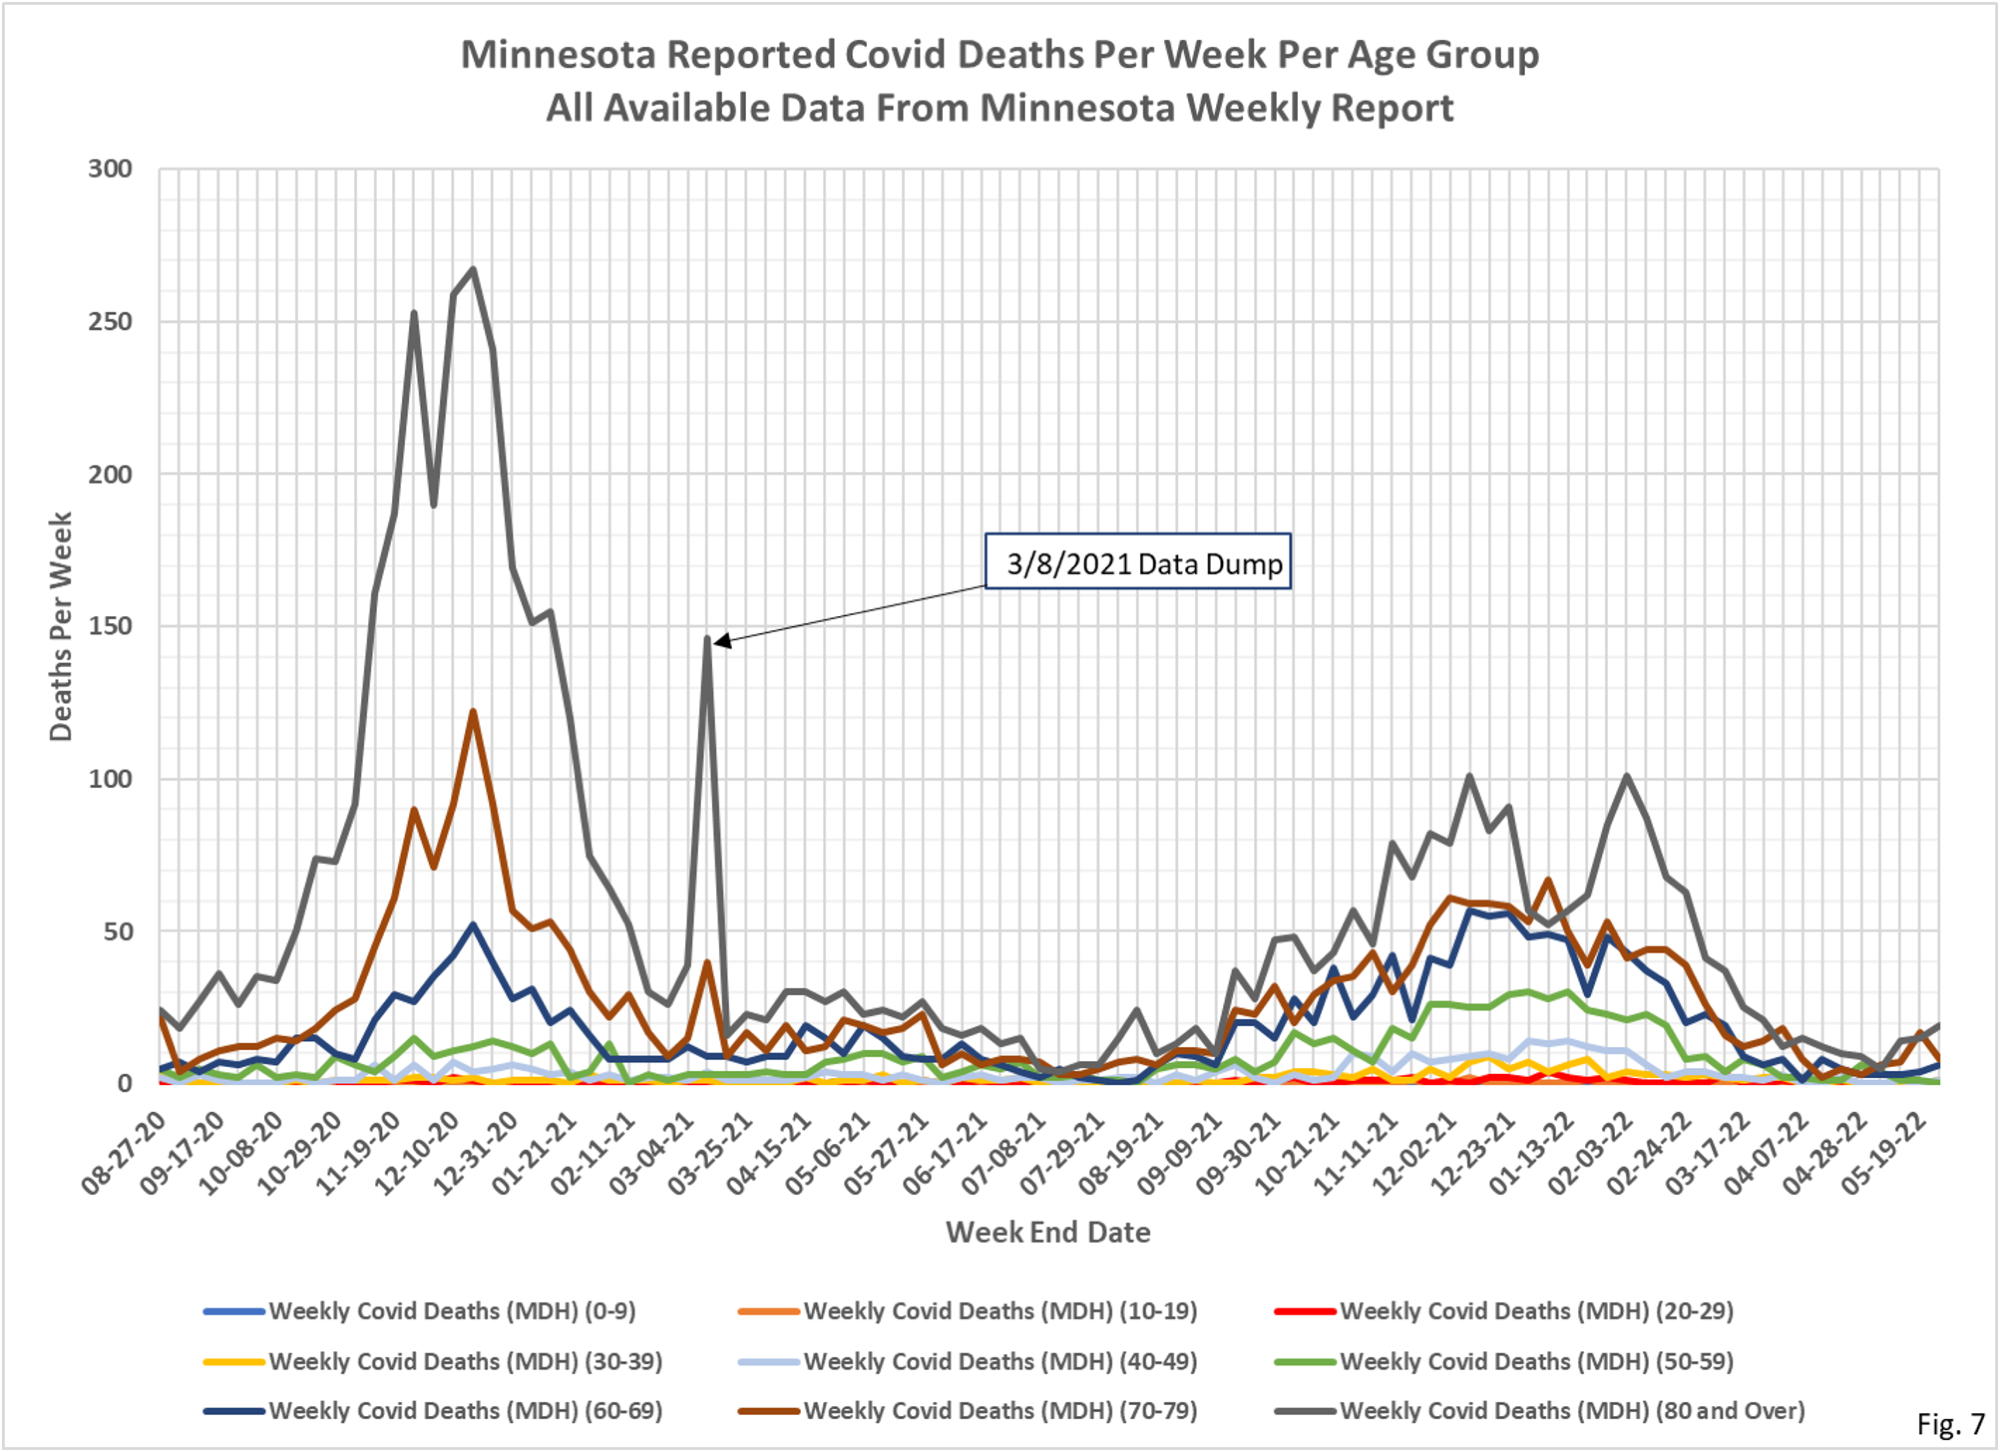
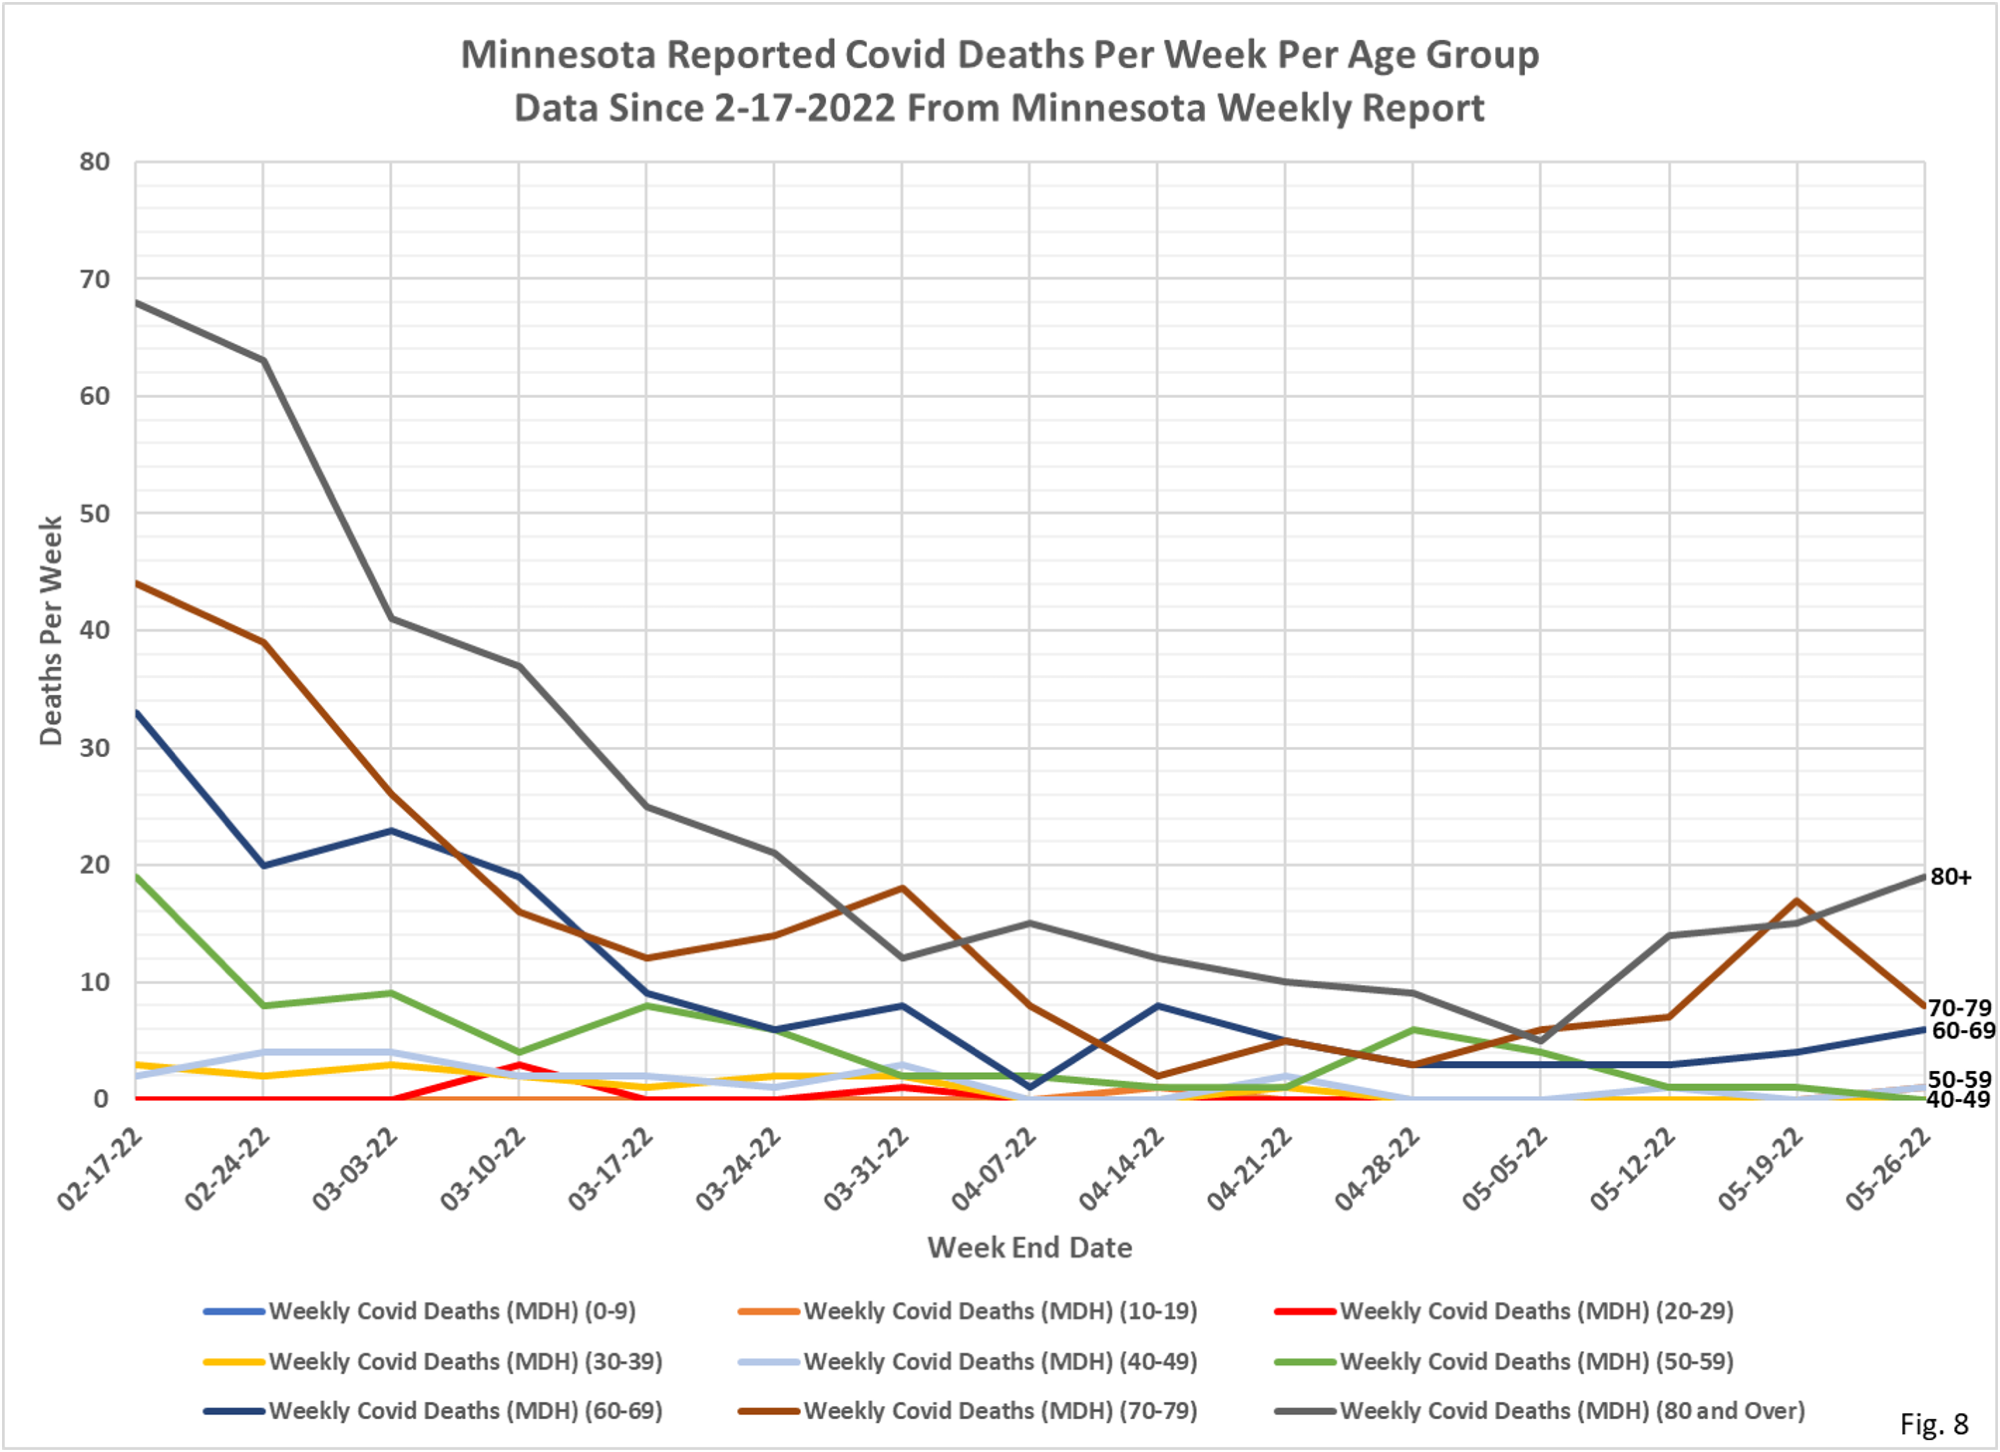
- Fig. 7 and 8: Covid Deaths Per Week. Total reported Covid deaths for the week were 35, down from 37 reported deaths last week. The 70-79 age group decreased sharply this week, after rising sharply last week. The 60-69 and 80+ age groups were slightly higher.
Data Sources:
The data for the charts on testing, hospital admissions, and deaths comes from the Minnesota Weekly Report (available here: https://www.health.state.mn.us/diseases/coronavirus/stats/index.html). The data in the Weekly Report is presented as cumulative totals for each data type each week. I am taking weekly differences and assembling the data into charts. This data is by date of report, meaning the charts are documenting new events reported this week, even though the underlying event occurred sometime in the past. The data is provided for 5 year age groups, and I am assembling into 10 year age groups to make the charts more readable.
The data for the Covid cases per week come from a data file published along with the Minnesota Weekly Report, here: https://www.health.state.mn.us/diseases/coronavirus/stats/index.html#wagscd1 This data is published by date of specimen collection, rather than by date of report as the other data is. The data is provided as cases per week in 5 year age groups. I am compiling the data into 10 year age groups in order for the charts to be more readable. This data is updated by date of specimen collection, so it is possible that past week’s data will be updated.
