More from Dave on the long-term epidemic view. In regard to hospitalizations I believe at least half are incidental, that is not primarily for treatment of CV-19. I also believe there is rampant mis-attribution of deaths.
 Dave’s notes:
- Overall, we can see that new daily cases are peaking now, roughly at the same level as the spring surge in cases in 2021. Note that ICU admissions and beds in use are much lower than in 2021. This is also significant since we believe that a lower proportion of Covid cases are officially detected, given the rise in the use of home tests for mild cases.
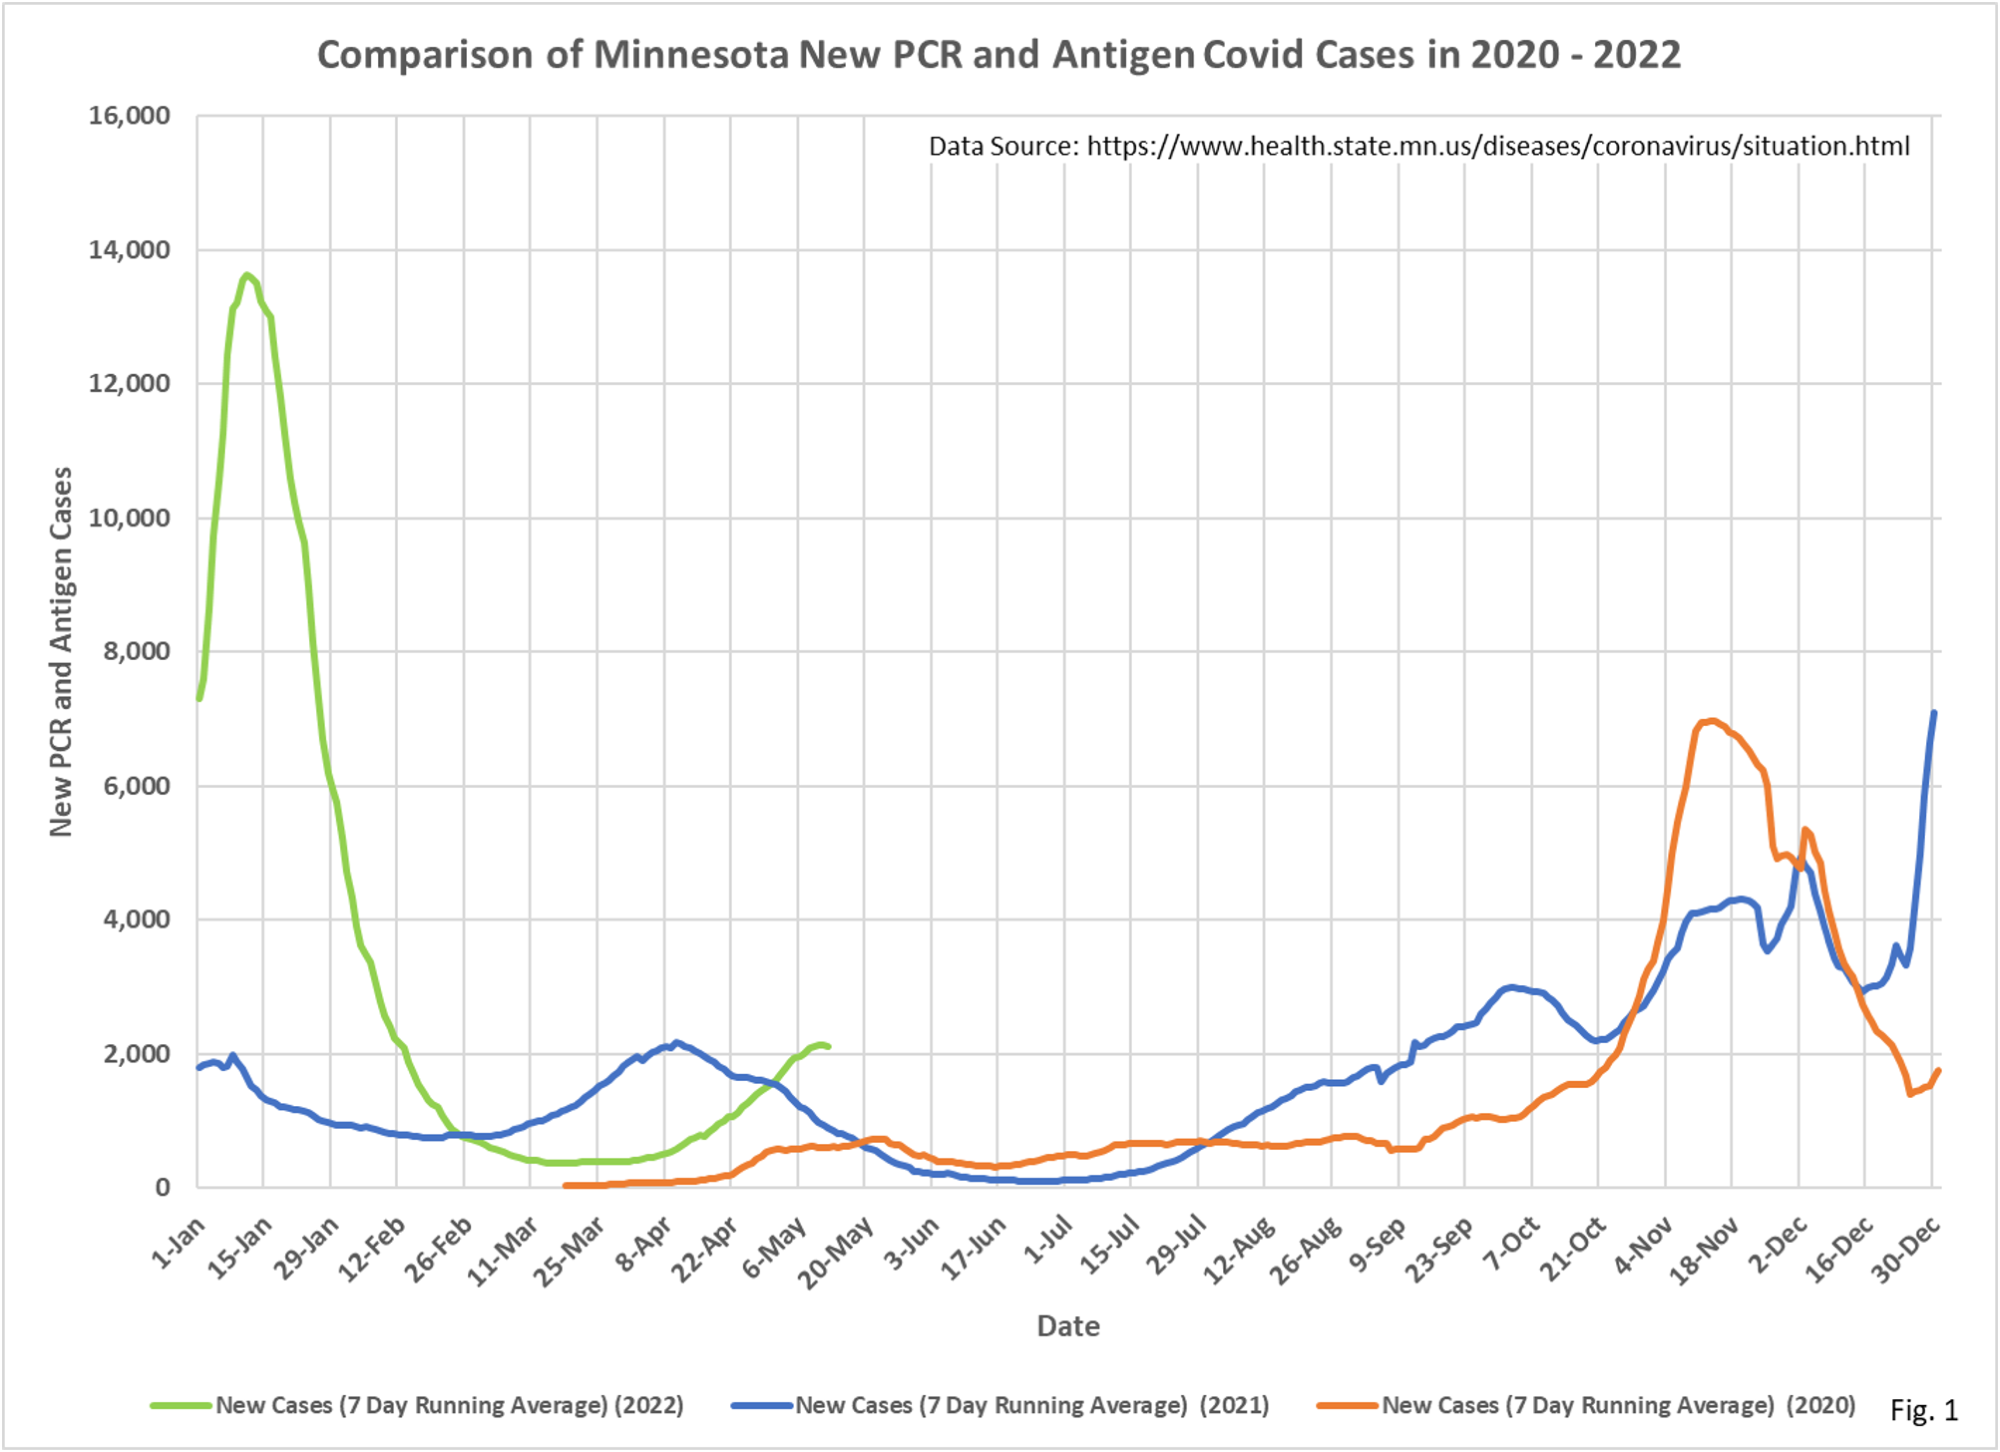
- Fig. 1: New daily cases per day bottomed out at 374 average cases per day on 3/20/2022. Daily cases may have peaked at 2133 cases on 5/11/2022, but it is certainly possible that additional cases may be reported that shift the peak.
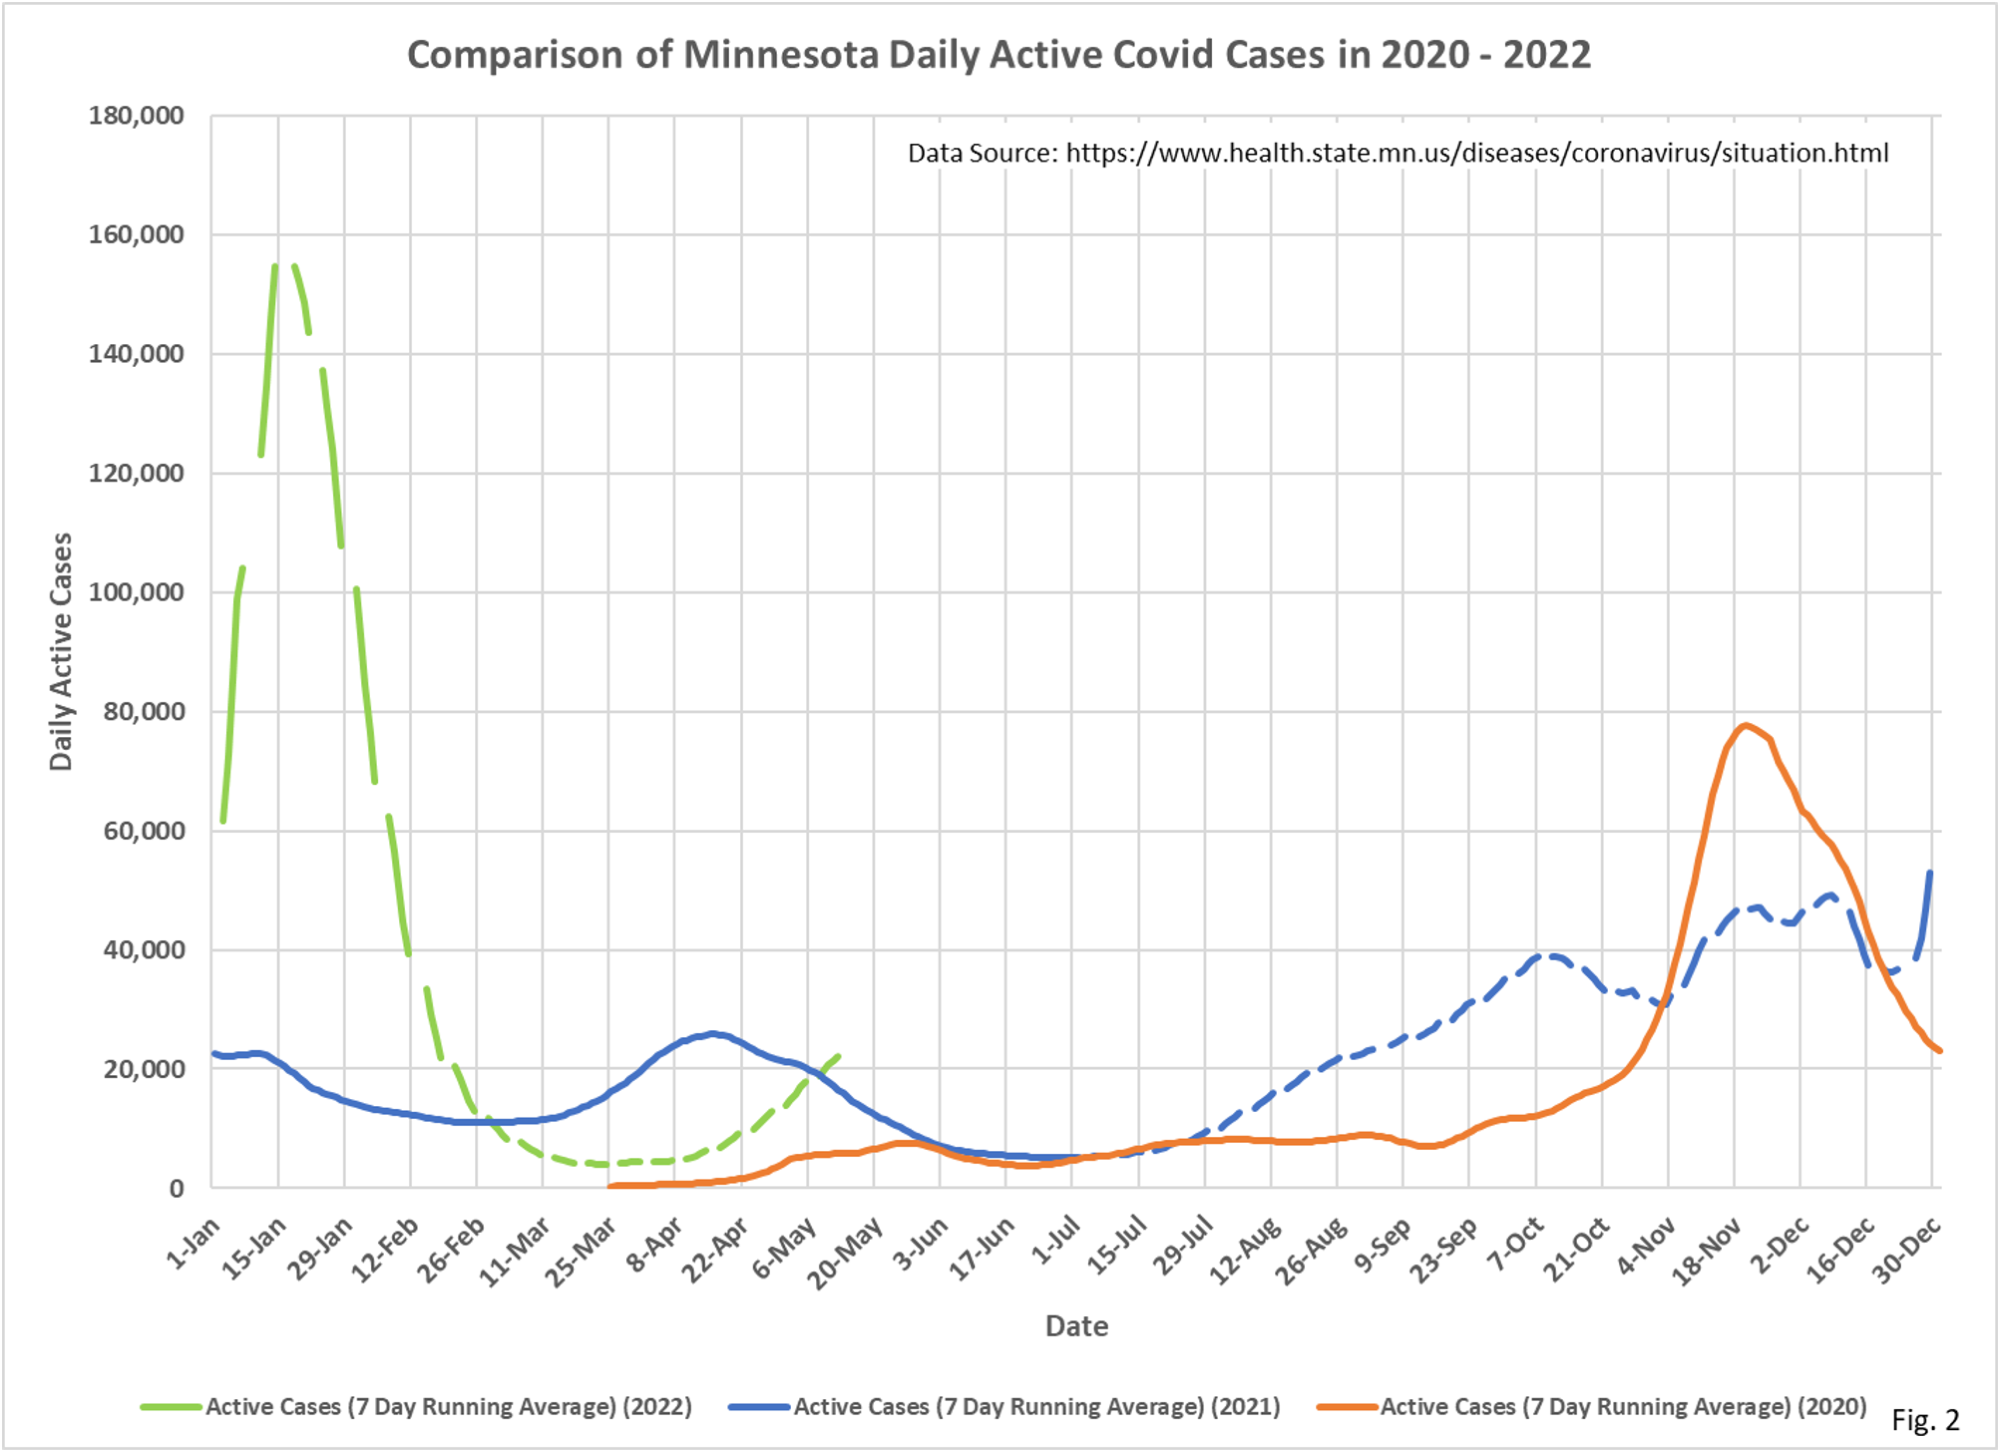
- Fig. 2: Active cases reached a recent low at 4,053 cases on 3/24/2022, and have since risen to 22,187 active cases on 5/13/2022, and have not yet reached peak.
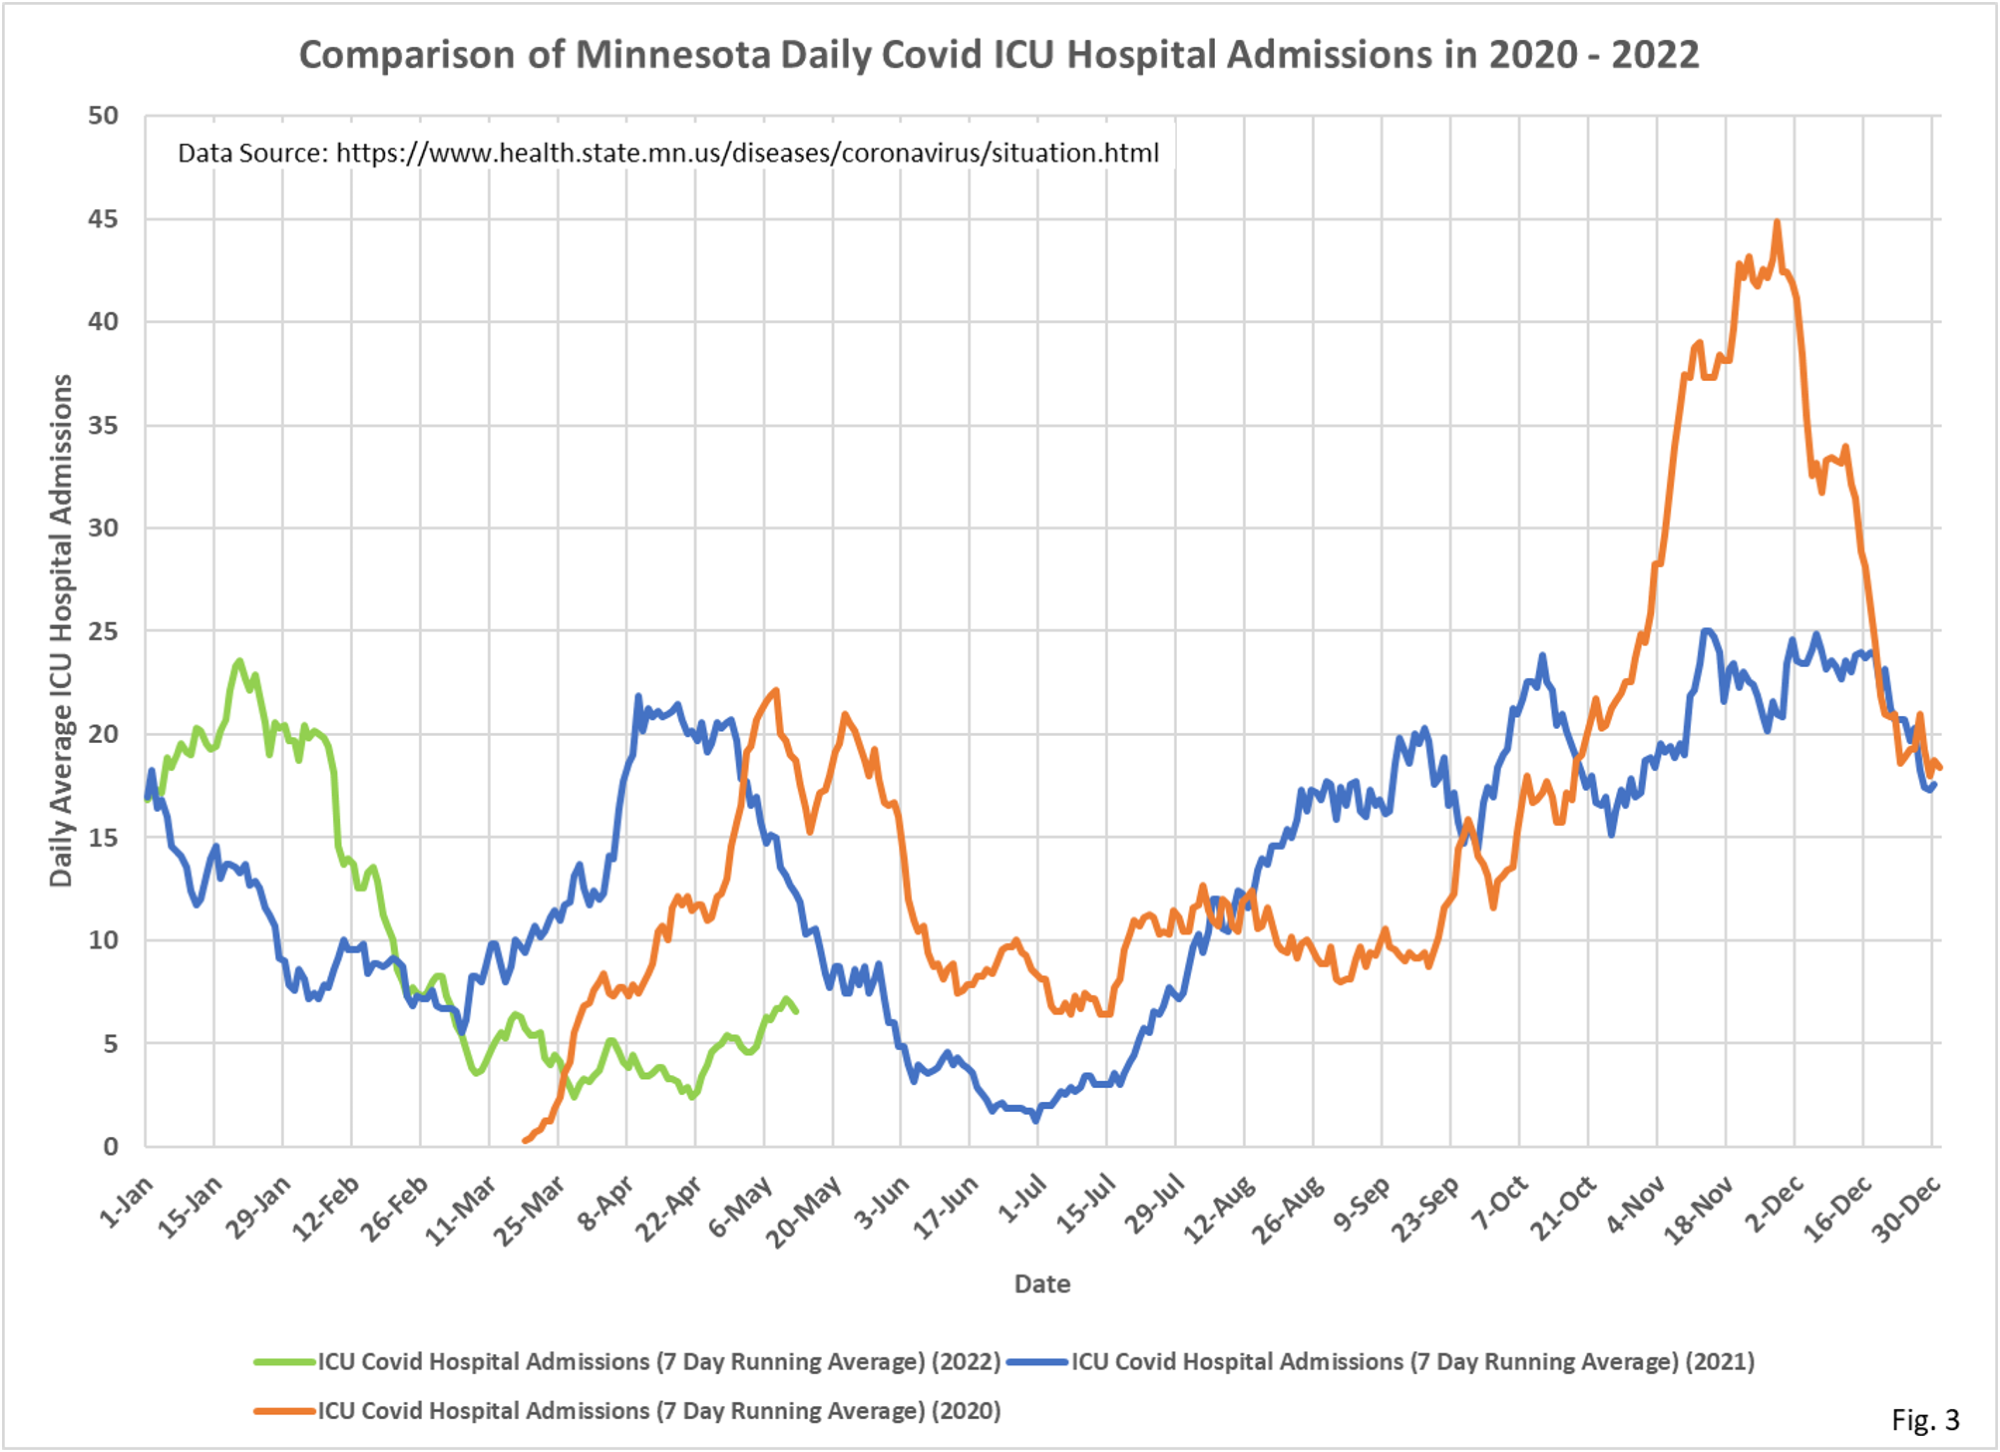
- Fig. 3: Covid ICU admissions achieved recent lows of 2.4 average admissions per day on 3/29/2022 and 4/22/2022, and have risen to 7 admissions per day on 5/12/2022. Note in the context of the entire pandemic that this level of admissions has only been lower for several months in summer of 2021.
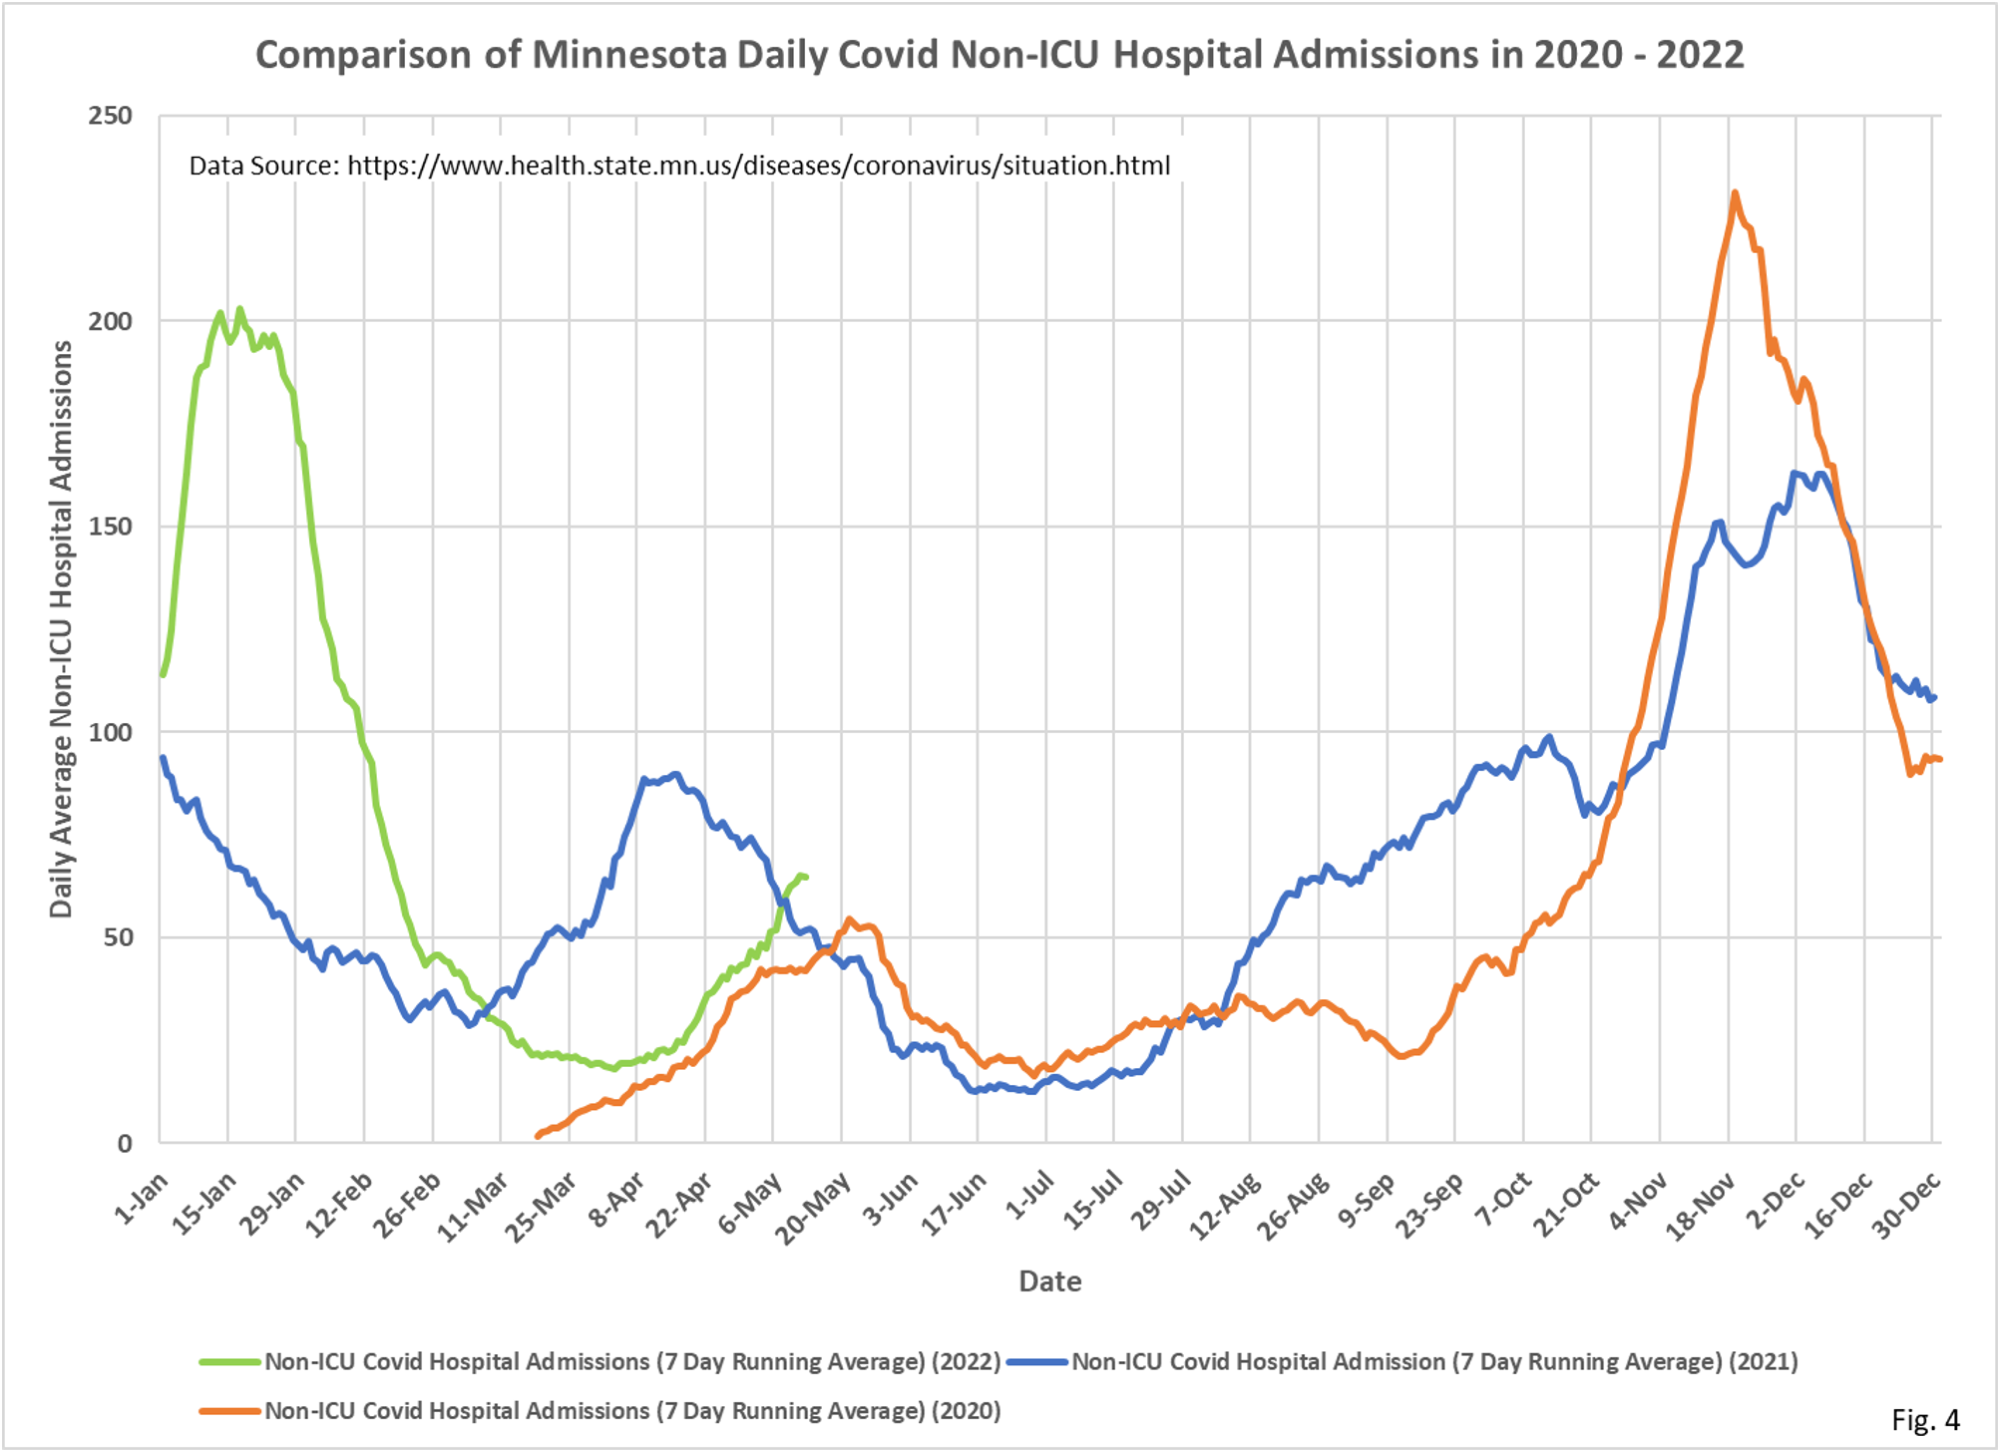
- Fig. 4: Covid Non-ICU admissions were at a minimum of 18.0 admissions per day on 4/4/2022, and most recently are at 65 admissions per day on 5/13/2022, appearing to be continuing the upward trend.
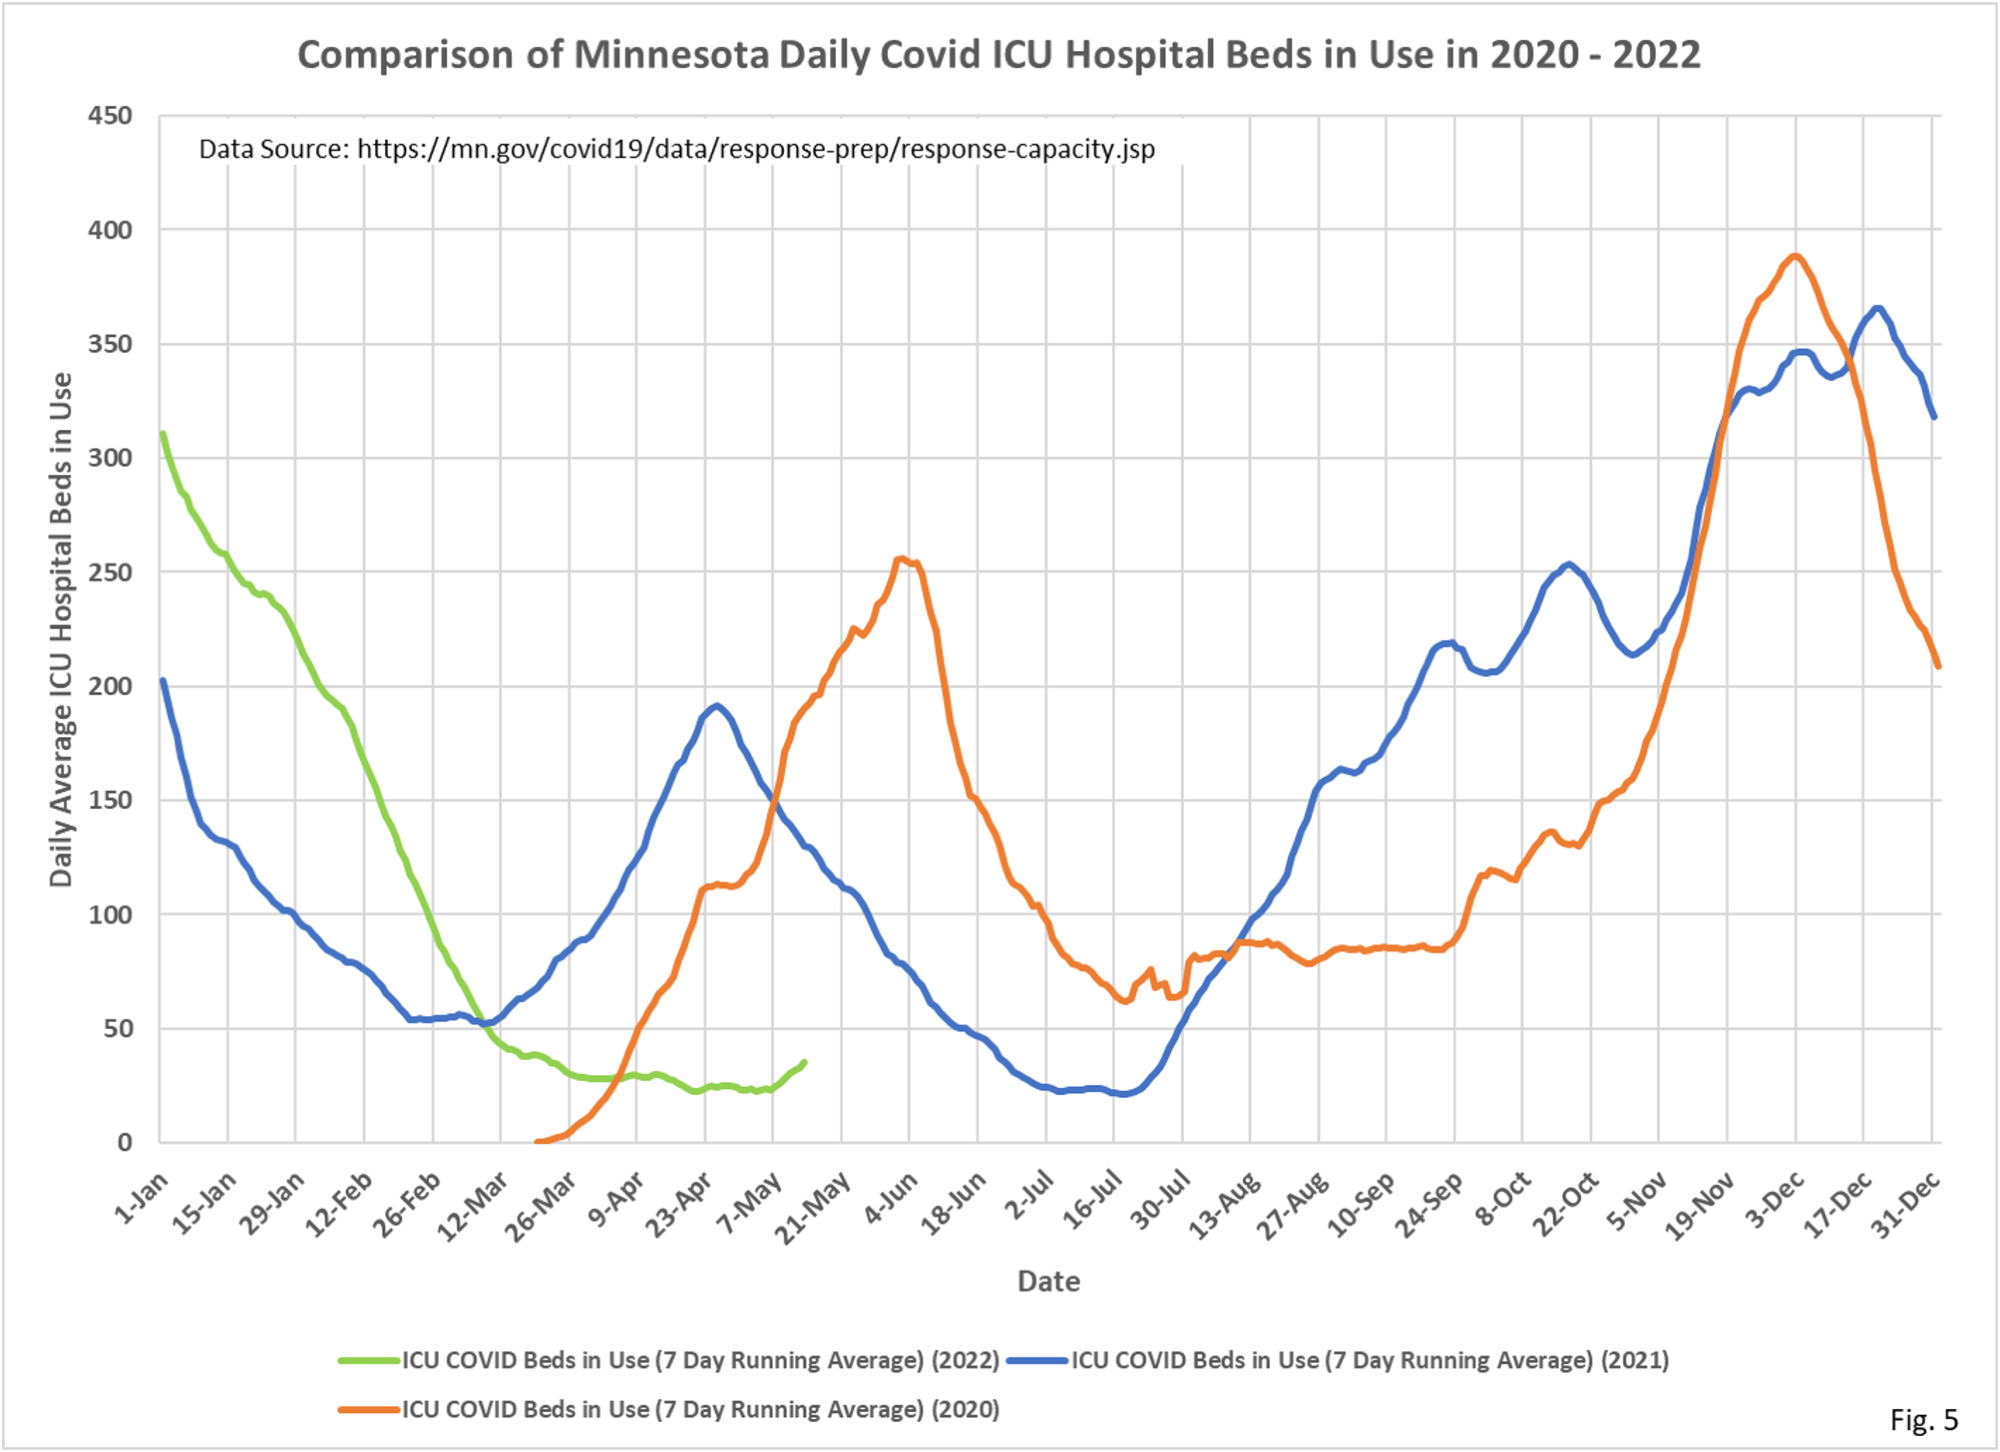
- Fig. 5: ICU Covid hospital beds have increased slightly in recent day, currently 35 ICU beds in use.
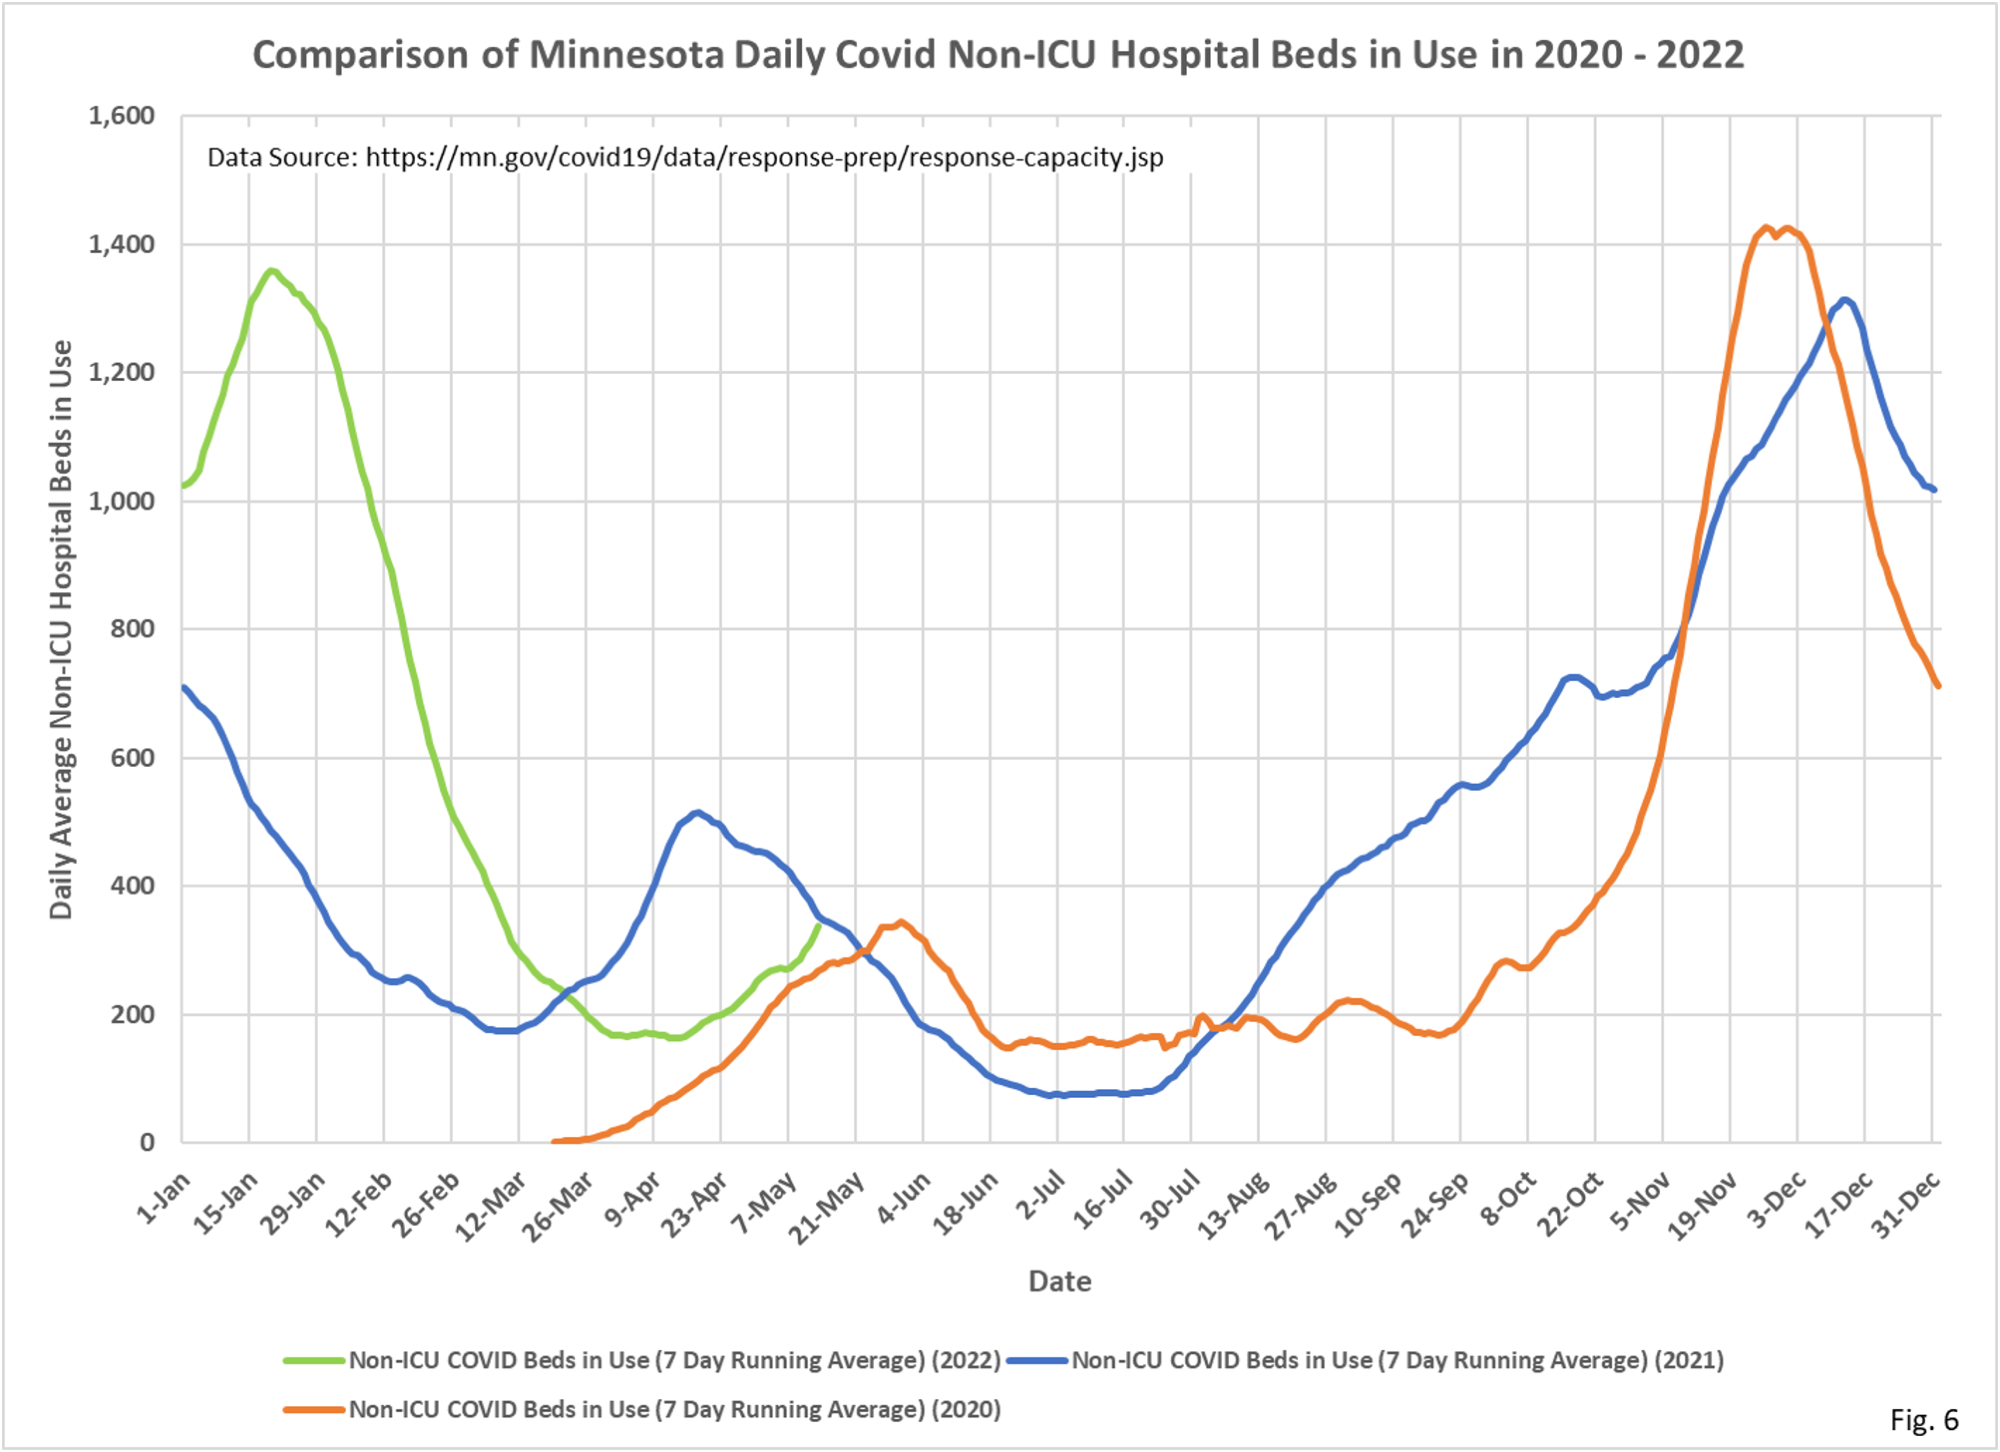
- Fig. 6: Non-ICU Covid hospital beds in use appear to be plateauing. The lowest number of Non-ICU Covid beds in use was 162.4 beds on 4/13/2022, and on 5/13/2022 were at 347
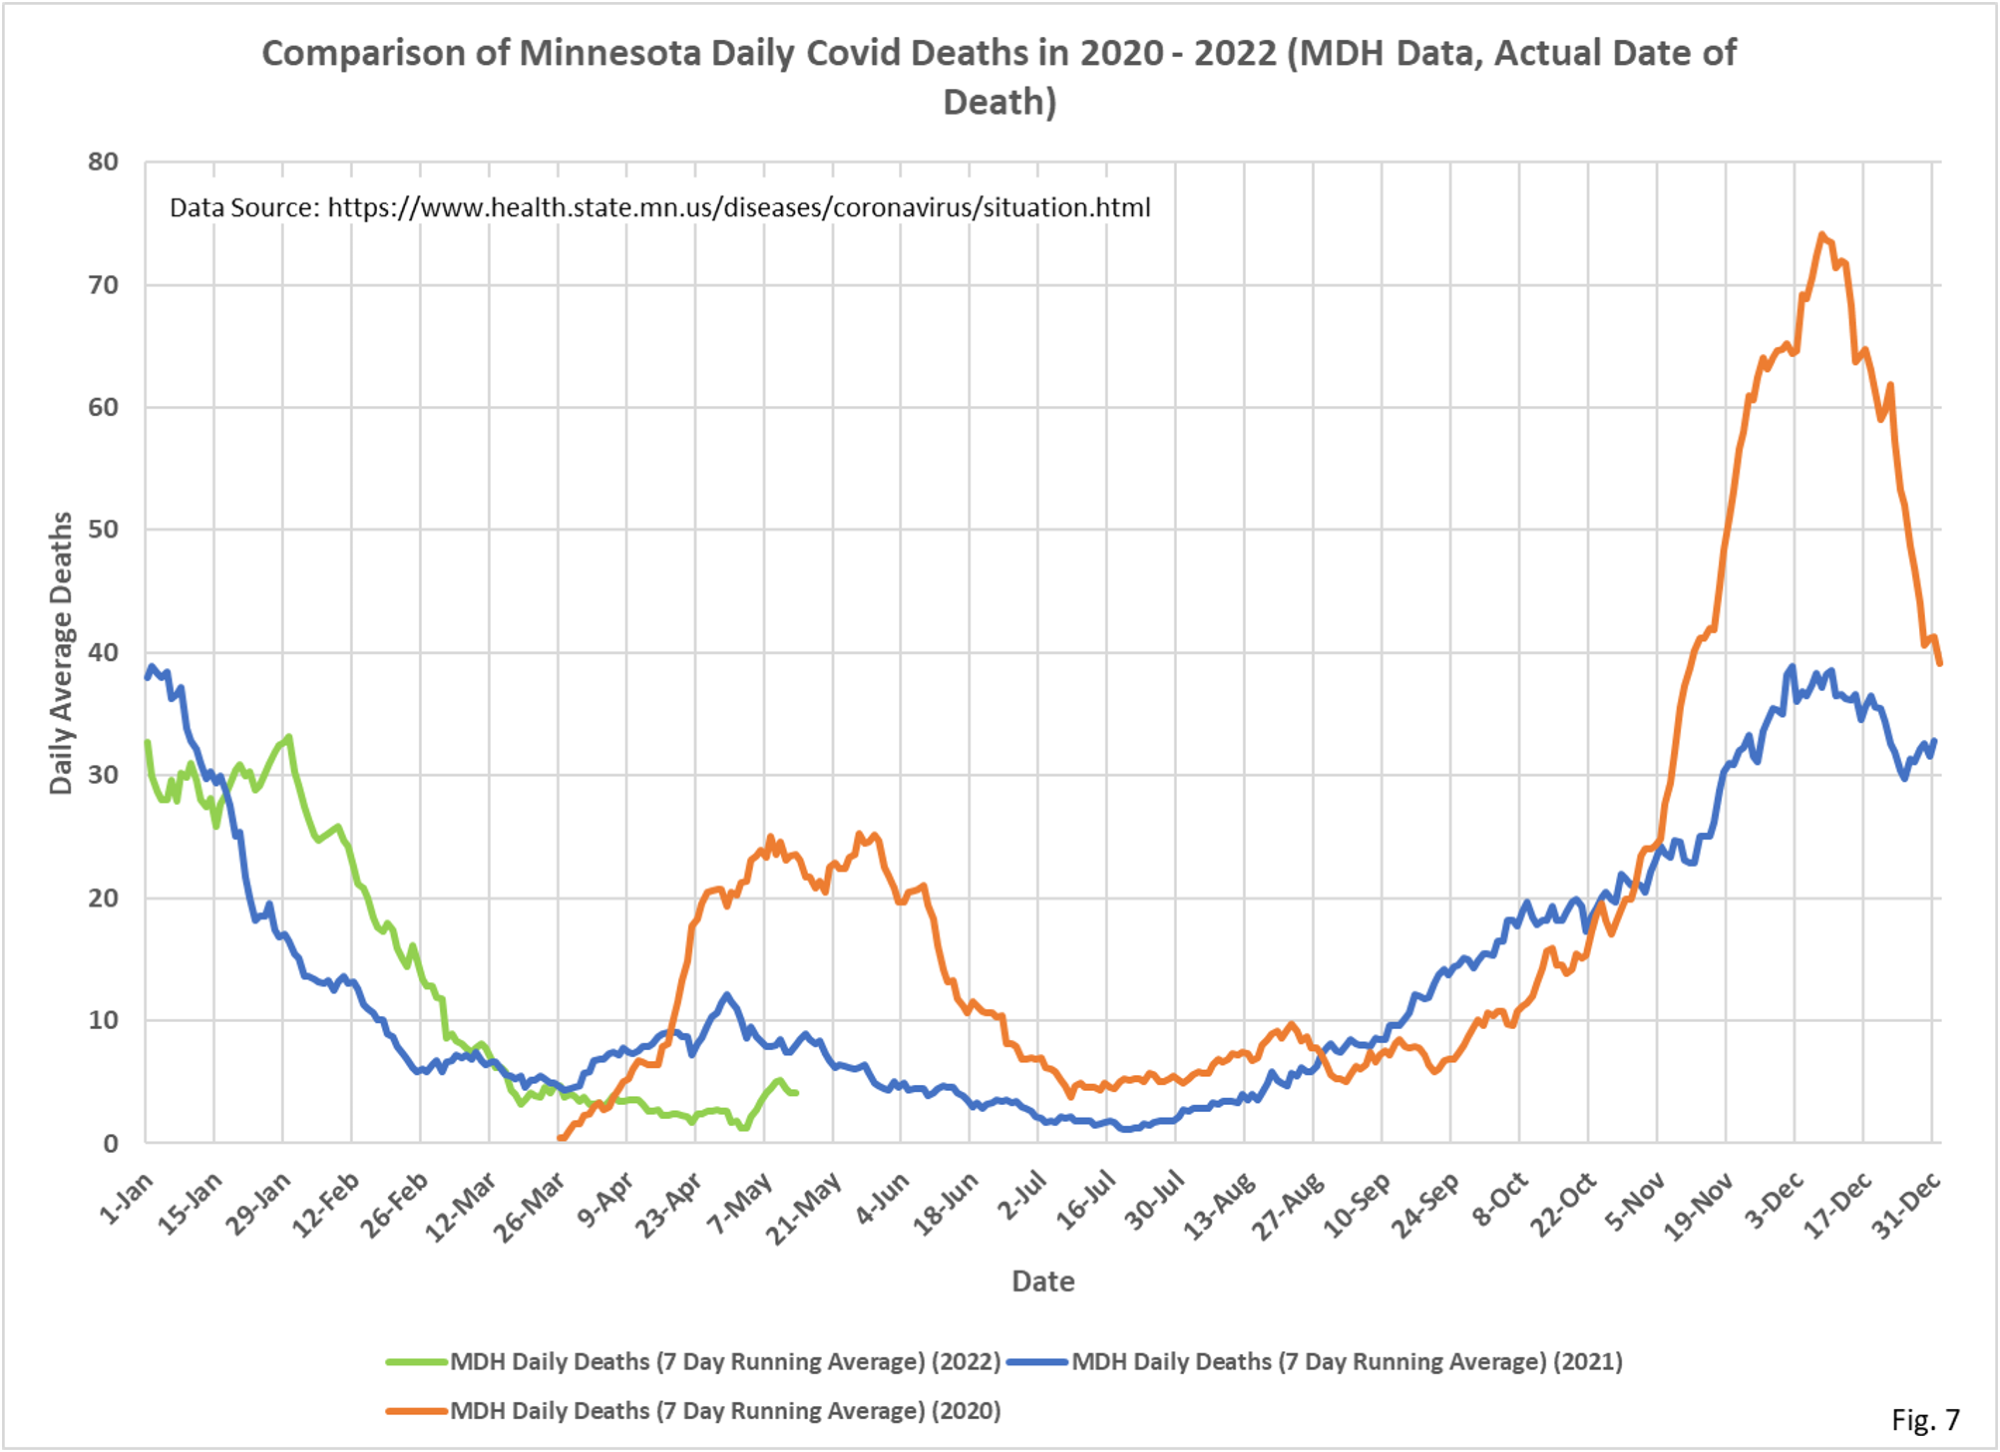
- Fig. 7: Deaths attributed to Covid have increased slightly in recent days. There were an average of 2.1 Covid deaths per day on 4/28/2022, but have risen to 5.1 deaths per day on 5/10/2022. Give the lag in reporting deaths these averages may rise as data reporting is completed.
- For all charts the last 7 days of data is excluded to avoid charting incomplete data.
- All data is taken from the Minnesota Department of Health Situation Update for OCVID-19 web page https://www.health.state.mn.
us/diseases/coronavirus/ situation.html and from the Response and Preparation web page https://mn.gov/covid19/data/ response-prep/response- capacity.jsp. - All data is shown as 7 day running averages.
