Hard to tell where this is headed. Kind of a plateau, we really don’t know what kind of staff is still processing events, we don’t know if there is any change in test reporting, we don’t know how many hospitalizations are incidentals, but it is a lot. So anecdotally, there is a huge case wave, but on the official statistics, we are kind of puttering along.


 Dave’s notes:
- Overall, Covid cases and ICU admissions appear to be peaking, while non-ICU admissions and deaths continue to rise.
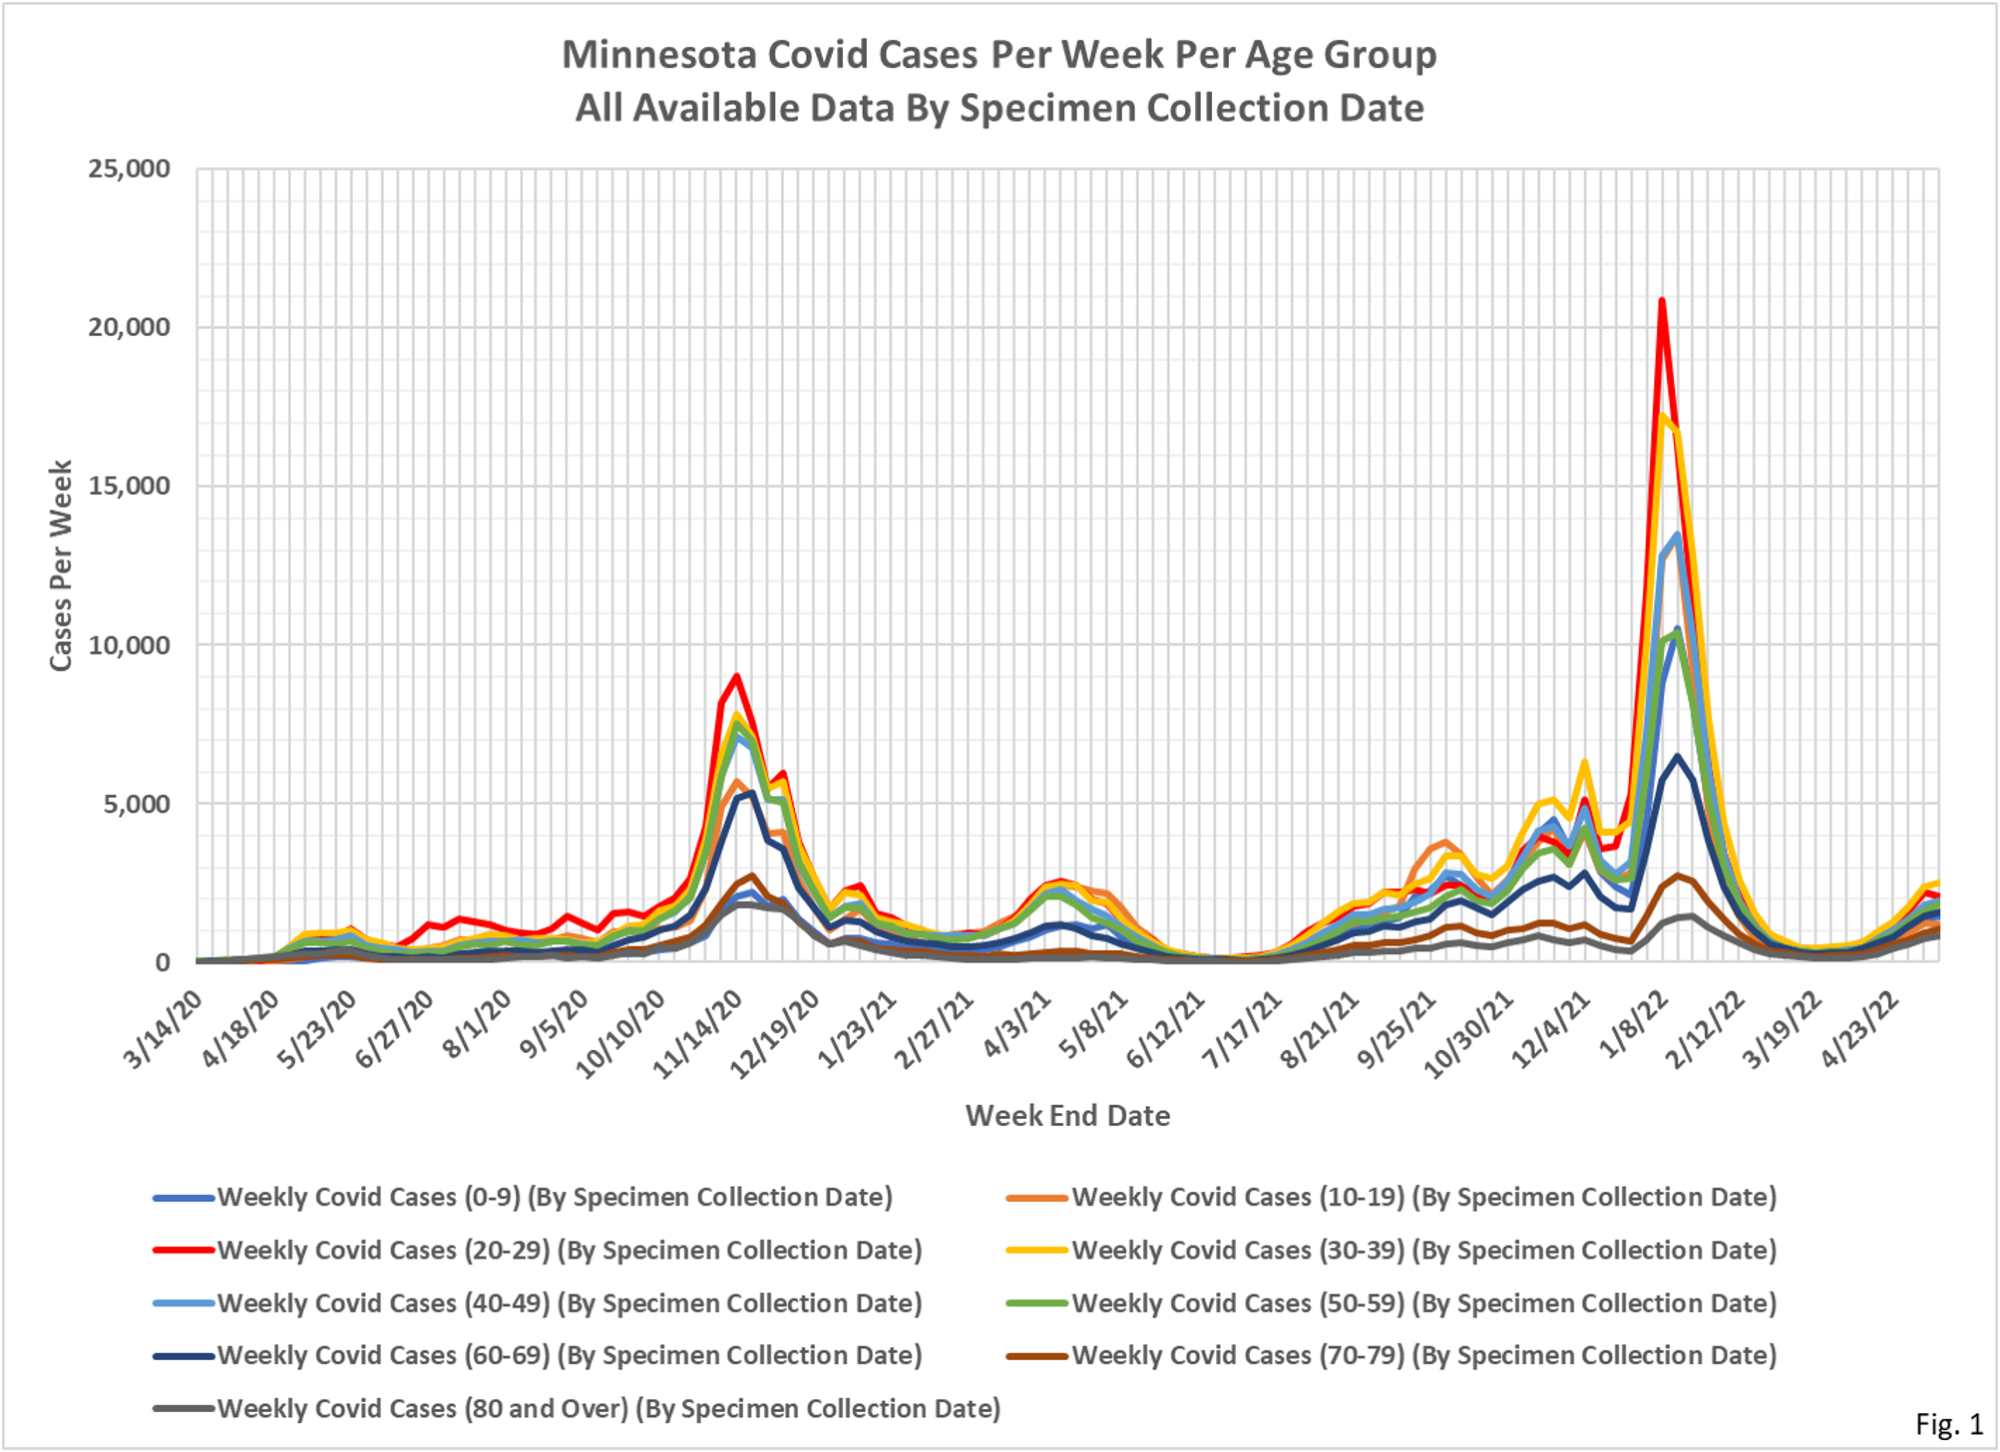
- Fig. 1 and 2: Covid Cases Per Week. The reported Covid cases this week are higher for all age groups except the 10-19 and 20-29 age groups. For the groups that were higher the rate of increase has moderated. Total reported cases for the week were 14,548 total for all age groups, an increase from the 13,781 revised cases reported last week, and 10,483 cases 2 weeks ago.
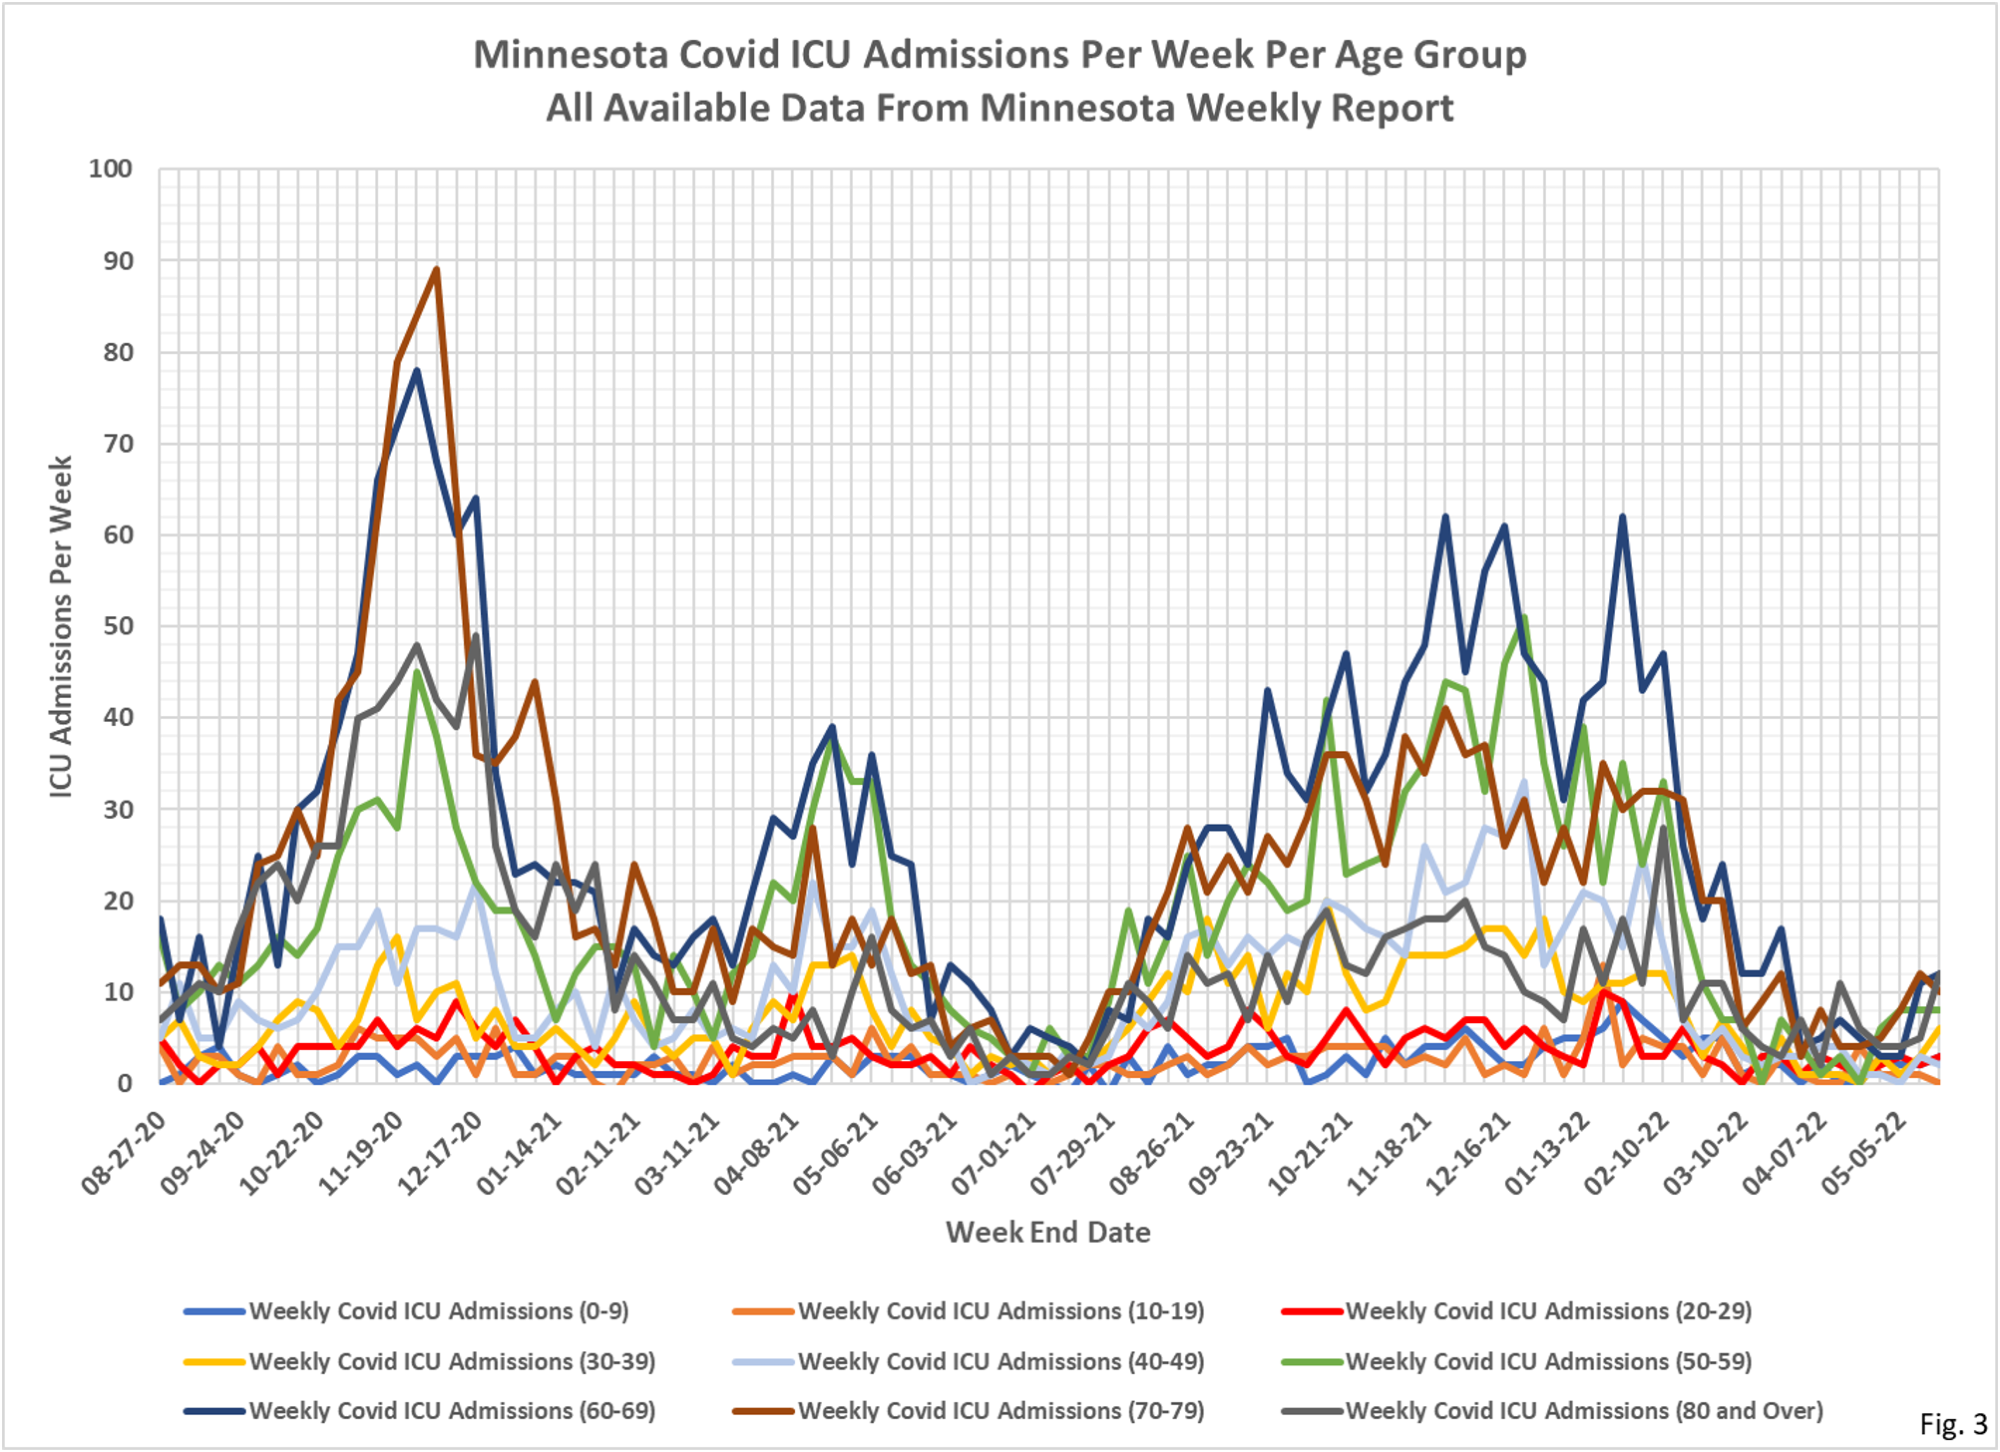
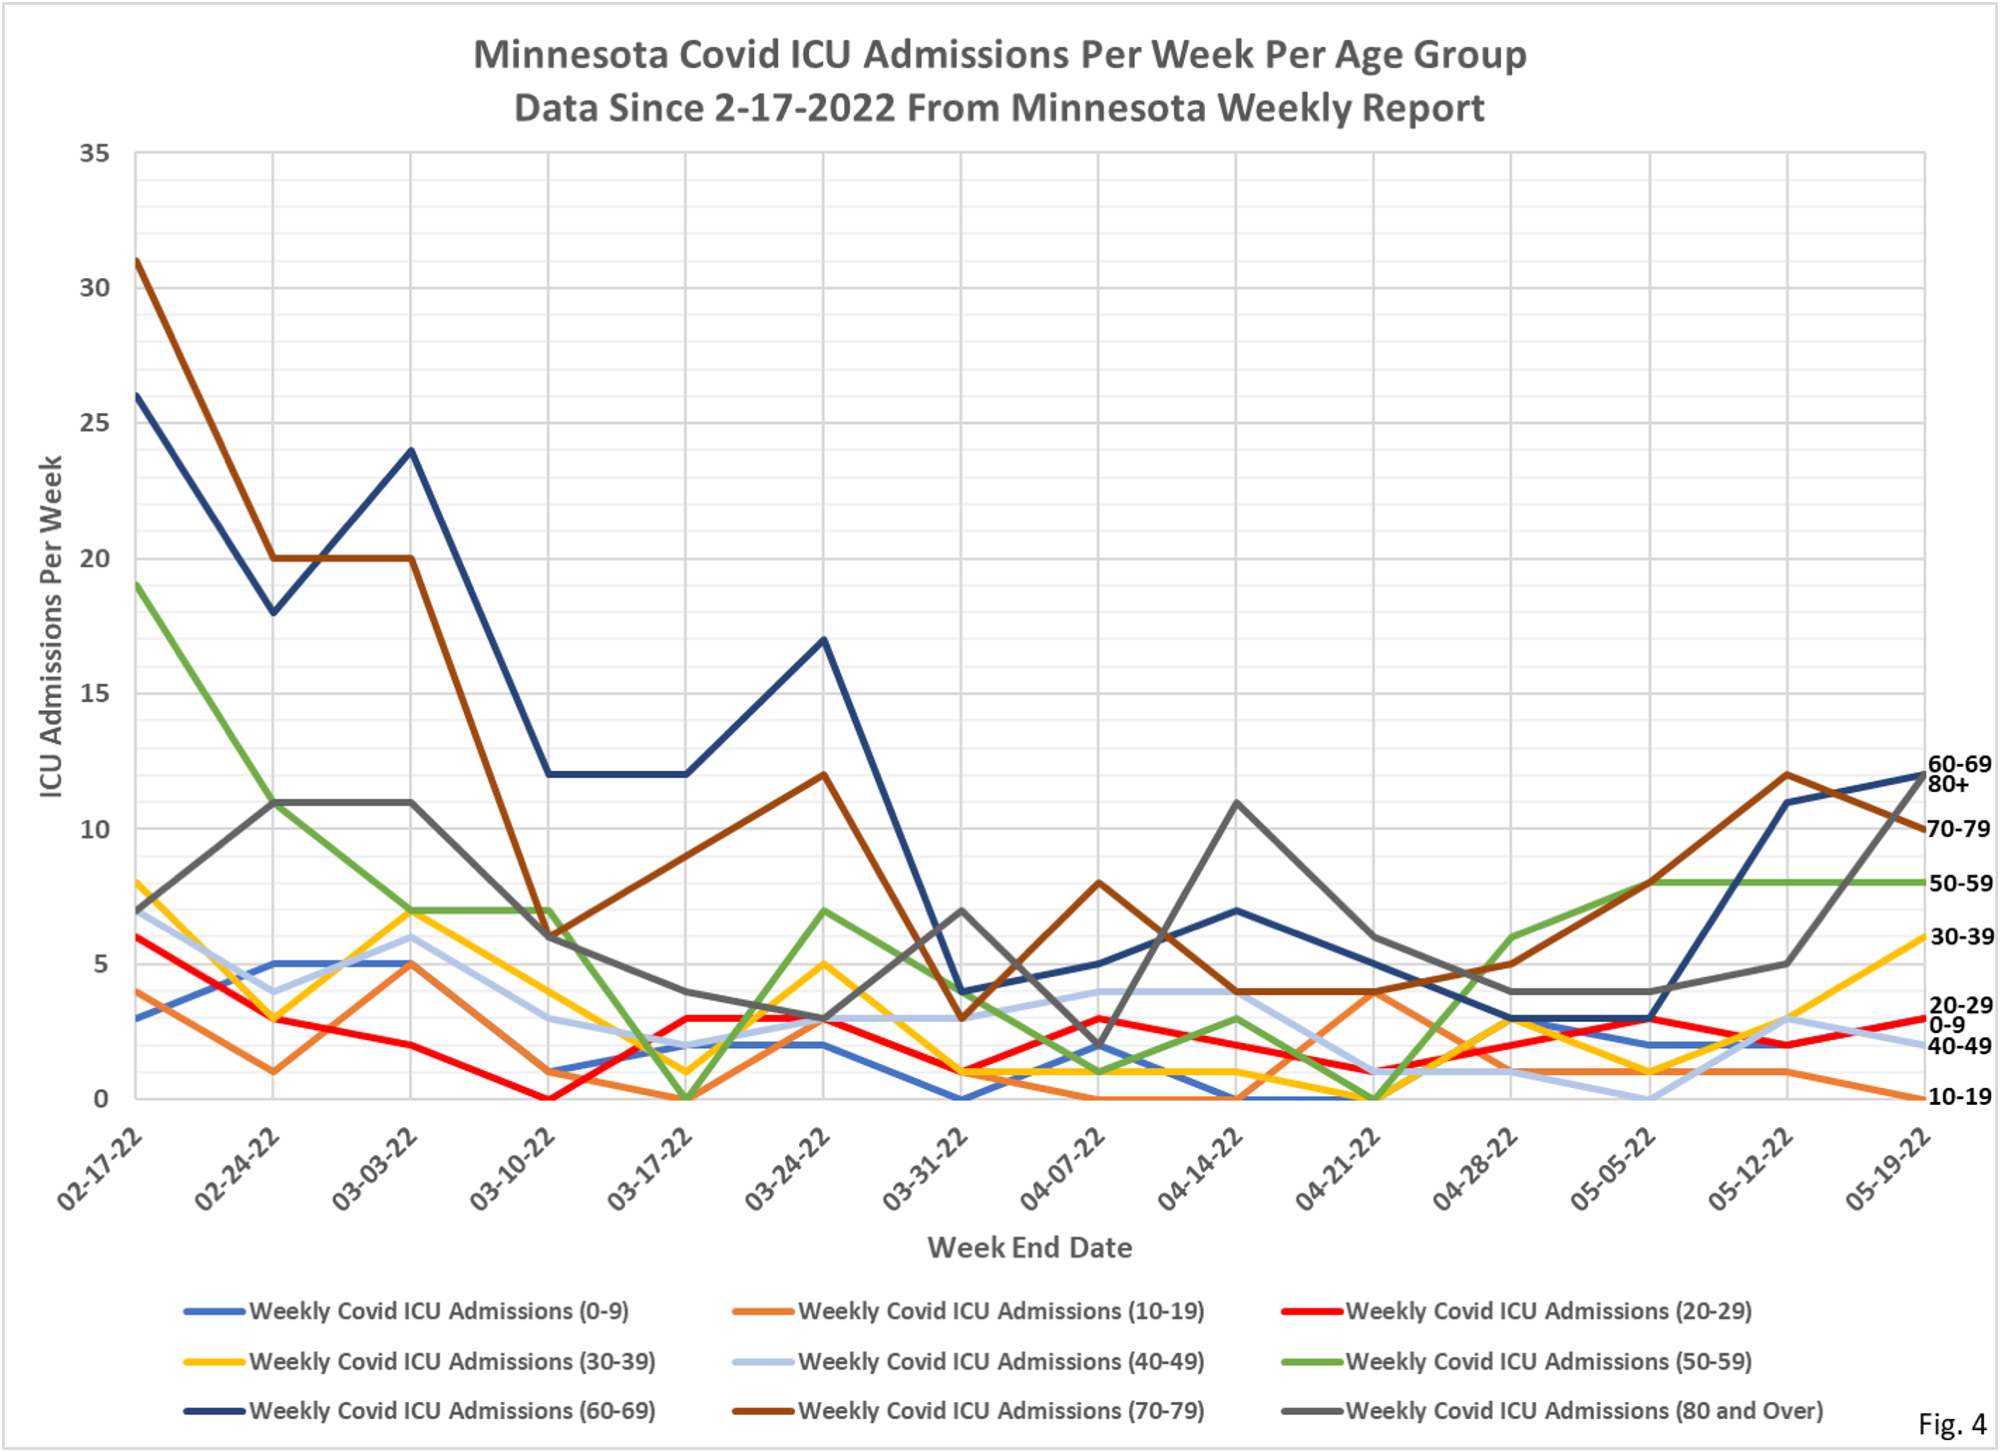
- Fig. 3 and 4: ICU Covid Admissions Per Week. Reported total ICU admissions for the week were 56, an increase of 9 from the total of 47 admissions reported last week. The 30-39 and 80+ age groups accounted for the bulk of the increases.
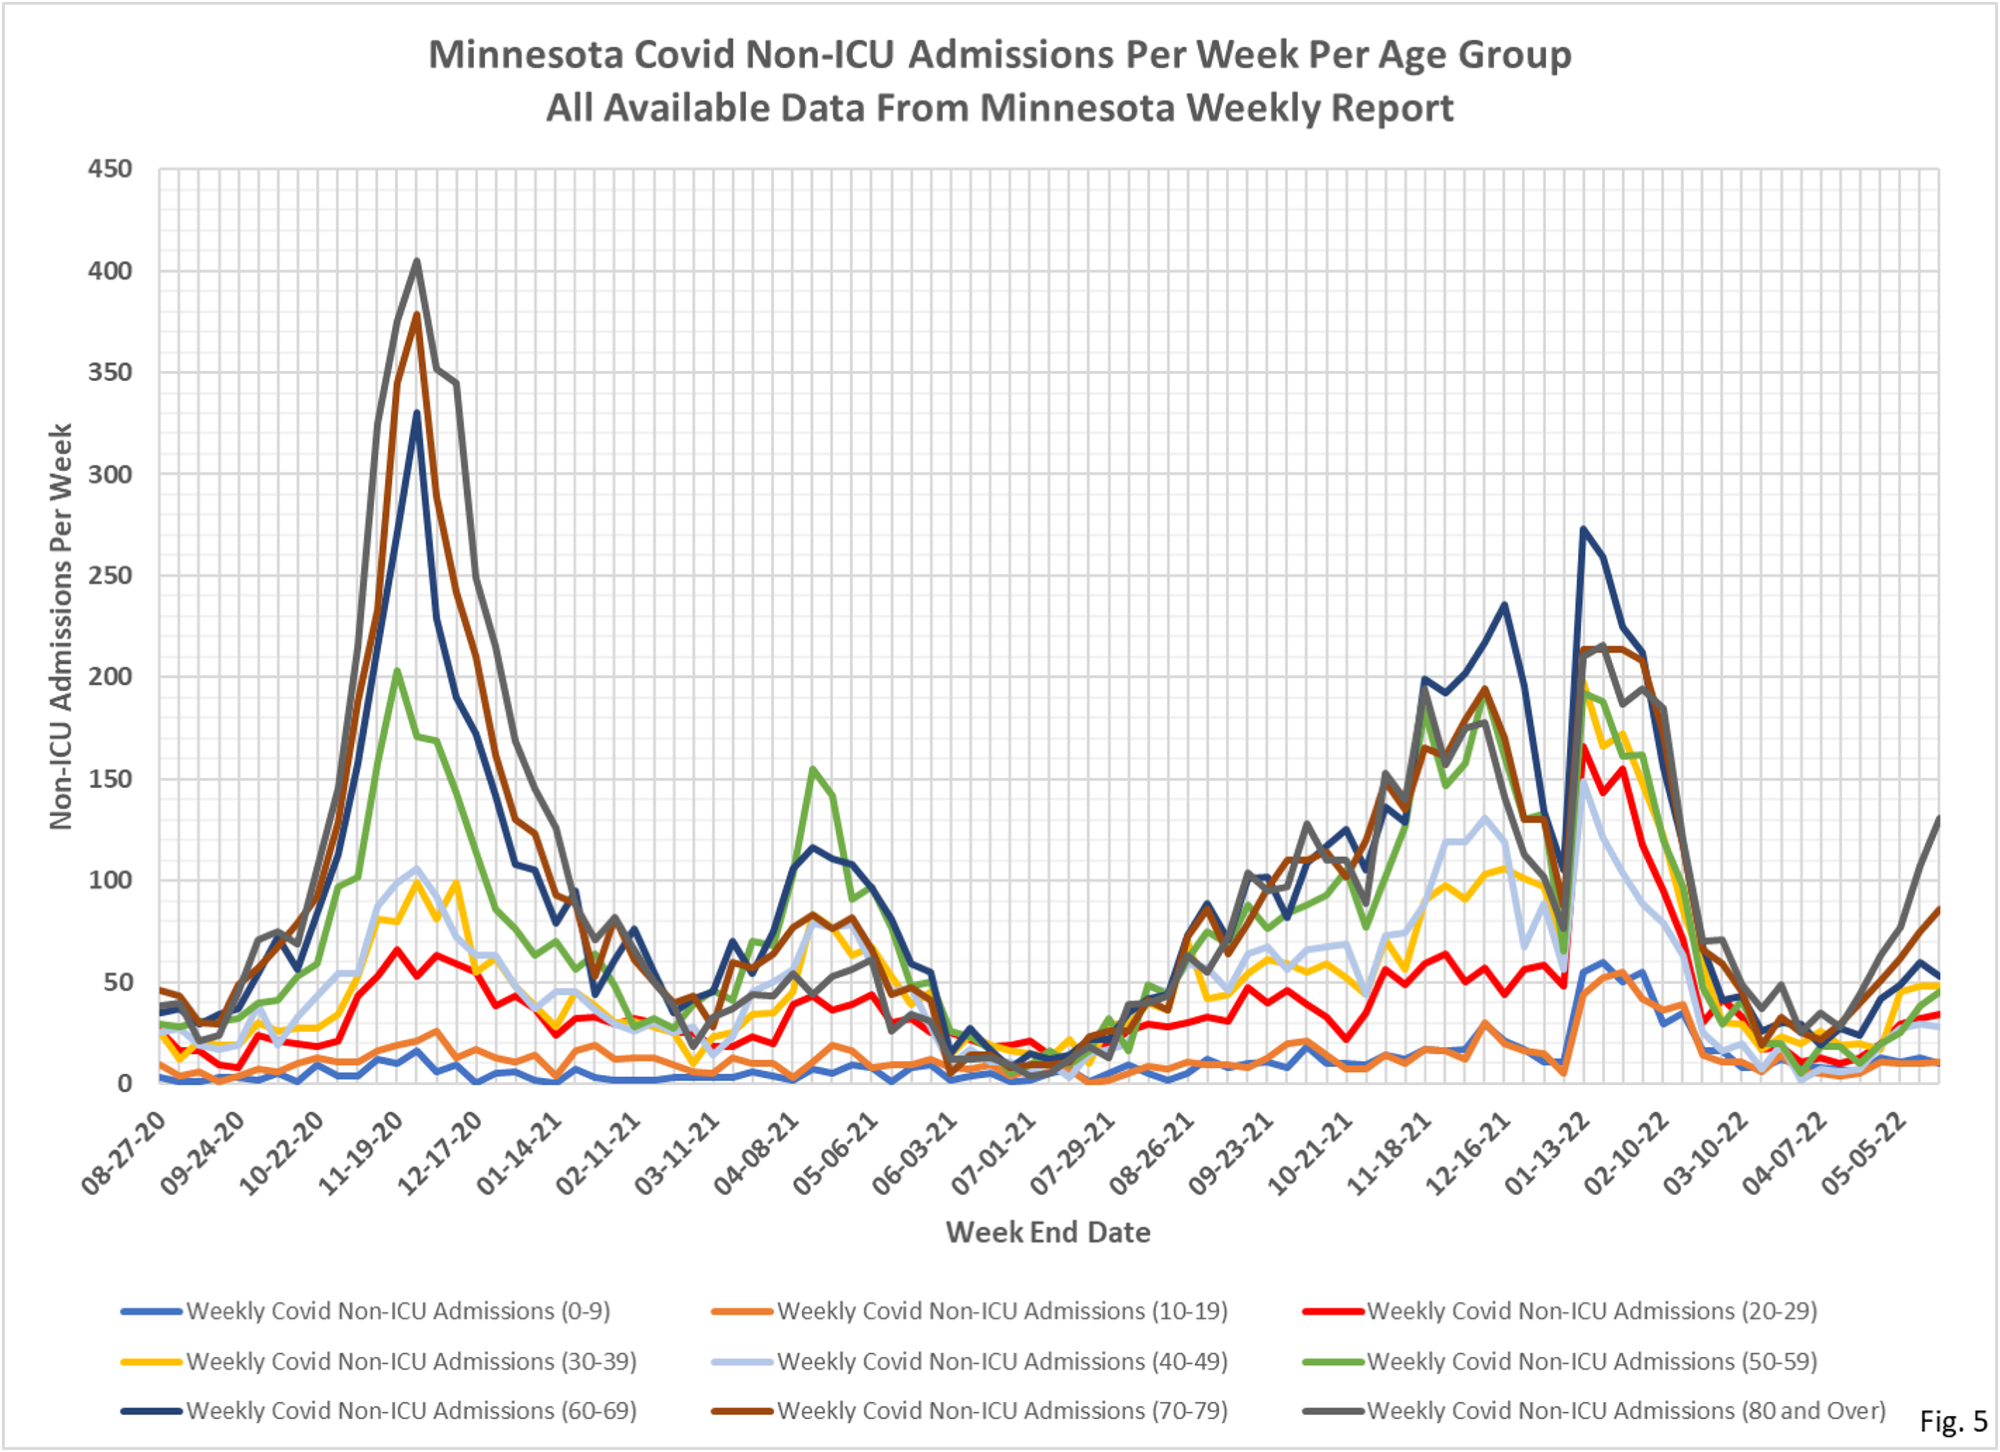
- Fig. 5 and 6: Non-ICU Covid Admissions Per Week. Reported total non-ICU admissions for the week were 446, up from 412 last week. The 70-79 and 80+ age groups accounted for the majority of the increase.
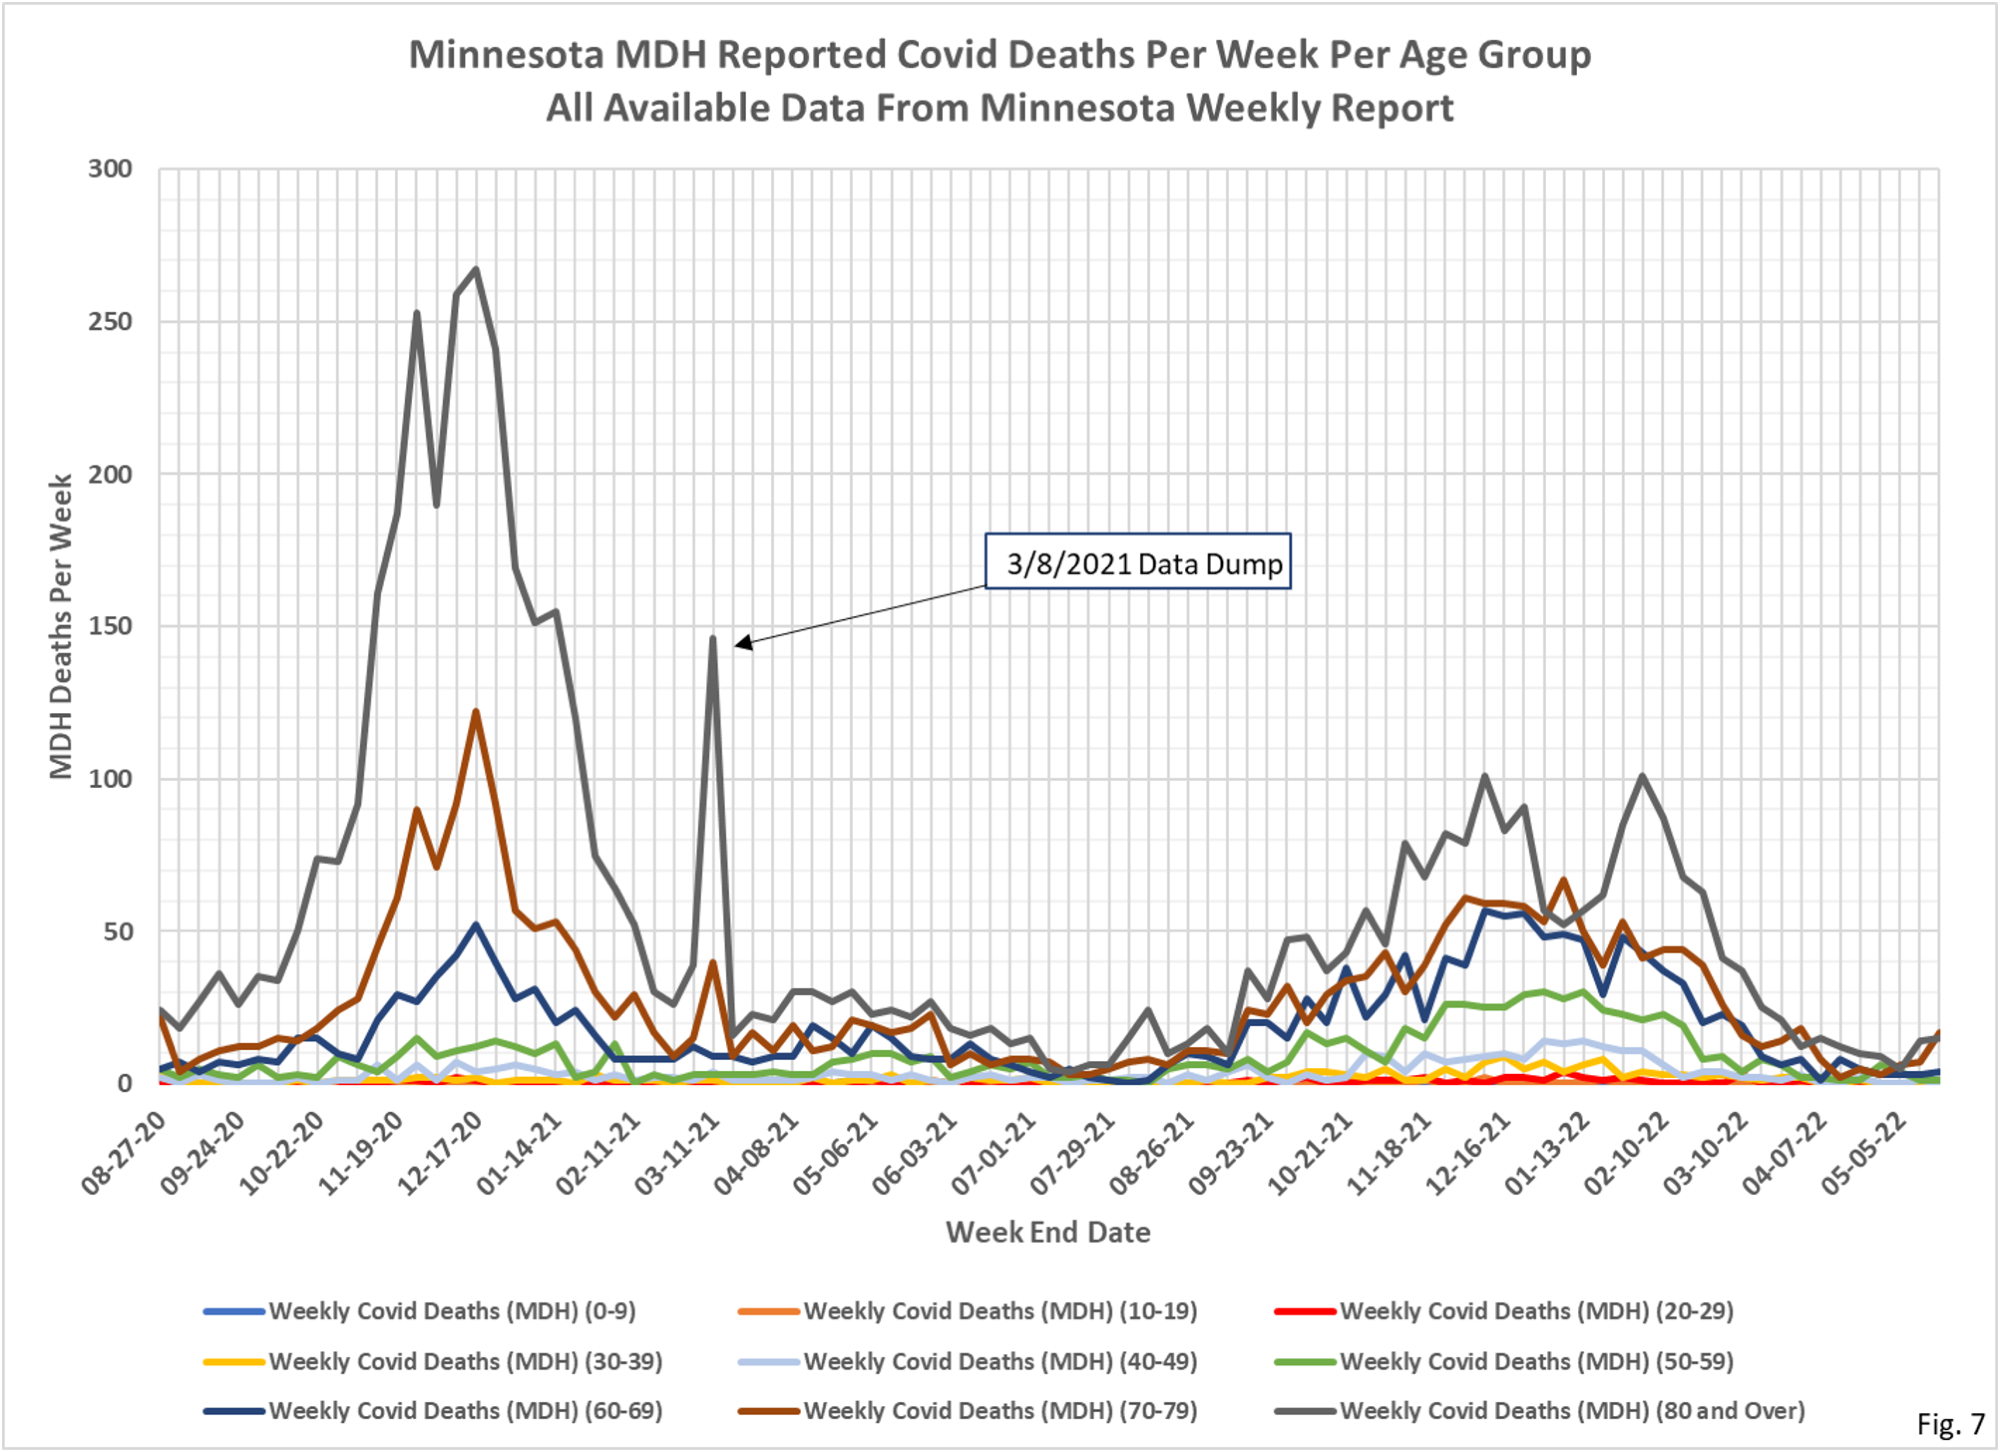
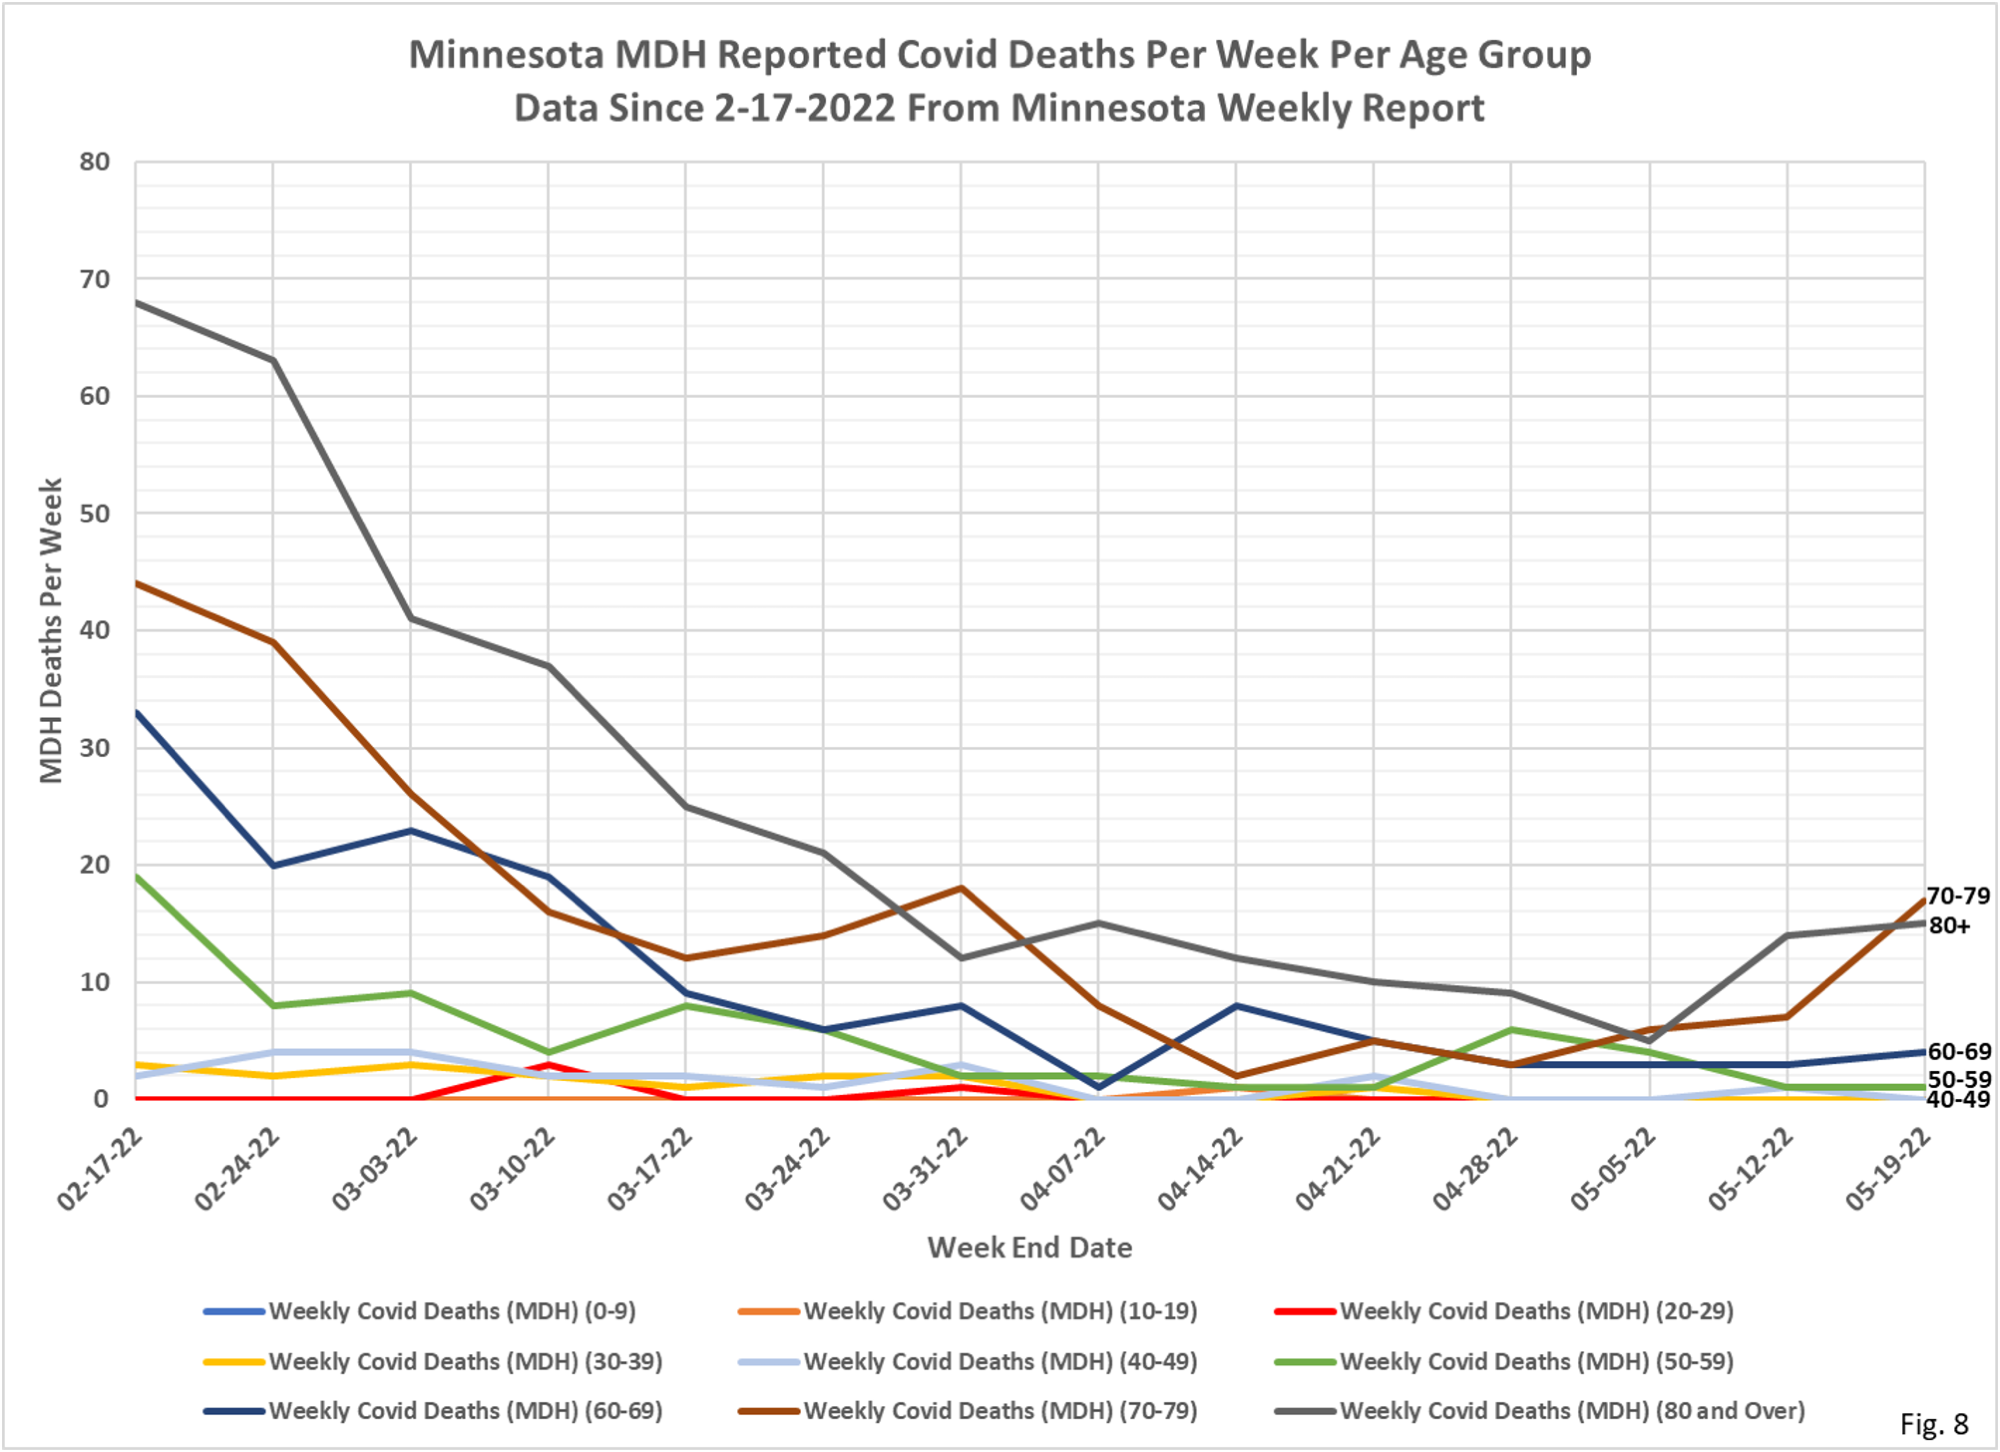
- Fig. 7 and 8: Covid Deaths Per Week. Total reported Covid deaths for the week were 37, an increase of 11 from the 26 reported deaths last week. The 70-79 age group increased sharply from 7 to 17 deaths, with the other age groups stable.
Data Sources:
The data for the charts on testing, hospital admissions, and deaths comes from the Minnesota Weekly Report (available here: https://www.health.state.mn.us/diseases/coronavirus/stats/index.html). The data in the Weekly Report is presented as cumulative totals for each data type each week. I am taking weekly differences and assembling the data into charts. This data is by date of report, meaning the charts are documenting new events reported this week, even though the underlying event occurred sometime in the past. The data is provided for 5 year age groups, and I am assembling into 10 year age groups to make the charts more readable.
The data for the Covid cases per week come from a data file published along with the Minnesota Weekly Report, here: https://www.health.state.mn.us/diseases/coronavirus/stats/index.html#wagscd1 This data is published by date of specimen collection, rather than by date of report as the other data is. The data is provided as cases per week in 5 year age groups. I am compiling the data into 10 year age groups in order for the charts to be more readable. This data is updated by date of specimen collection, so it is possible that past week’s data will be updated.
