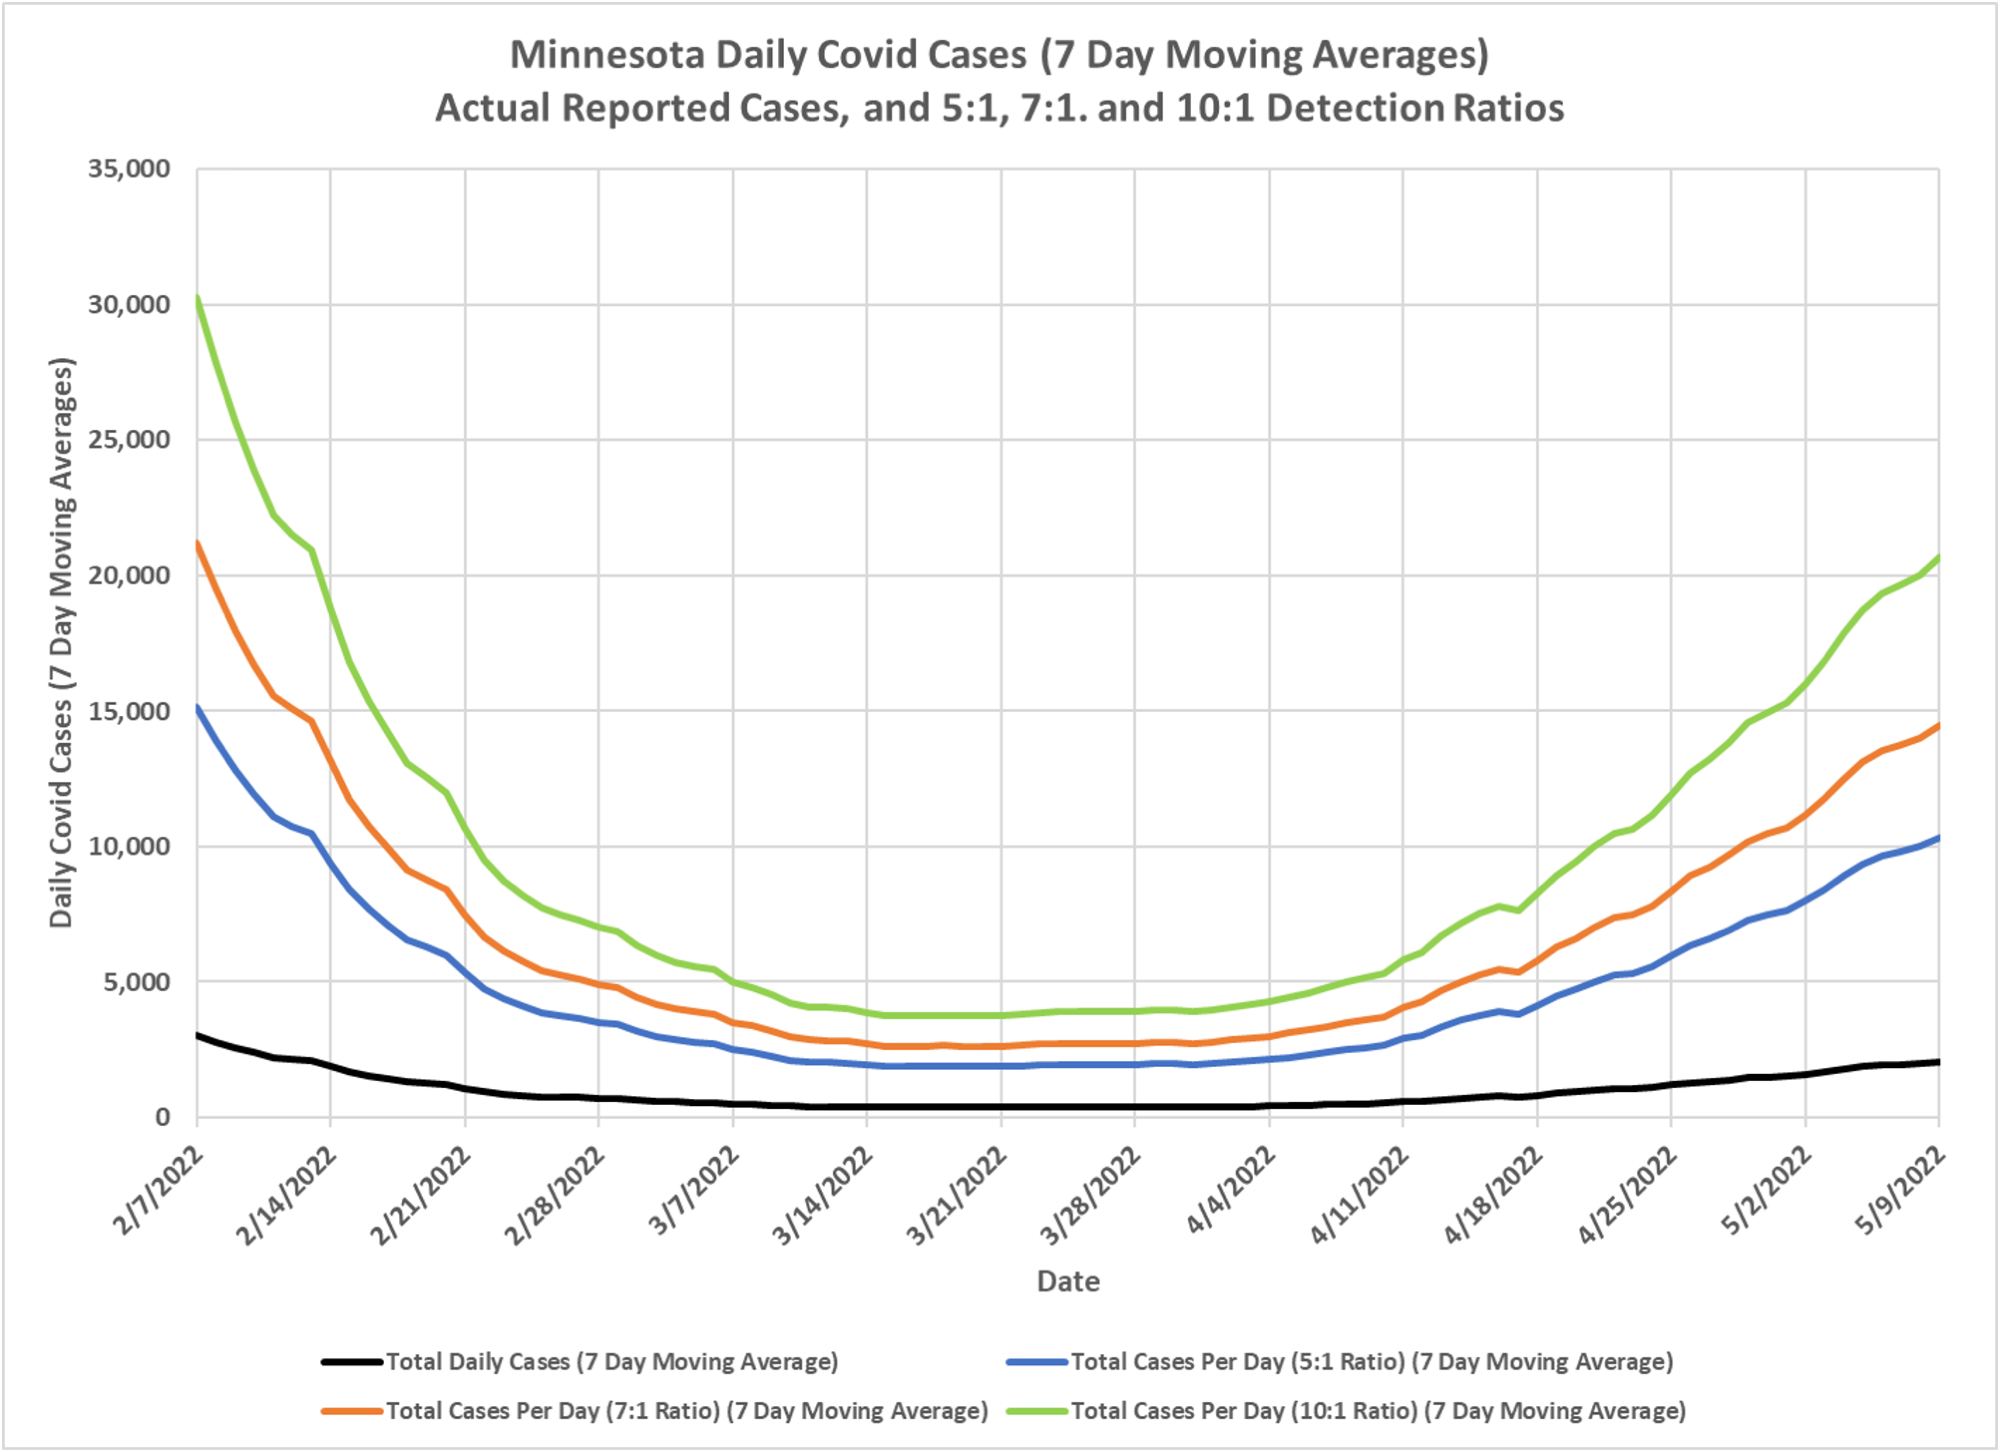
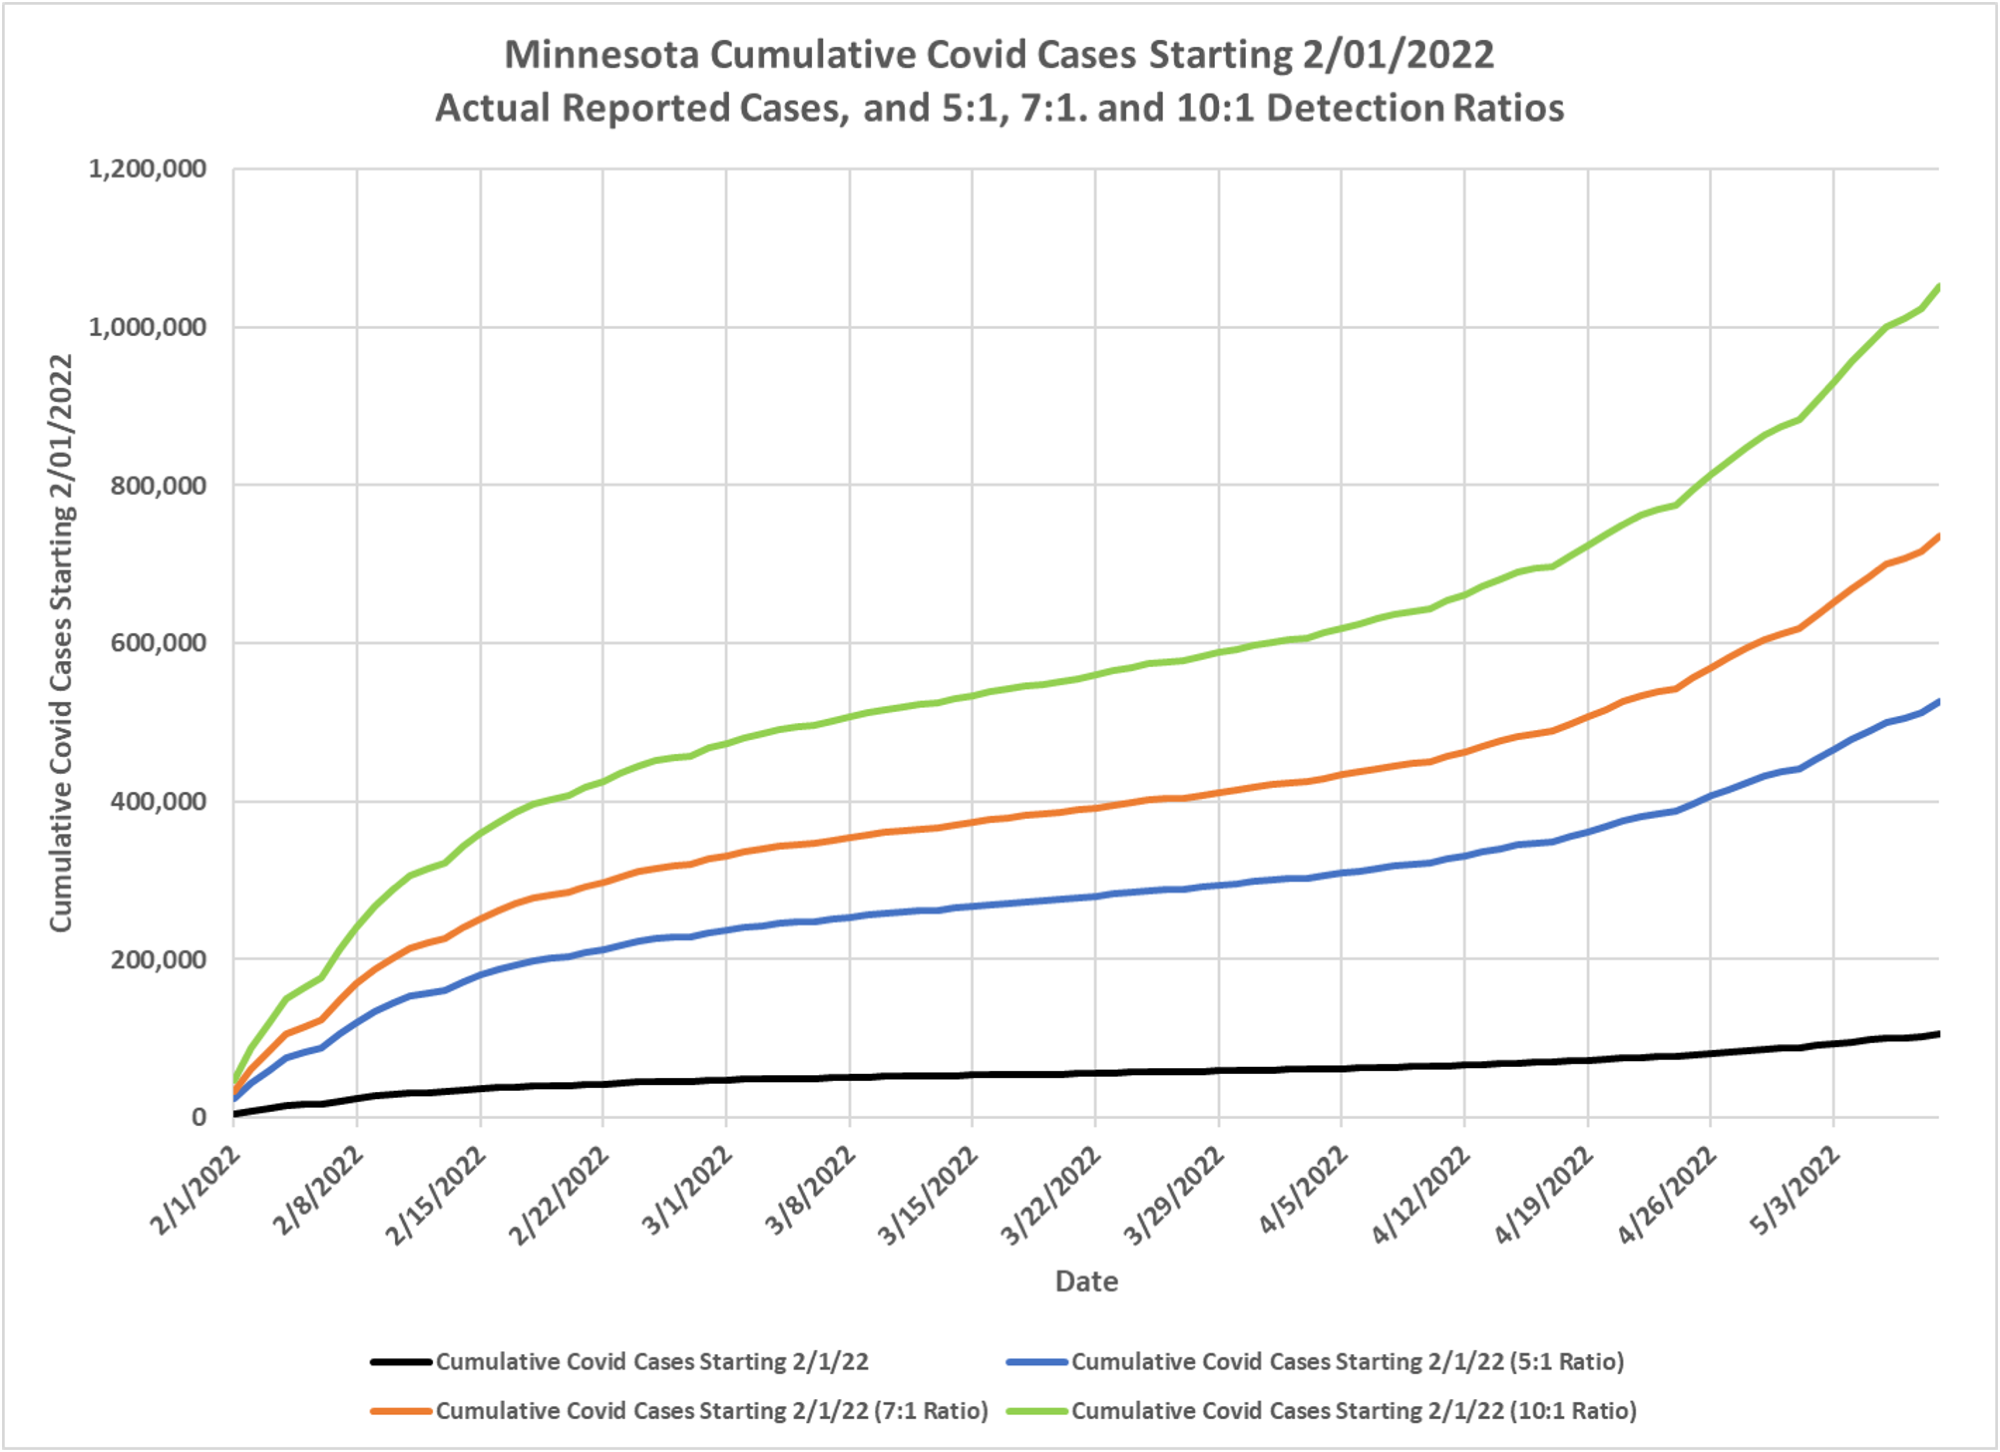
My extended family has had eight CV-19 infections in the last three weeks. Everyone who could get vaccinated was, most with boosters. Of those eight infections only one is going to show up in the official statistics. This ratio of undetected to detected cases is not unusual in an era of home testing and extremely mild infections. And it is consistent with the emerging research. So we thought it would be useful to show what the current case wave would look like at an undetected to detected ratio of 5:1, 7:1 or 10:1, for the time period from February to now. Dave quickly did his usual outstanding work. You can see that this wave under any scenario does not have the sharp up of other waves. So it may just be a long lingering one. Certainly hasn’t peaked yet.
One interesting aspect is that it doesn’t appear that the wastewater sampling is capable of helping figure out the true ratio. I suspect this is because average viral load and load persistence is down substantially and you would need constant loads and period of infectiousness for the wastewater sample to tell you anything other than some gross (pun intended) notion of what case levels are.
Here is the underlying reality: we are all (except me apparently) going to get “infected” repeatedly, just like we do with all the other coronaviruses and respiratory viruses. If we stopped all testing tomorrow, no one would know the difference. If you assume that either the 7:1 or 10:1 ratio reflects reality, then the other thing you need to do is reduce the hospitalization and death case rates by the inverse. This is far less serious than influenza.