More sterling work from Dave Dixon as our epidemic of the vaccinated marches on, notwithstanding lags and delays in processing and identification of breakthrough events by our over-funded DOH. They are in no hurry for people to realize that vaccine effectiveness is zero for infection and dwindling for hospitalization and death. Despite DOH’s dilatoriness, it is obvious that the vast majority of all events are now in the vaxed.
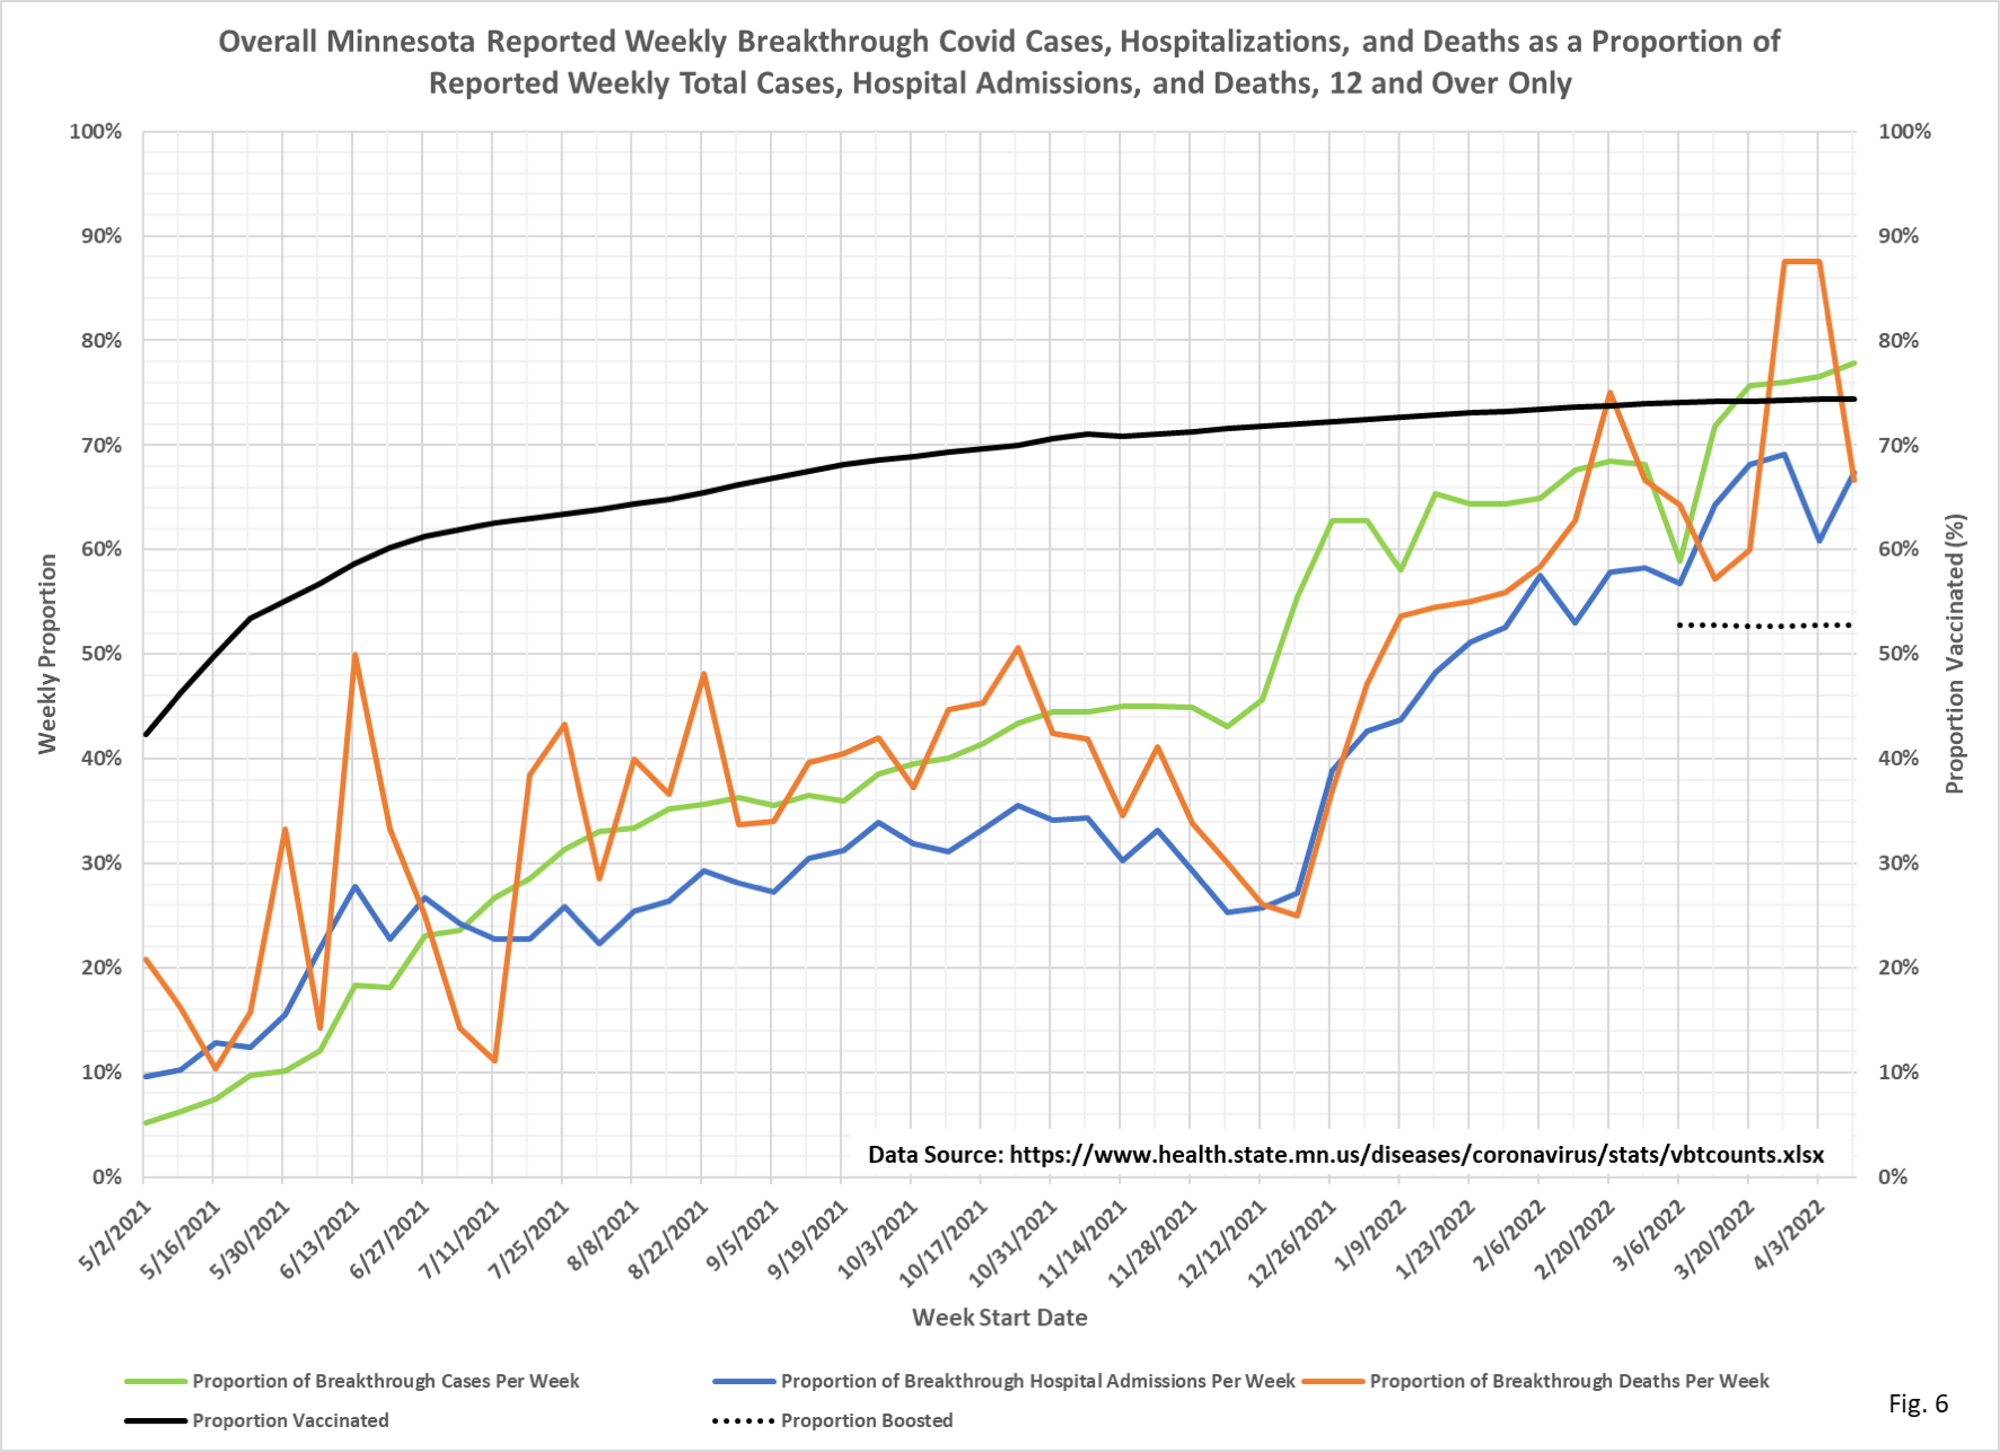
Please look at the last chart, see that line for percent of the population vaxed. See those lines for events. See how close they are. That is your pictorial representation of falling vaccine effectiveness.
 Dave’s notes:
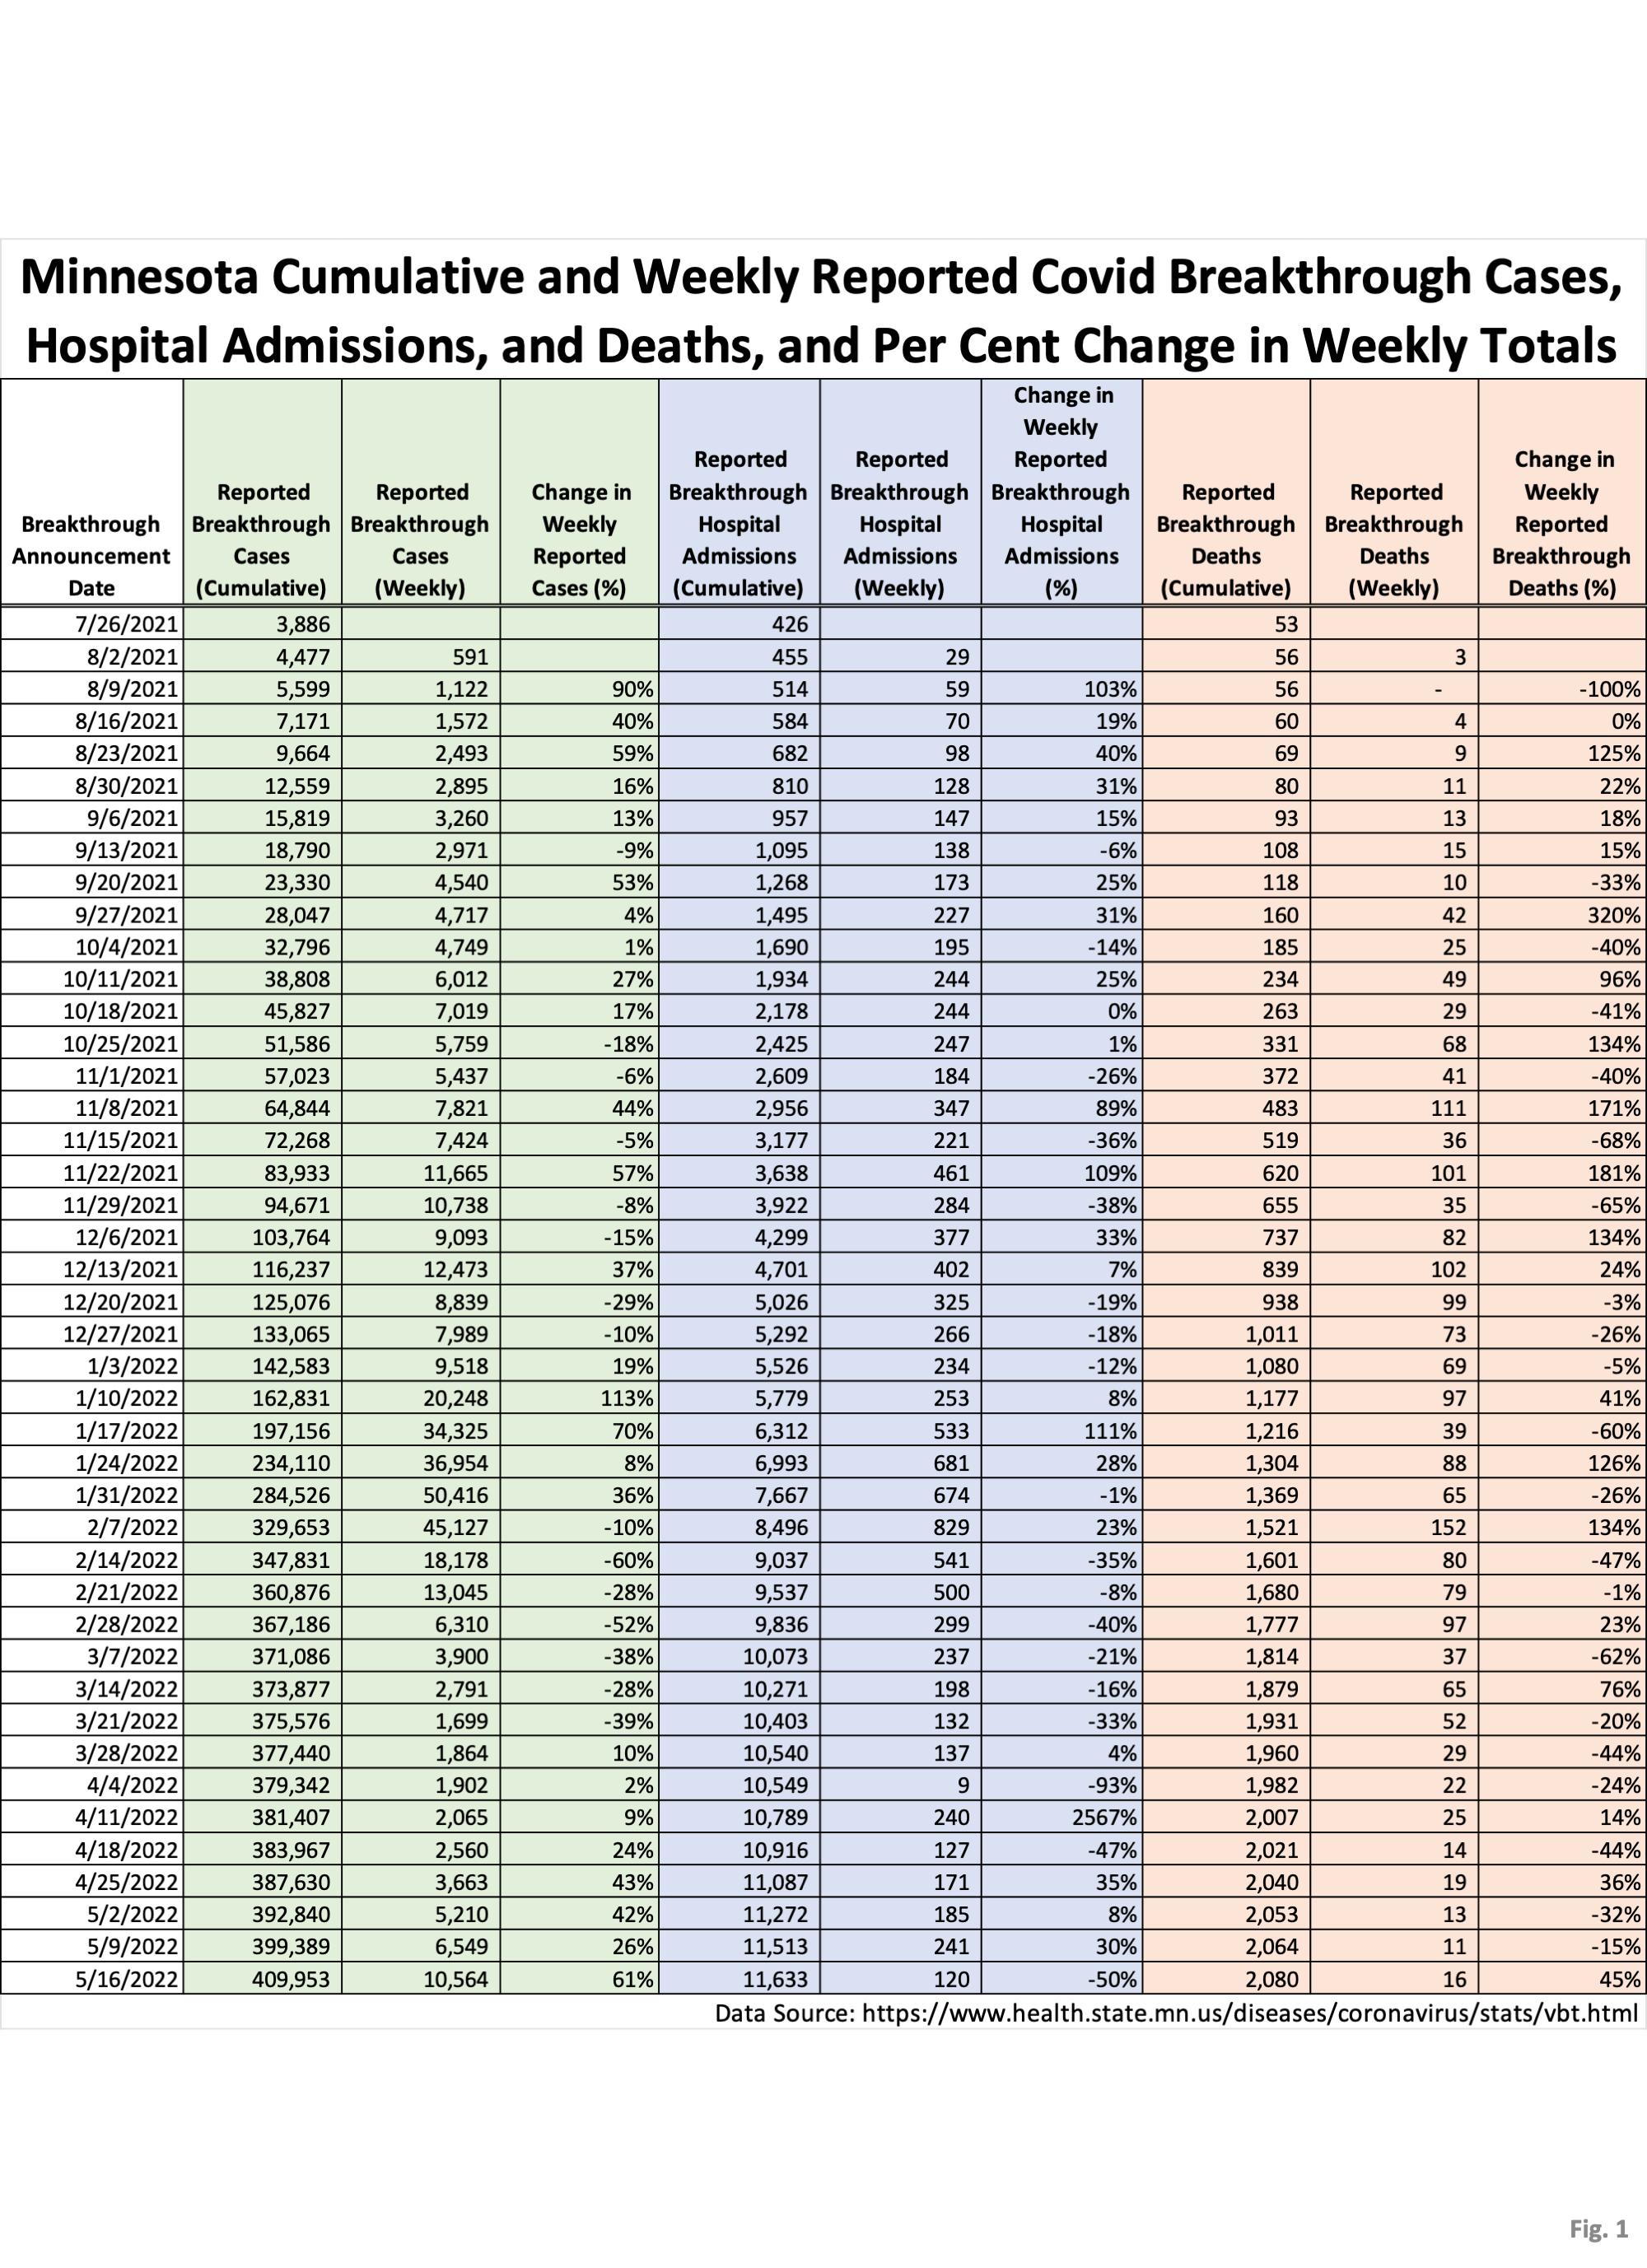
- Fig. 1: This table is the weekly announced cumulative breakthrough cases, hospital admissions, and deaths, as well as the weekly totals, and change in weekly totals, as published on the Vaccine Breakthrough Update web page https://www.health.state.mn.
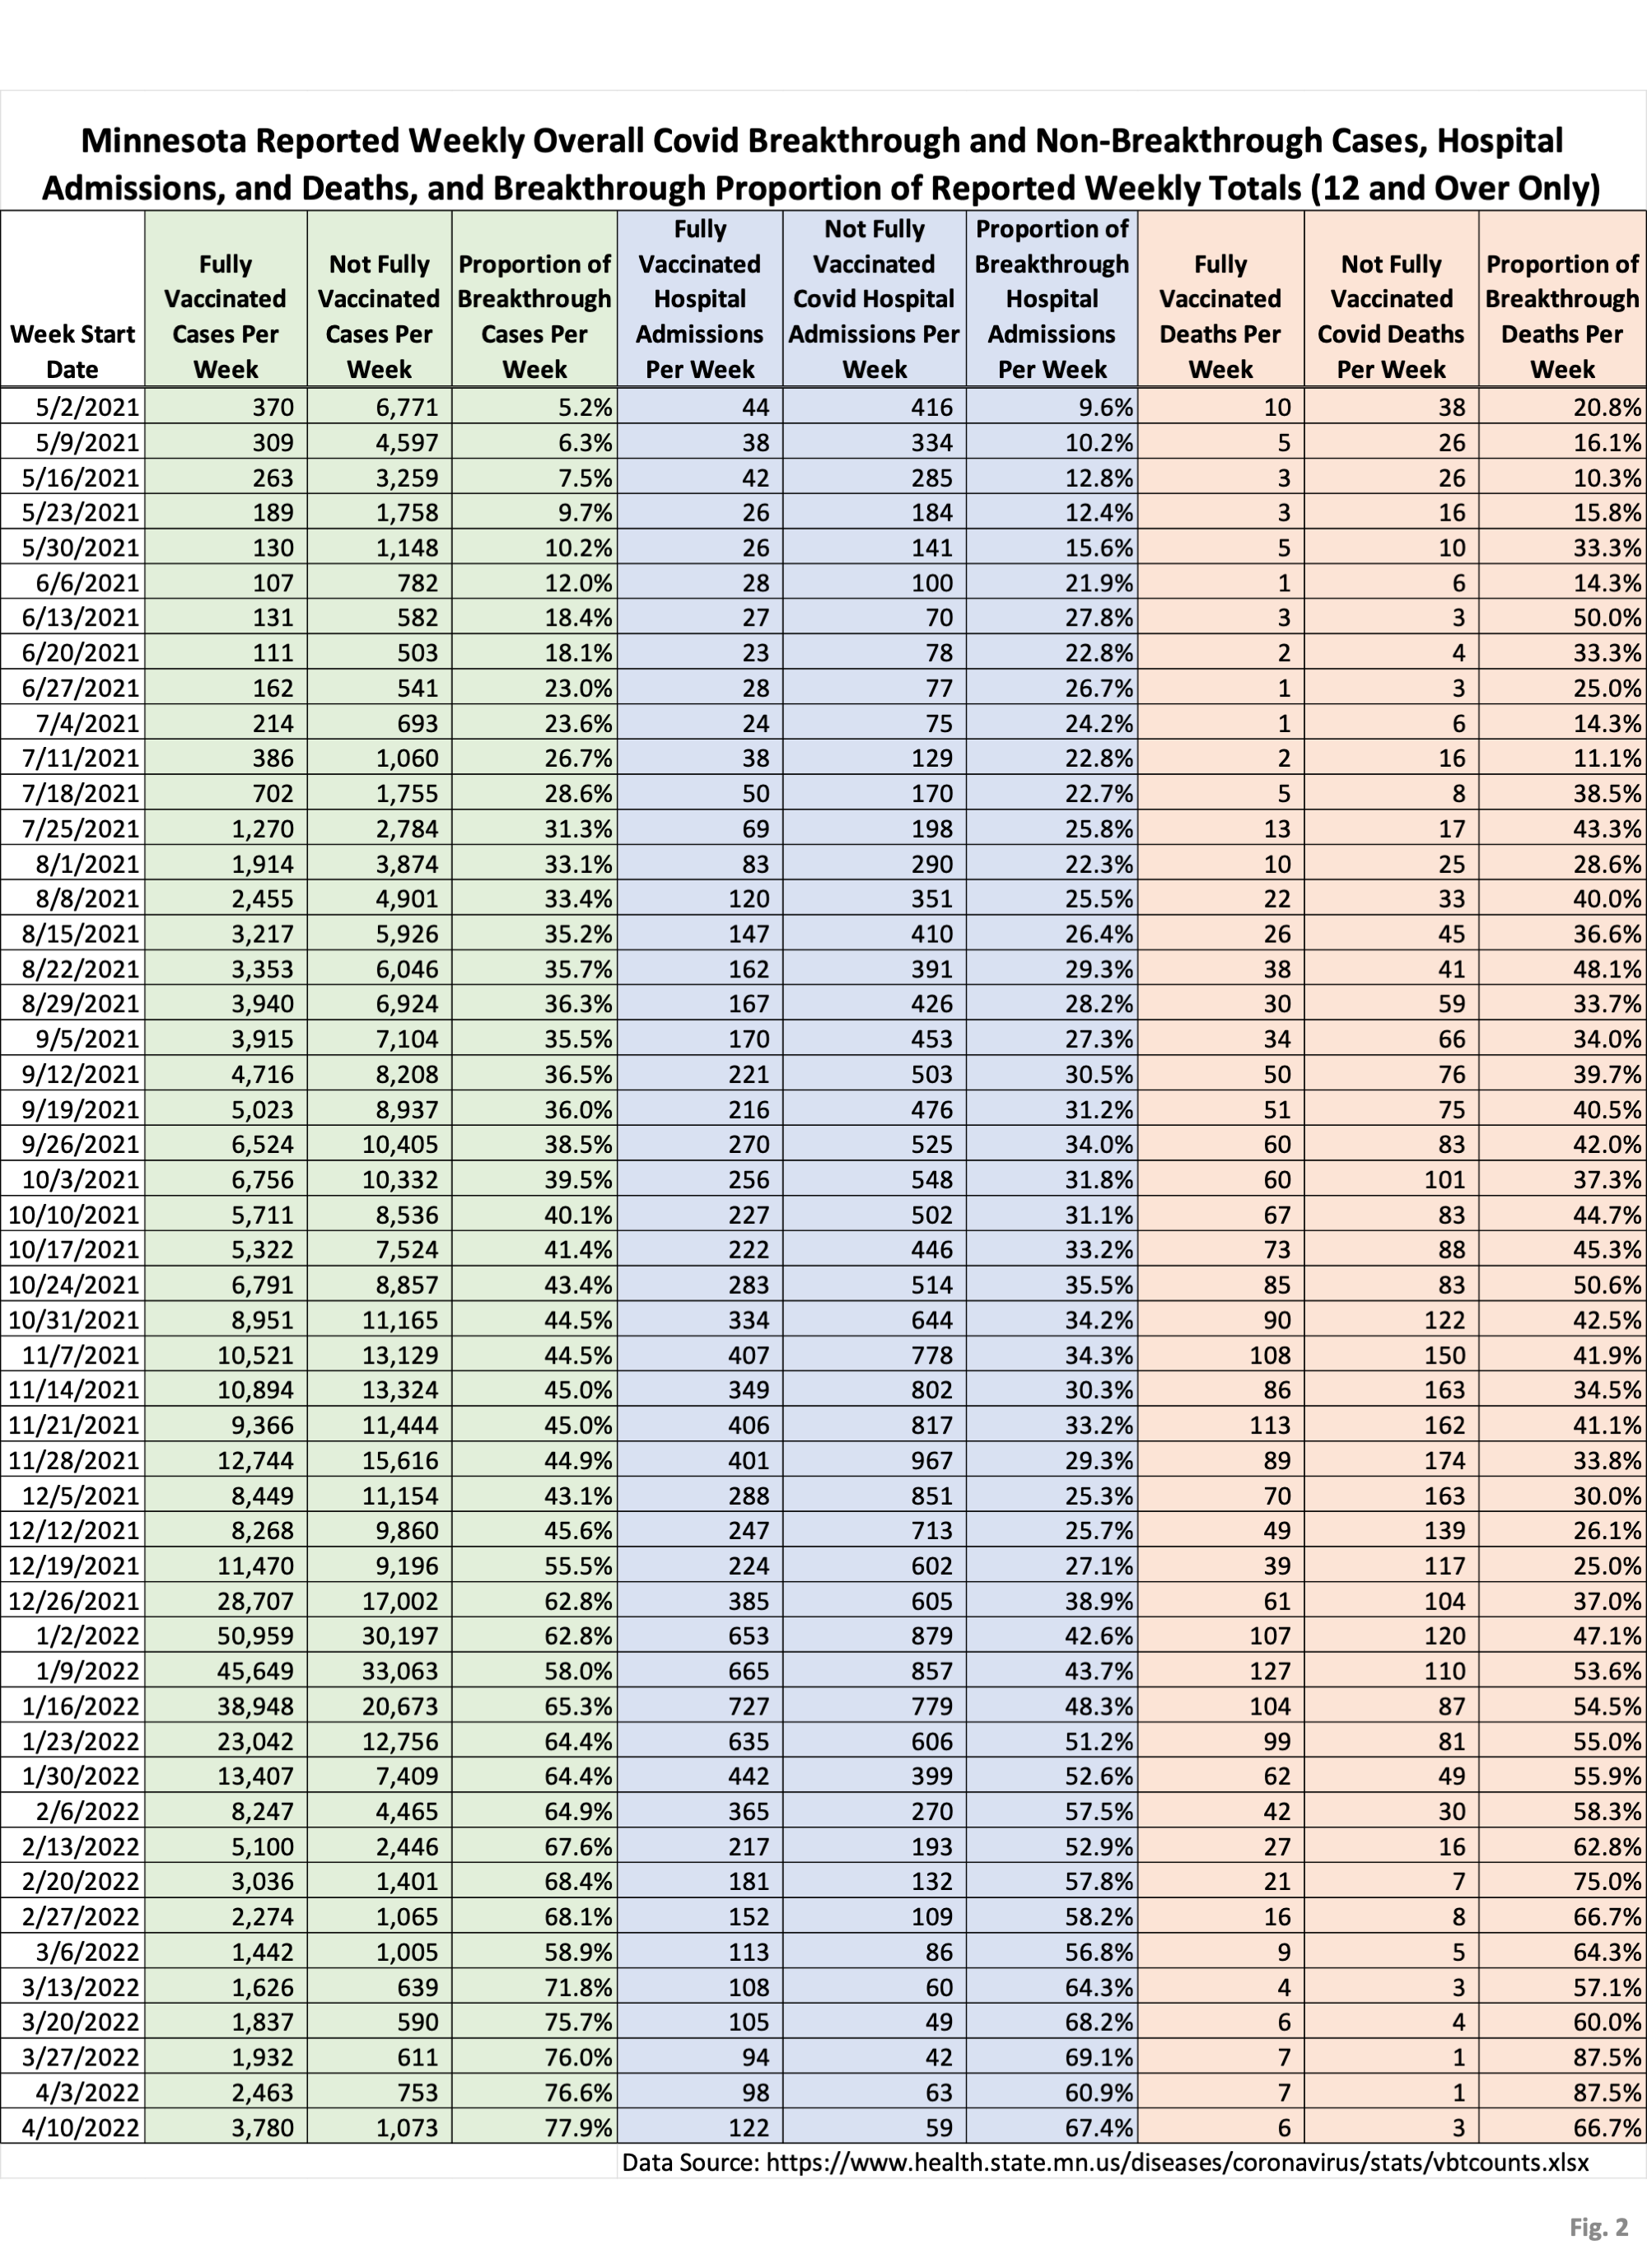
us/diseases/coronavirus/stats/ vbt.html. New breakthrough cases announced on 5/16/2022 total 10,564 cases, up from 6,549 new breakthrough cases last week. Newly reported breakthrough cases have now been increasing for 8 weeks in a row. Newly reported breakthrough hospital admissions total 120 for the week. New breakthrough deaths totaled 16, compared to 11 reported breakthrough deaths last week. - Fig. 2: This table displays the total cases, hospital admissions, and deaths that occurred each week among the vaccinated and unvaccinated populations, with the latest week of 4/10/2022 added to the report. These numbers are taken from the vbtcounts.xlsx data file published by MDH on the Vaccine Breakthrough Update web page, and only include data for those 12 and over.
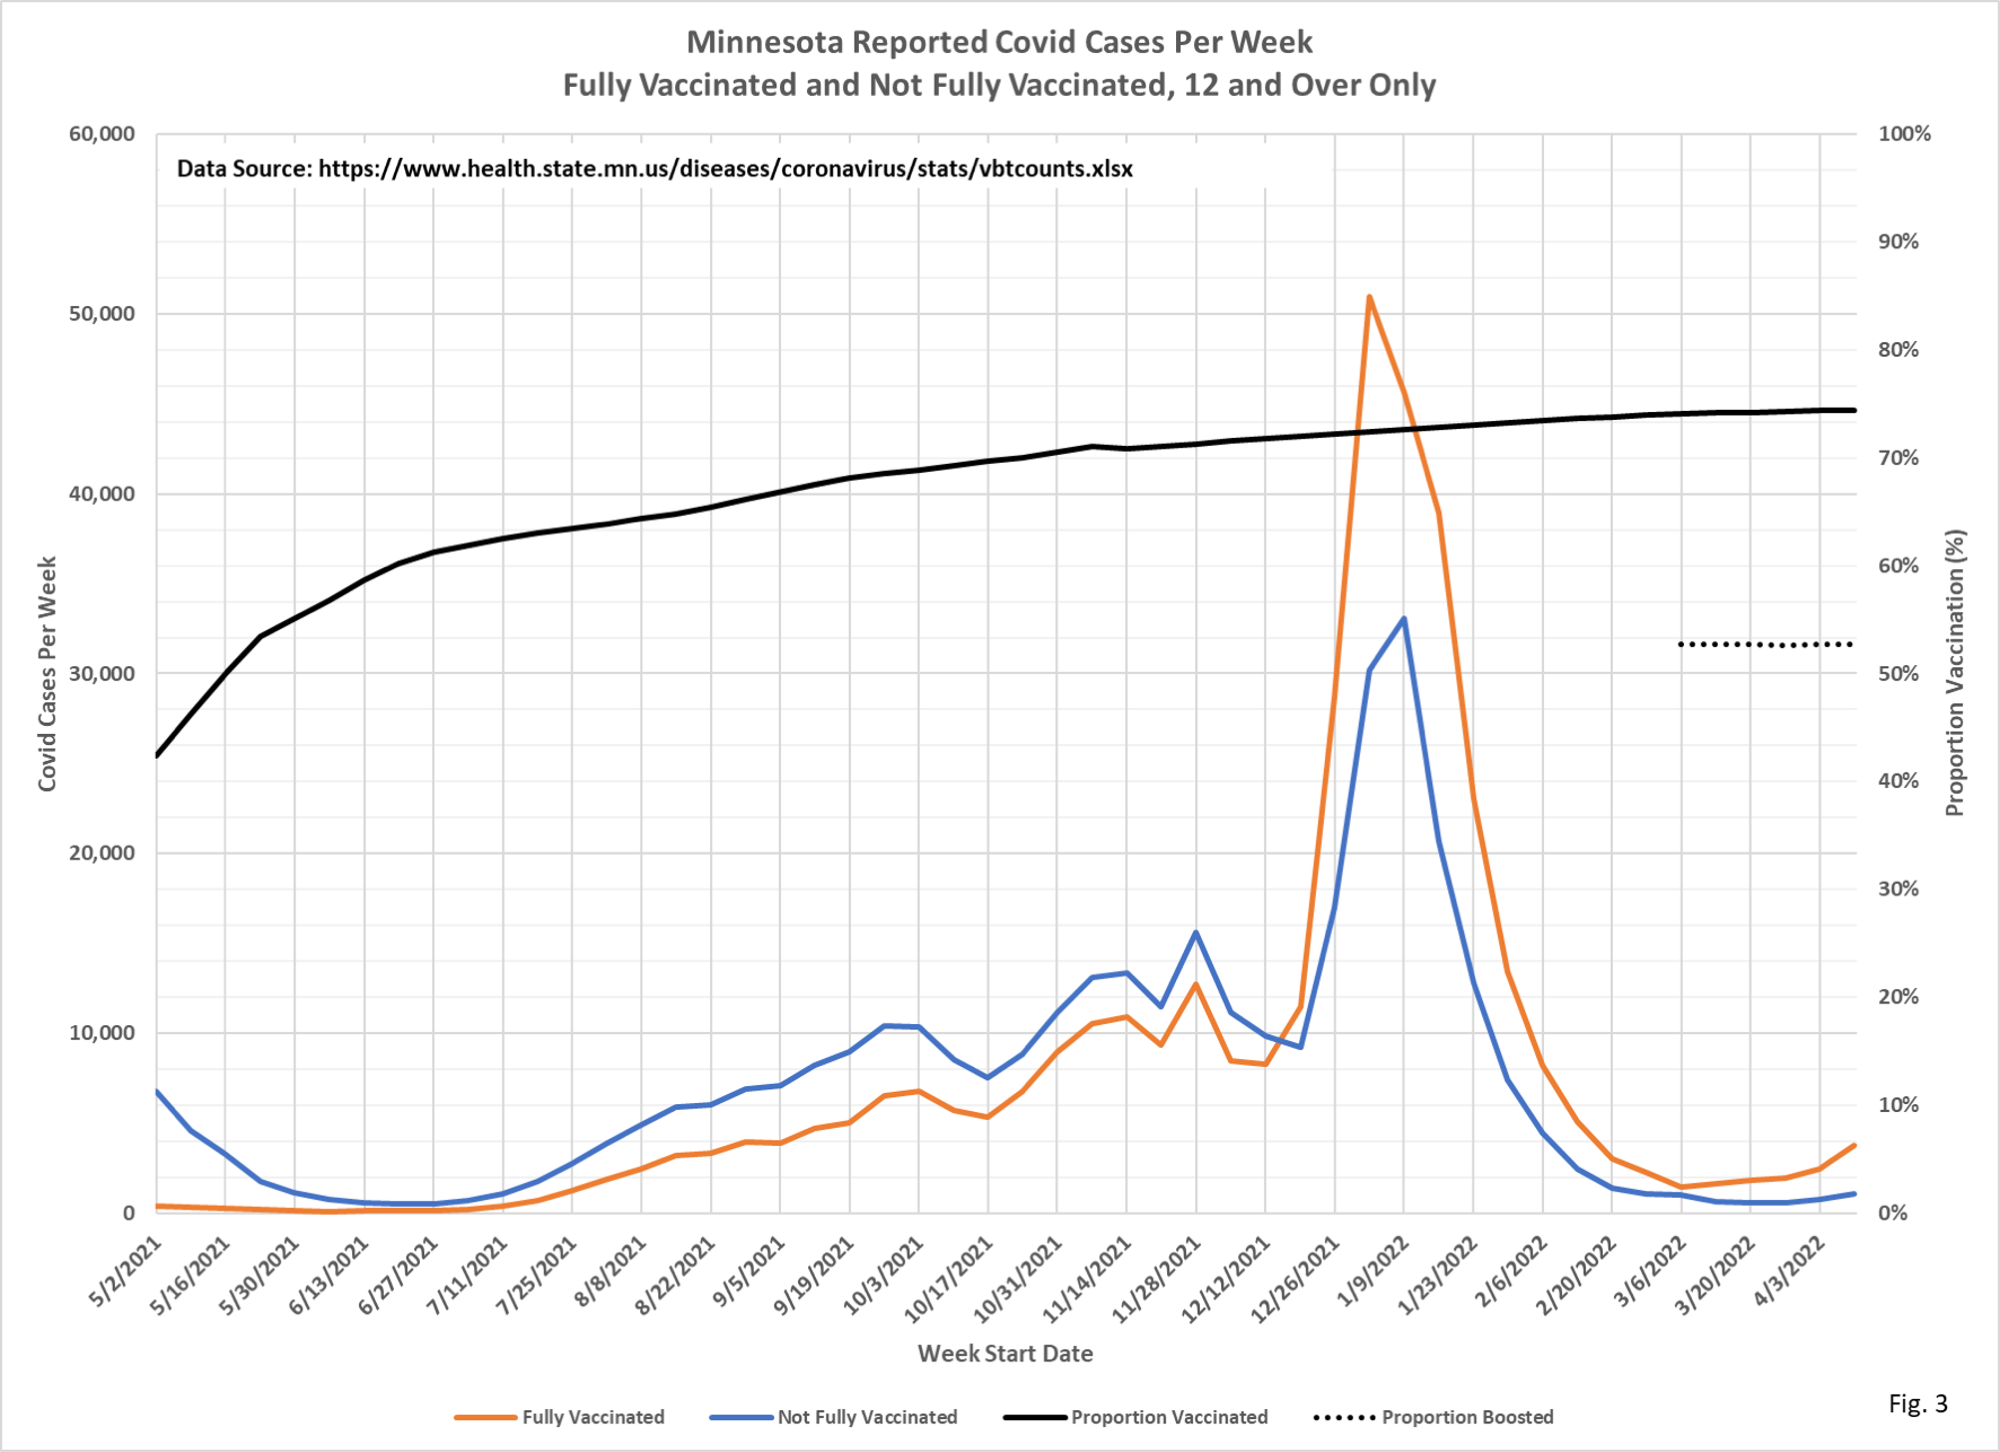
- Fig. 3: This chart simply plots the cases among the vaccinated and unvaccinated populations each week, as found in Fig. 2. Cases among both the fully vaccinated and not fully vaccinated increased for the week of 4/10/2022. New for this week, the percent of the overall population who have been vaccinated and boosted are now displayed on the charts in Fig. 3 through Fig. 6. The number of cases is increasing among the vaccinated population at a greater rate than the unvaccinated, not a total surprise given the larger vaccinated population.
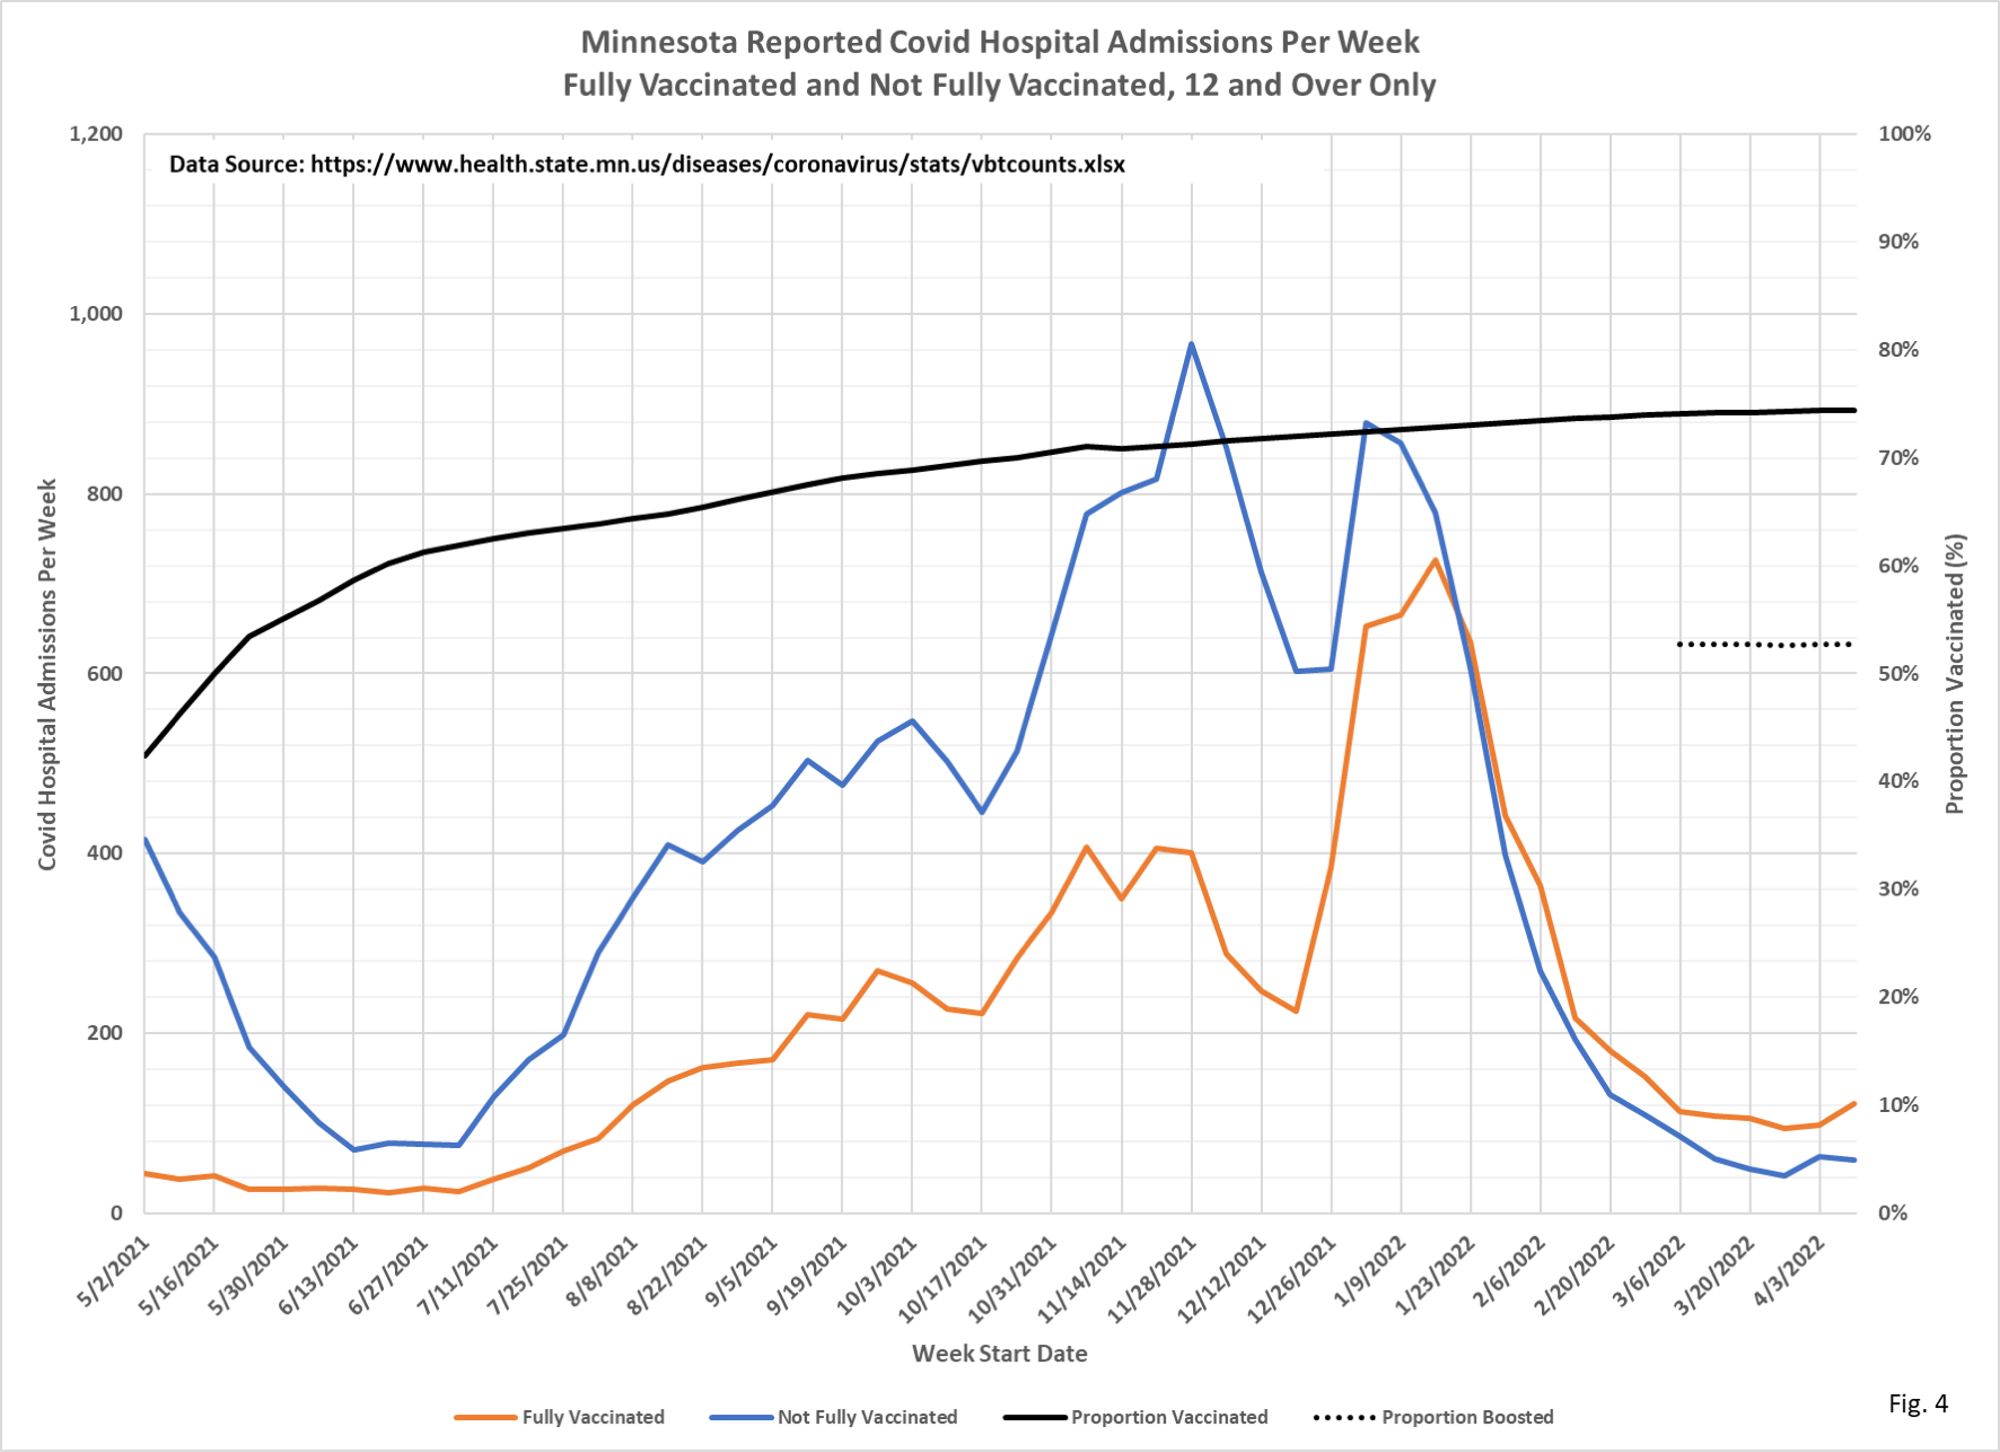
- Fig. 4: This chart displays the hospital admissions among the vaccinated and unvaccinated populations each week from the data in Fig. 2. Covid hospital admissions for both the vaccinated and not fully vaccinated rose sharply for the week of 4/10/2022.
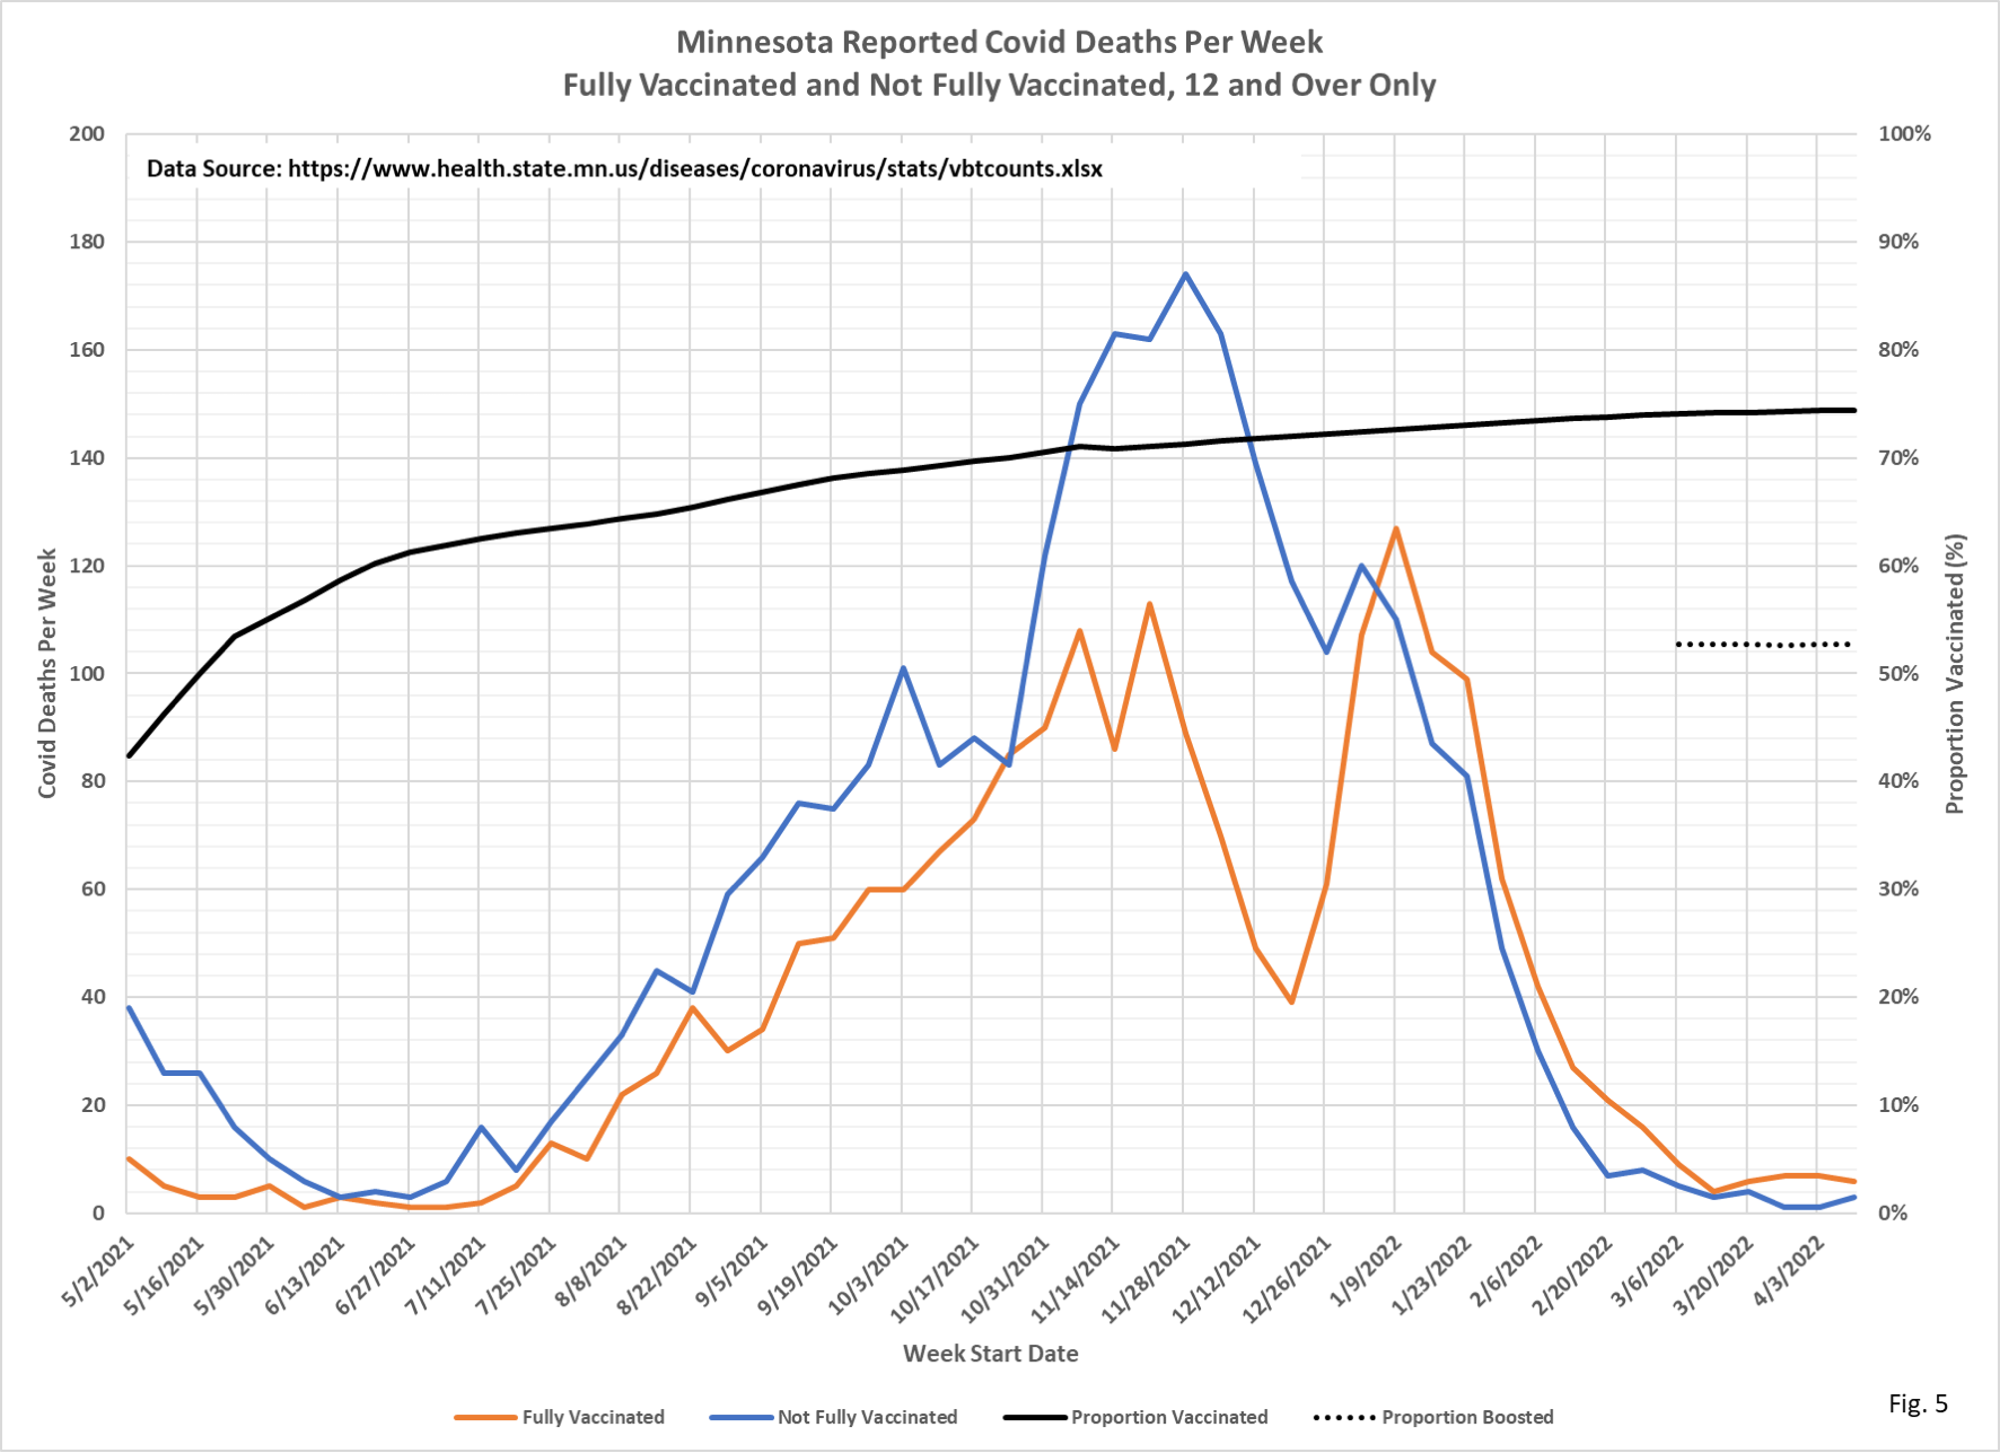
- Fig. 5: This chart displays the vaccinated and unvaccinated deaths each week from the data in Fig. 2. Death among vaccinated and unvaccinated remain at very low levels for the week of 4/10/2022, with a moderate increase in fully vaccinated deaths.
- The tables and charts are updated for new data released by Minnesota Department of Health (MDH) on 5/16/2022, adding data for the week starting 4/10/2022 and ending 4/16/2022.
- The data source for the data on Fig. 1 is the cumulative breakthrough cases, hospitalizations, and deaths published on the MDH COVID-19 Vaccine Breakthrough Weekly Update https://www.health.state.mn.
us/diseases/coronavirus/stats/ vbt.html - The data source for Fig. 2 is the data file https://www.health.state.mn.
us/diseases/coronavirus/stats/ vbtcounts.xlsx found on MDH web page https://www.health.state.mn. us/diseases/coronavirus/stats/ vbt.html. The data provided in the data file vbtcounts.xlsx is used without modification, other than to sum the weekly events and compute the breakthrough proportion. Vbtcounts.xlsx provides breakthrough and non-breakthrough cases, hospital admissions, and deaths for each week listed. - The charts in Fig. 3 through Fig. 6 are plots of the data in Fig. 2.
- MDH defines a breakthrough event as a Covid case, hospital admission, or death that occurs 14 or more days after completing the vaccination series (not including boosters.
