Another of Dave’s excellent updates on the long term picture of the epidemic. While we have a case wave and the timing is similar to 2020, but later than 2021, still not clear what the seasonal factor impact is. We likely are on the downside of this particular wave, but there will be more and hopefully we ignore them.
 Dave’s notes:
- Overall, we can see that new daily cases are higher now than on the same date in 2020 or 2021, and active cases will soon by higher than 2020 and 2021. However, ICU admissions and ICU beds in use are much lower than the same date in 2020 and 2021, as are deaths.
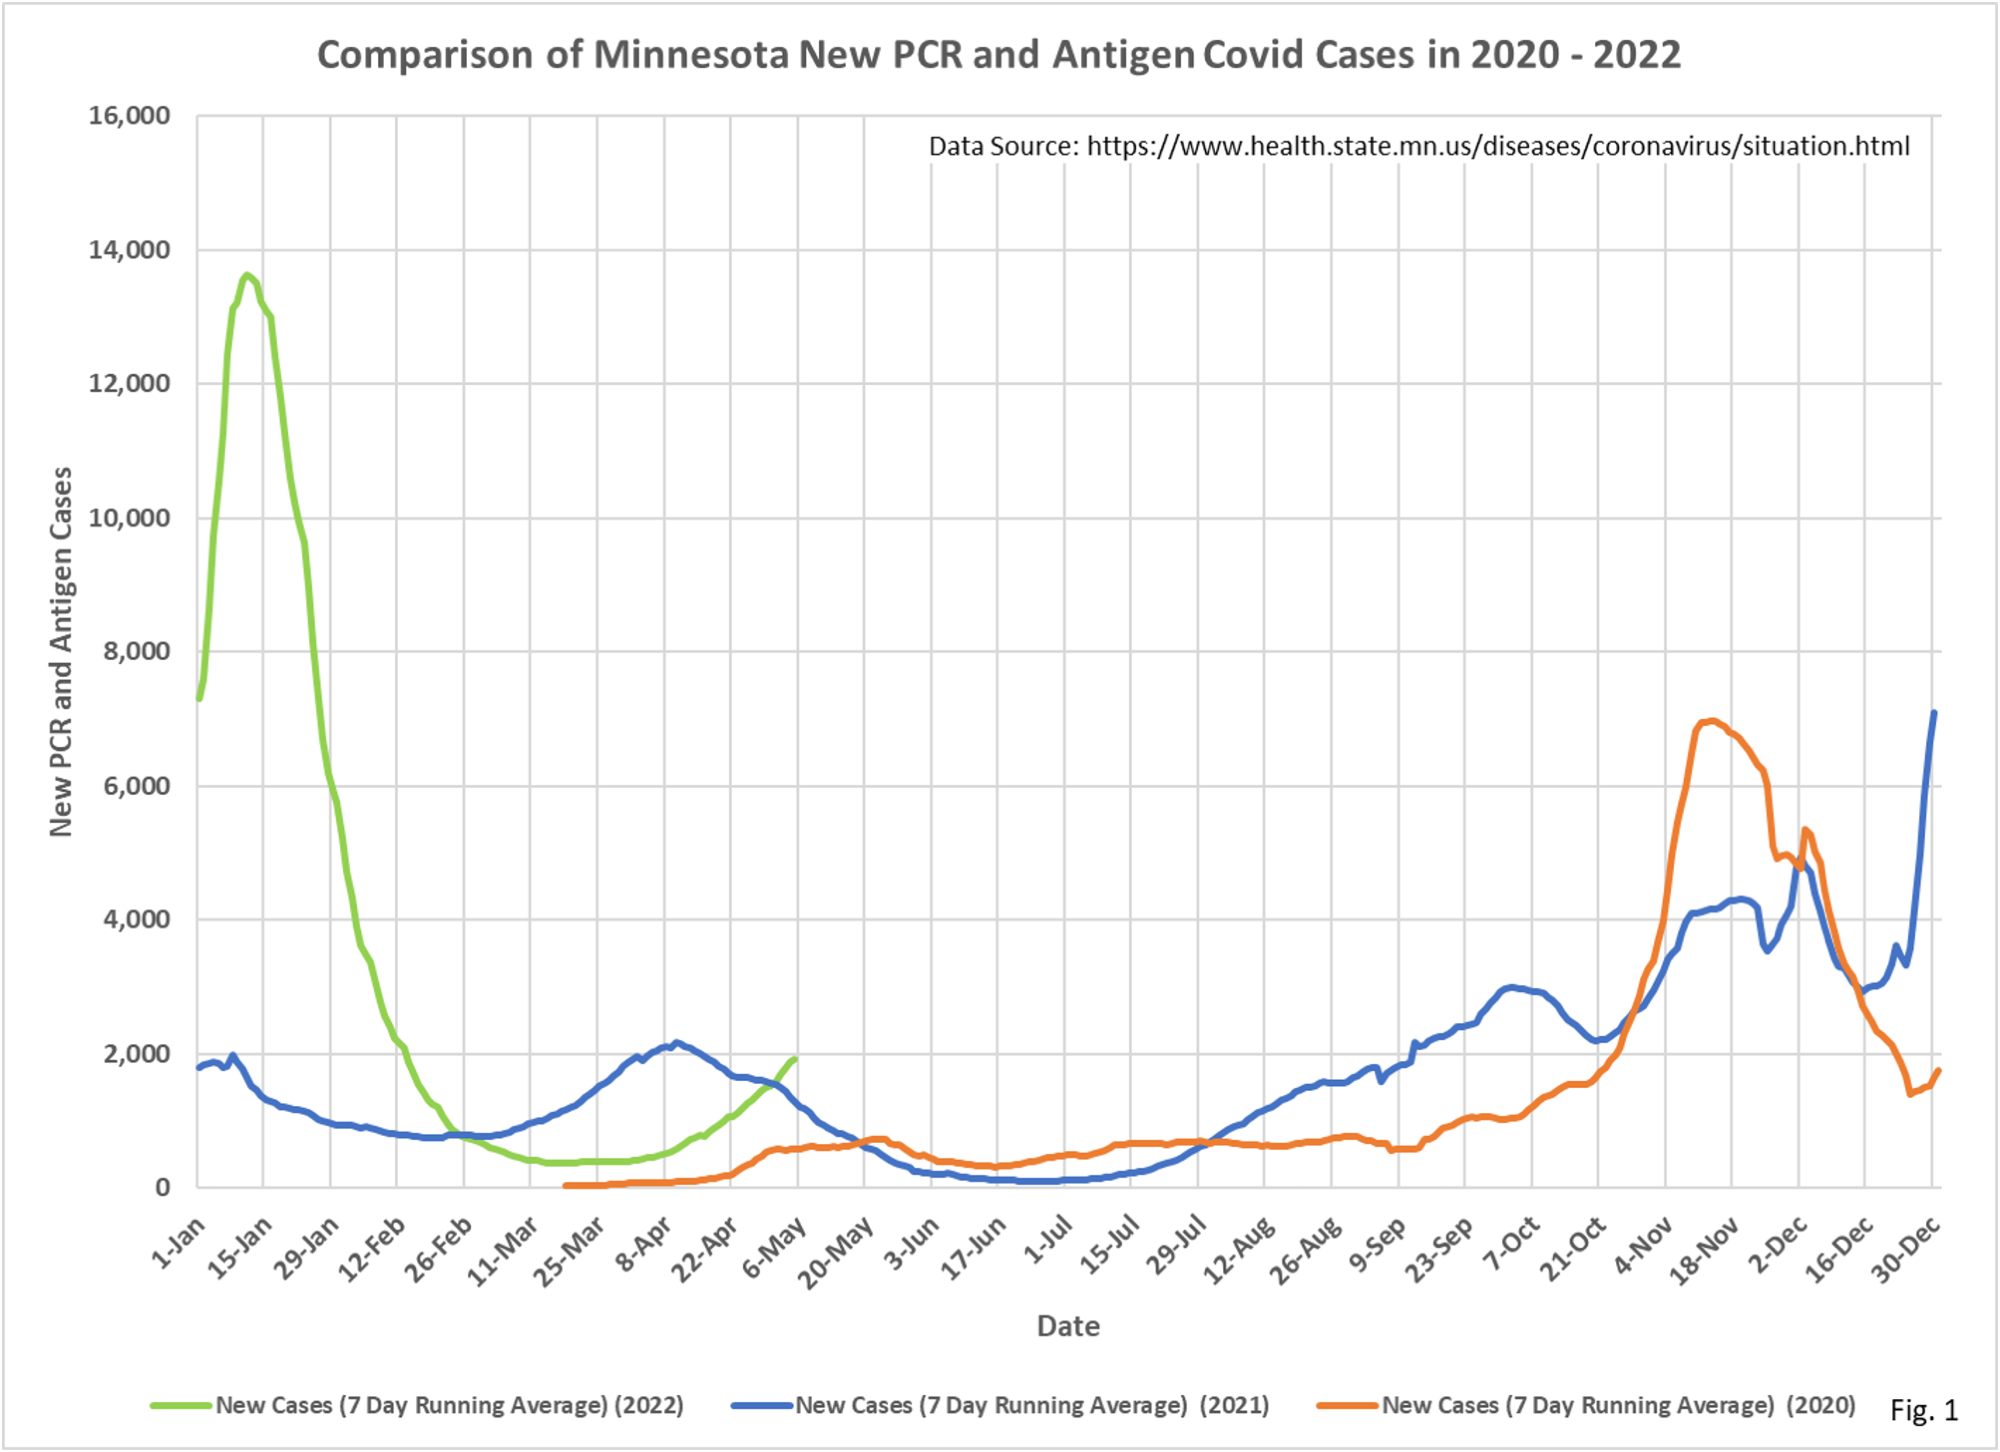
- Fig. 1: New daily cases per day bottomed out at 374 average cases per day on 3/20/2022. Daily cases have now risen to 1927 cases on 5/06/2022 on the most recent date displayed (last 7 days excluded from charts).
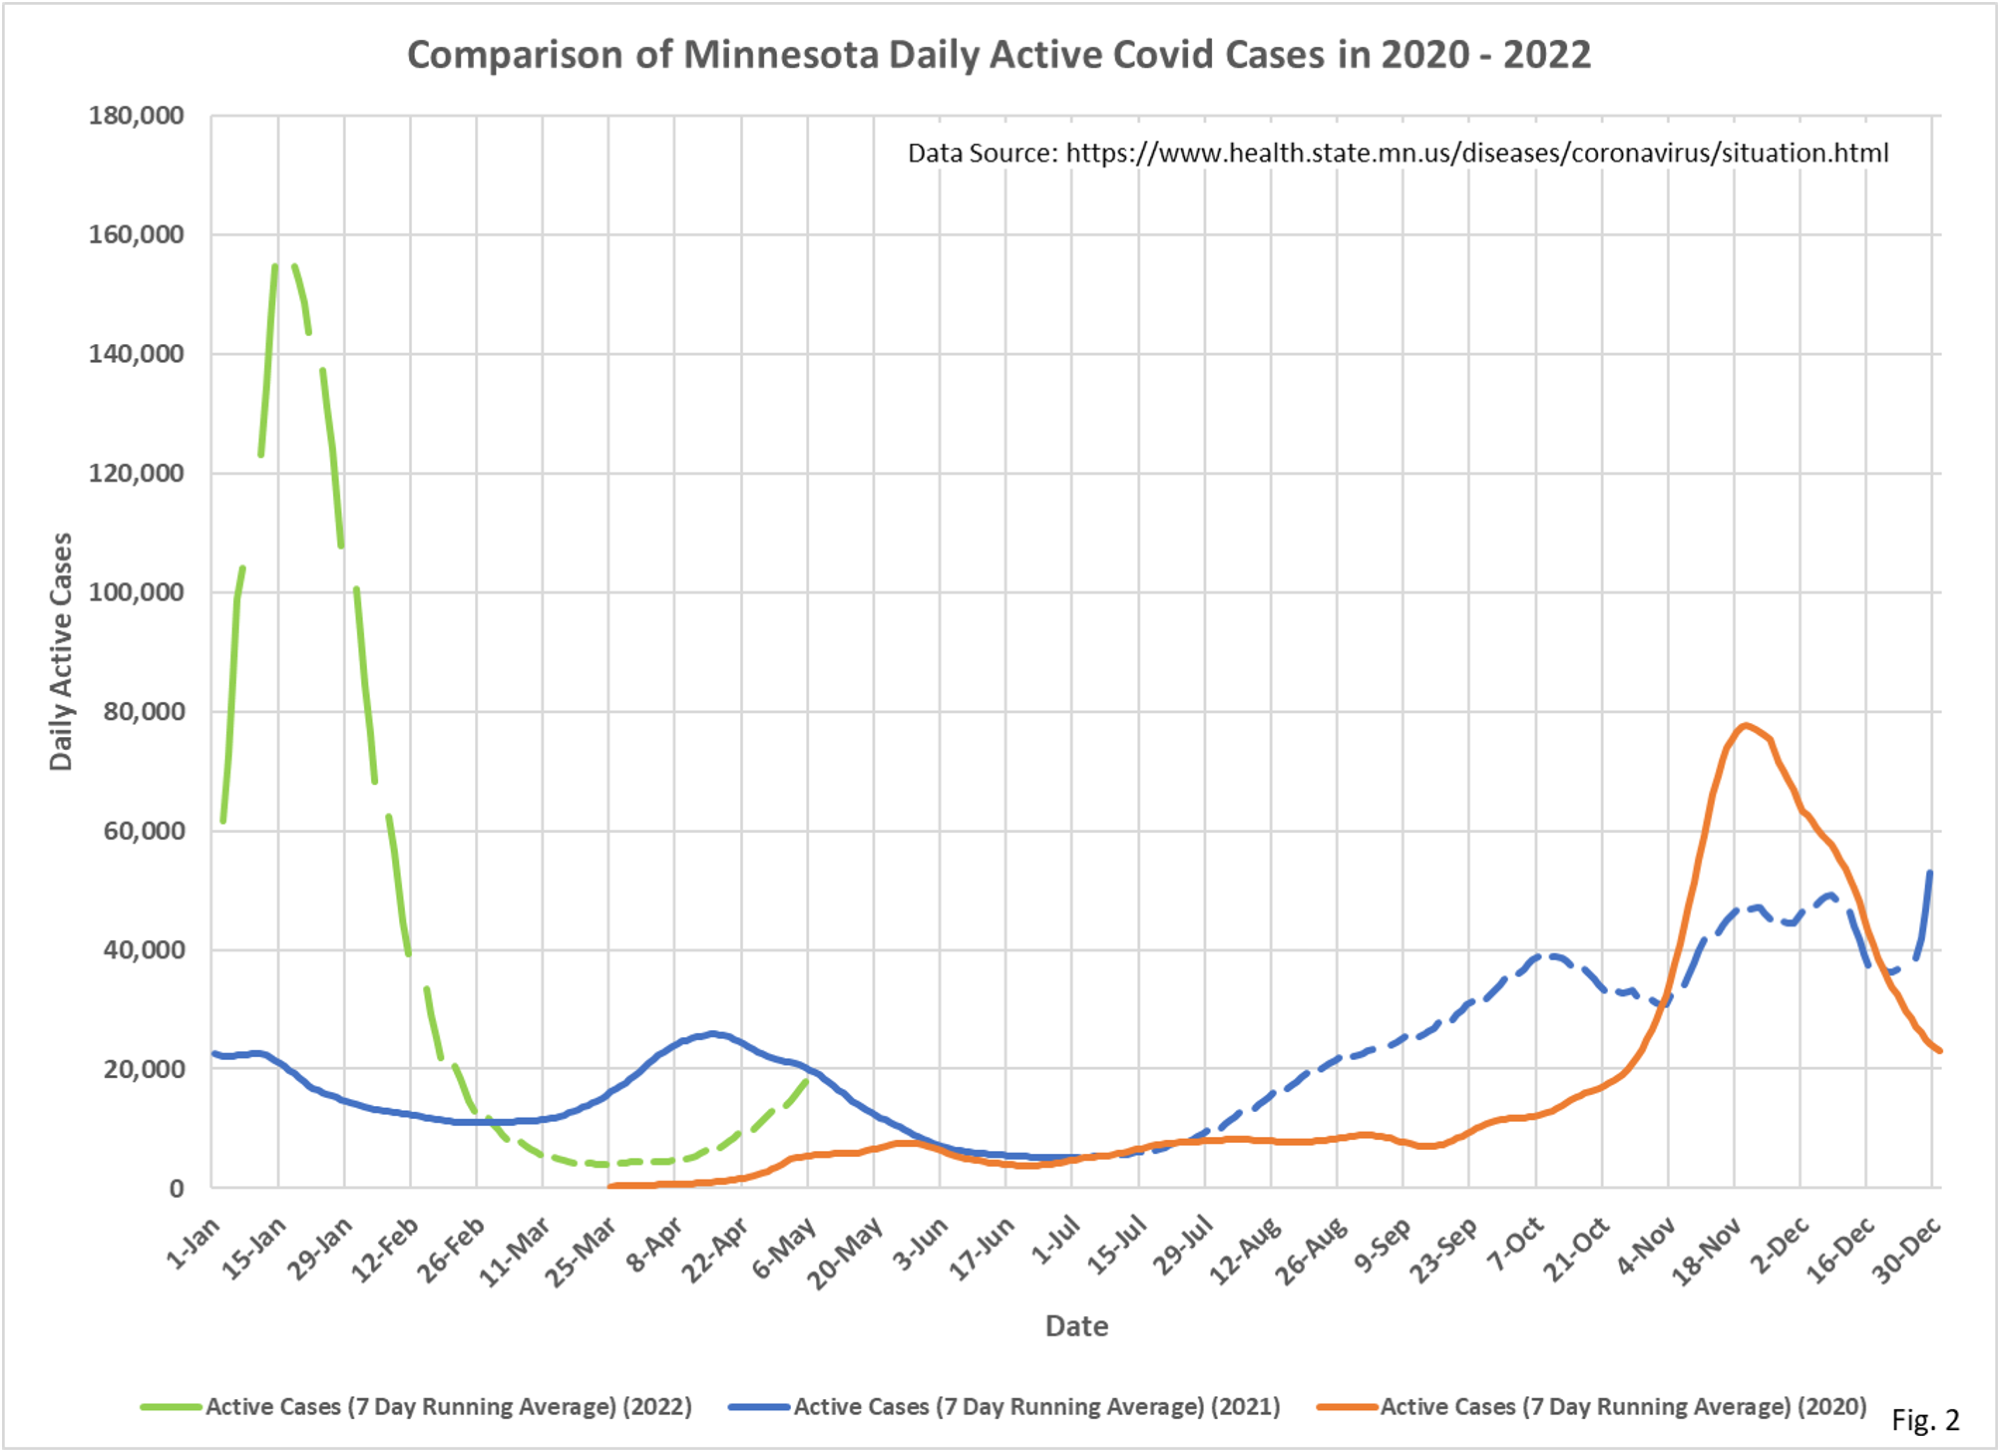
- Fig. 2: Active cases reached a recent low at 4,053 cases on 3/24/2022, and have since risen to 19,444 active cases on 5/06/2022.
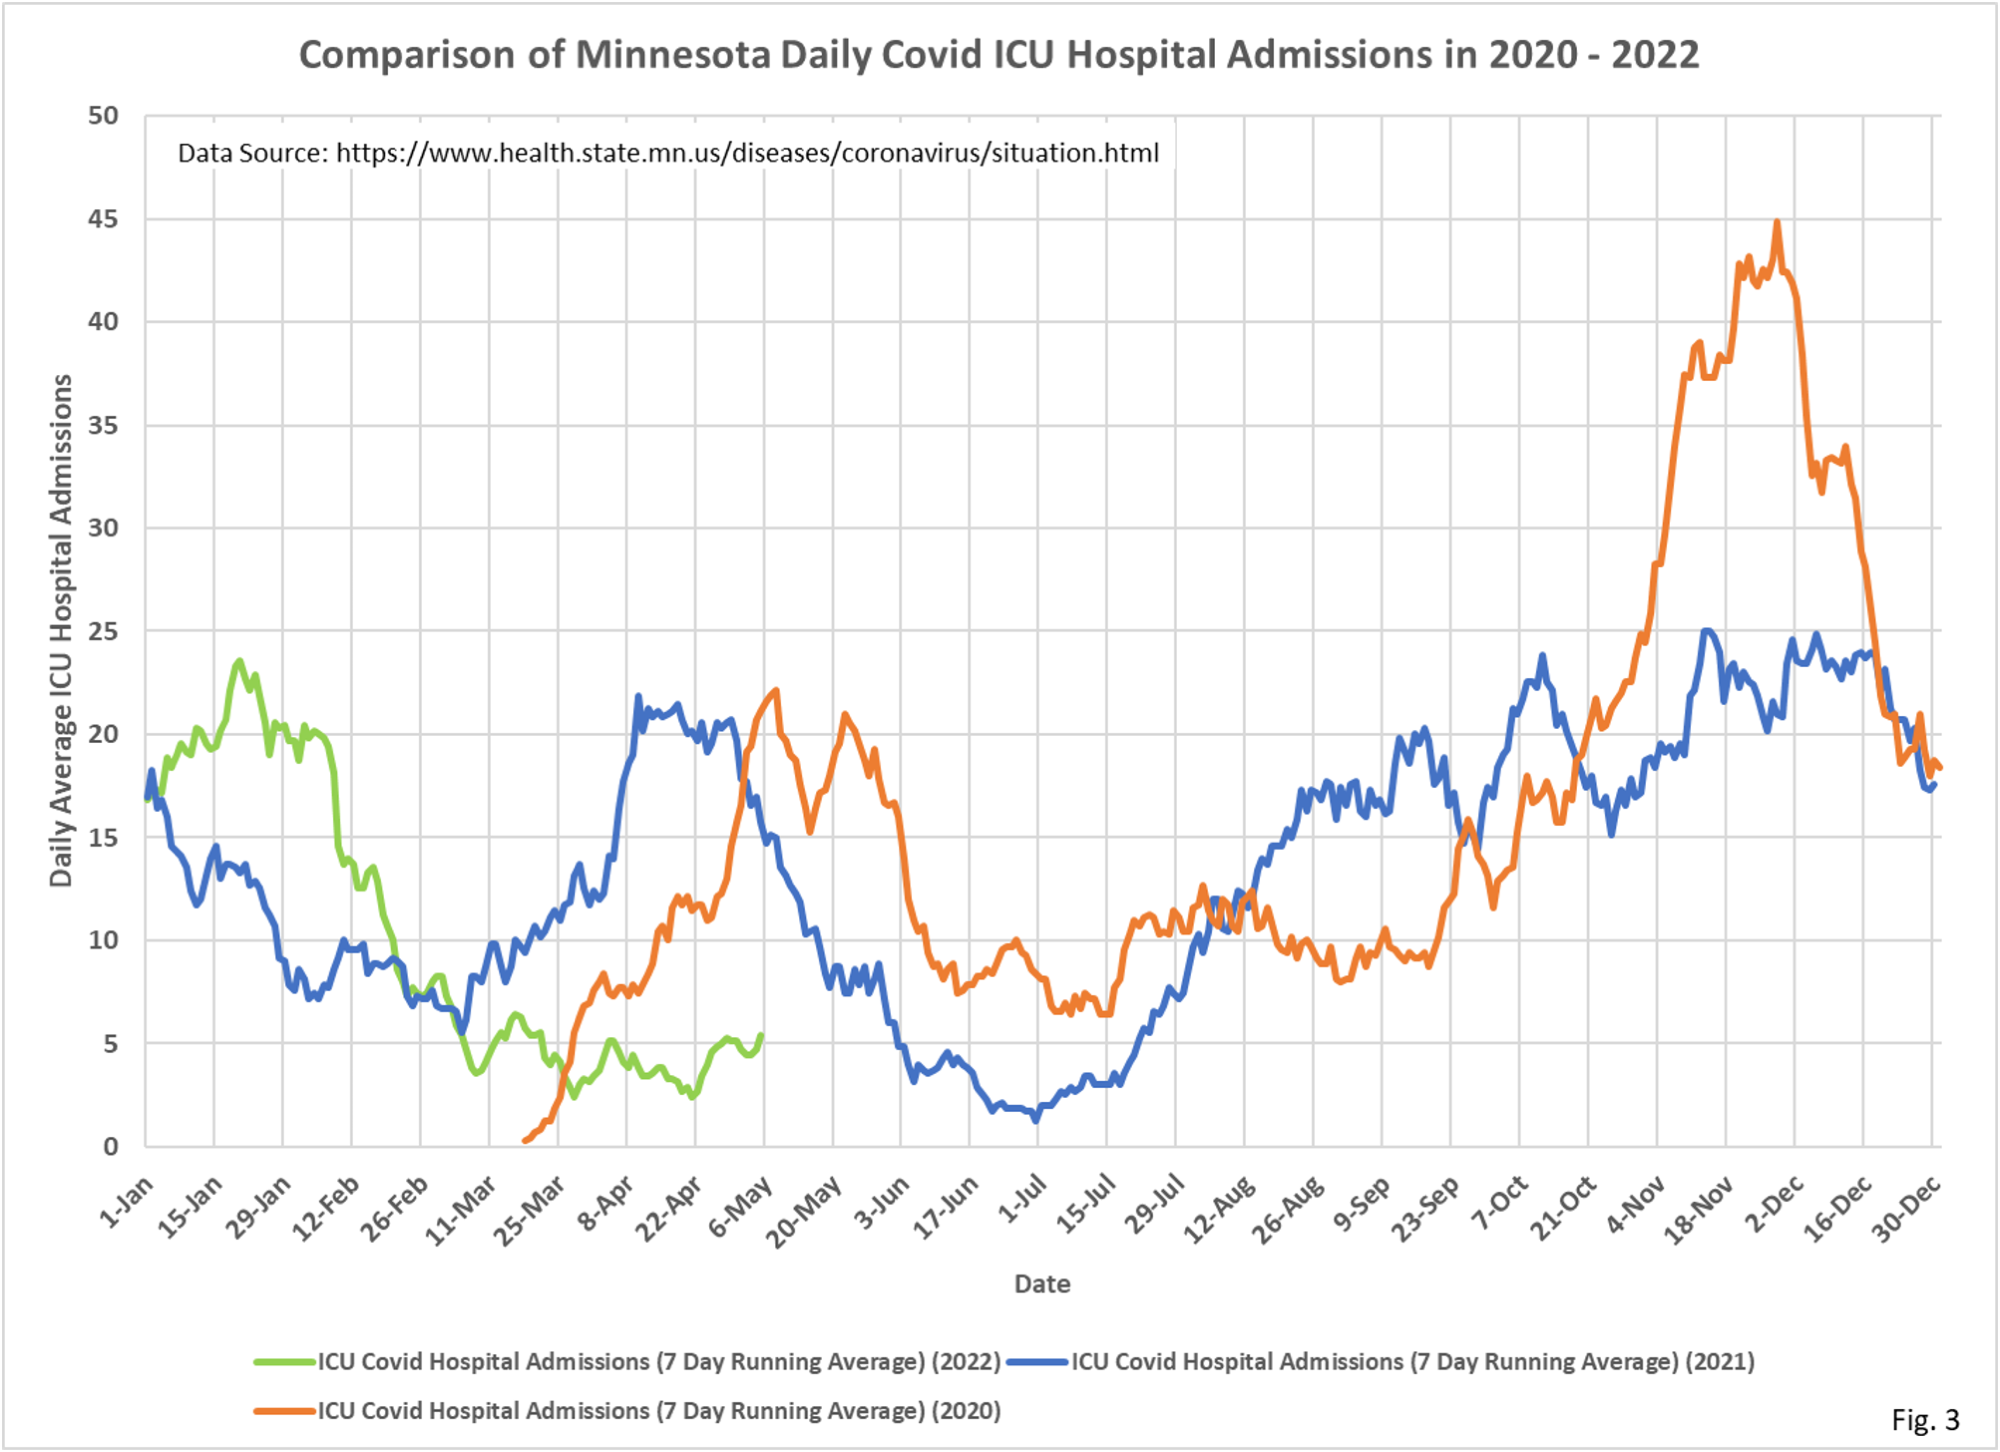
- Fig. 3: Covid ICU admissions achieved recent lows of 2.4 average admissions per day on 3/29/2022 and 4/22/2022, and have risen to 5.4 admissions per day on 5/06/2022.
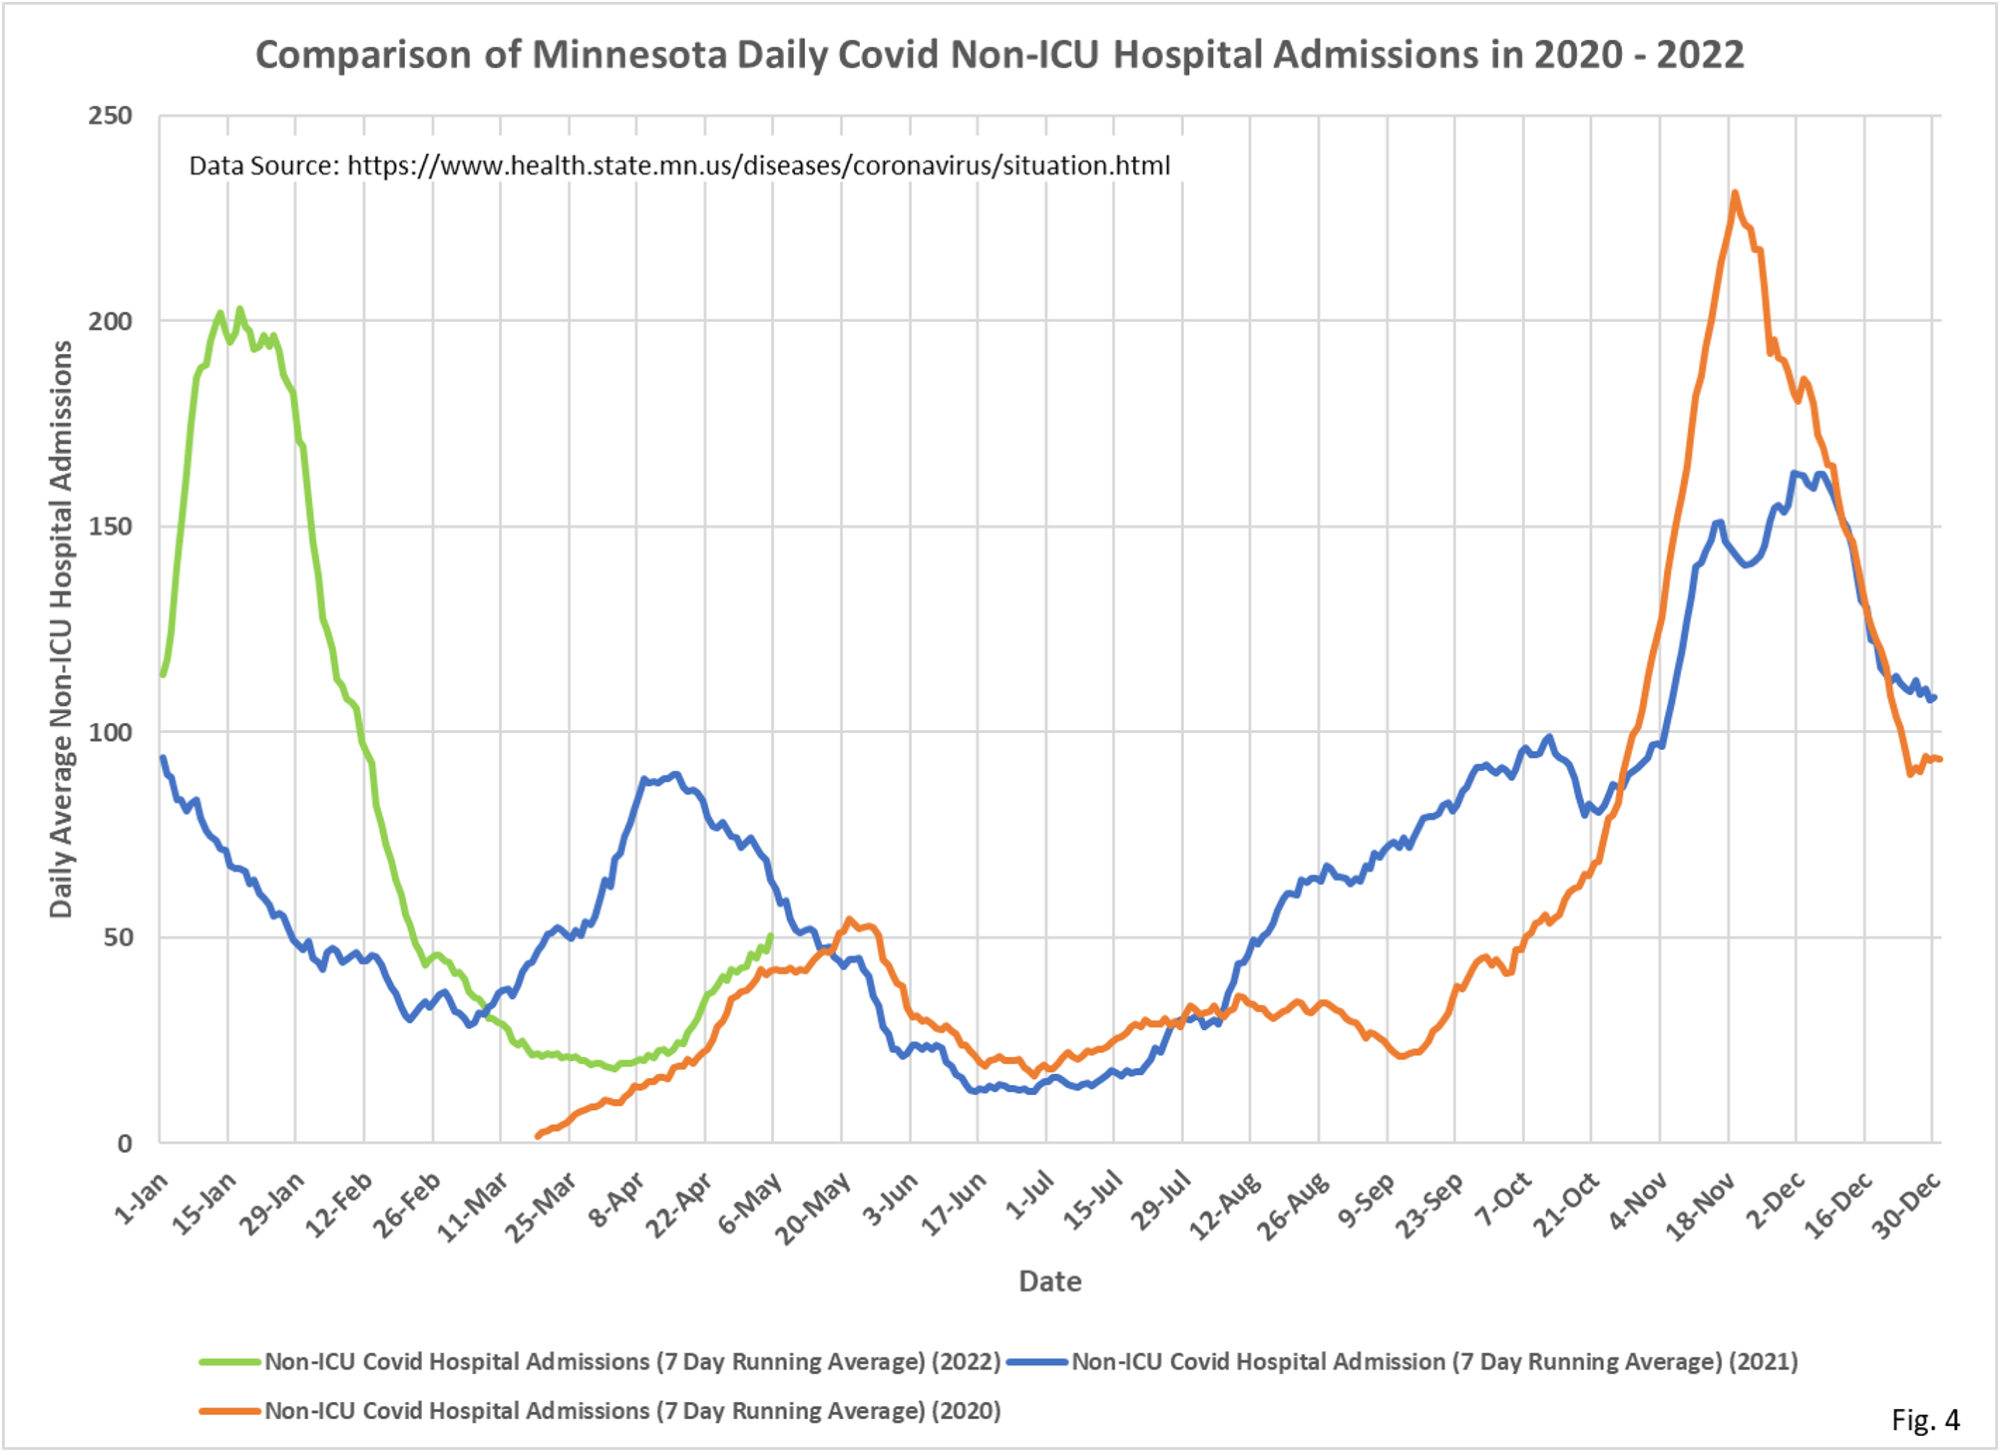
- Fig. 4: Covid Non-ICU admissions were at a minimum of 18.0 admissions per day on 4/4/2022, and most recently are at 50.4 admissions per day on 5/06/2022.
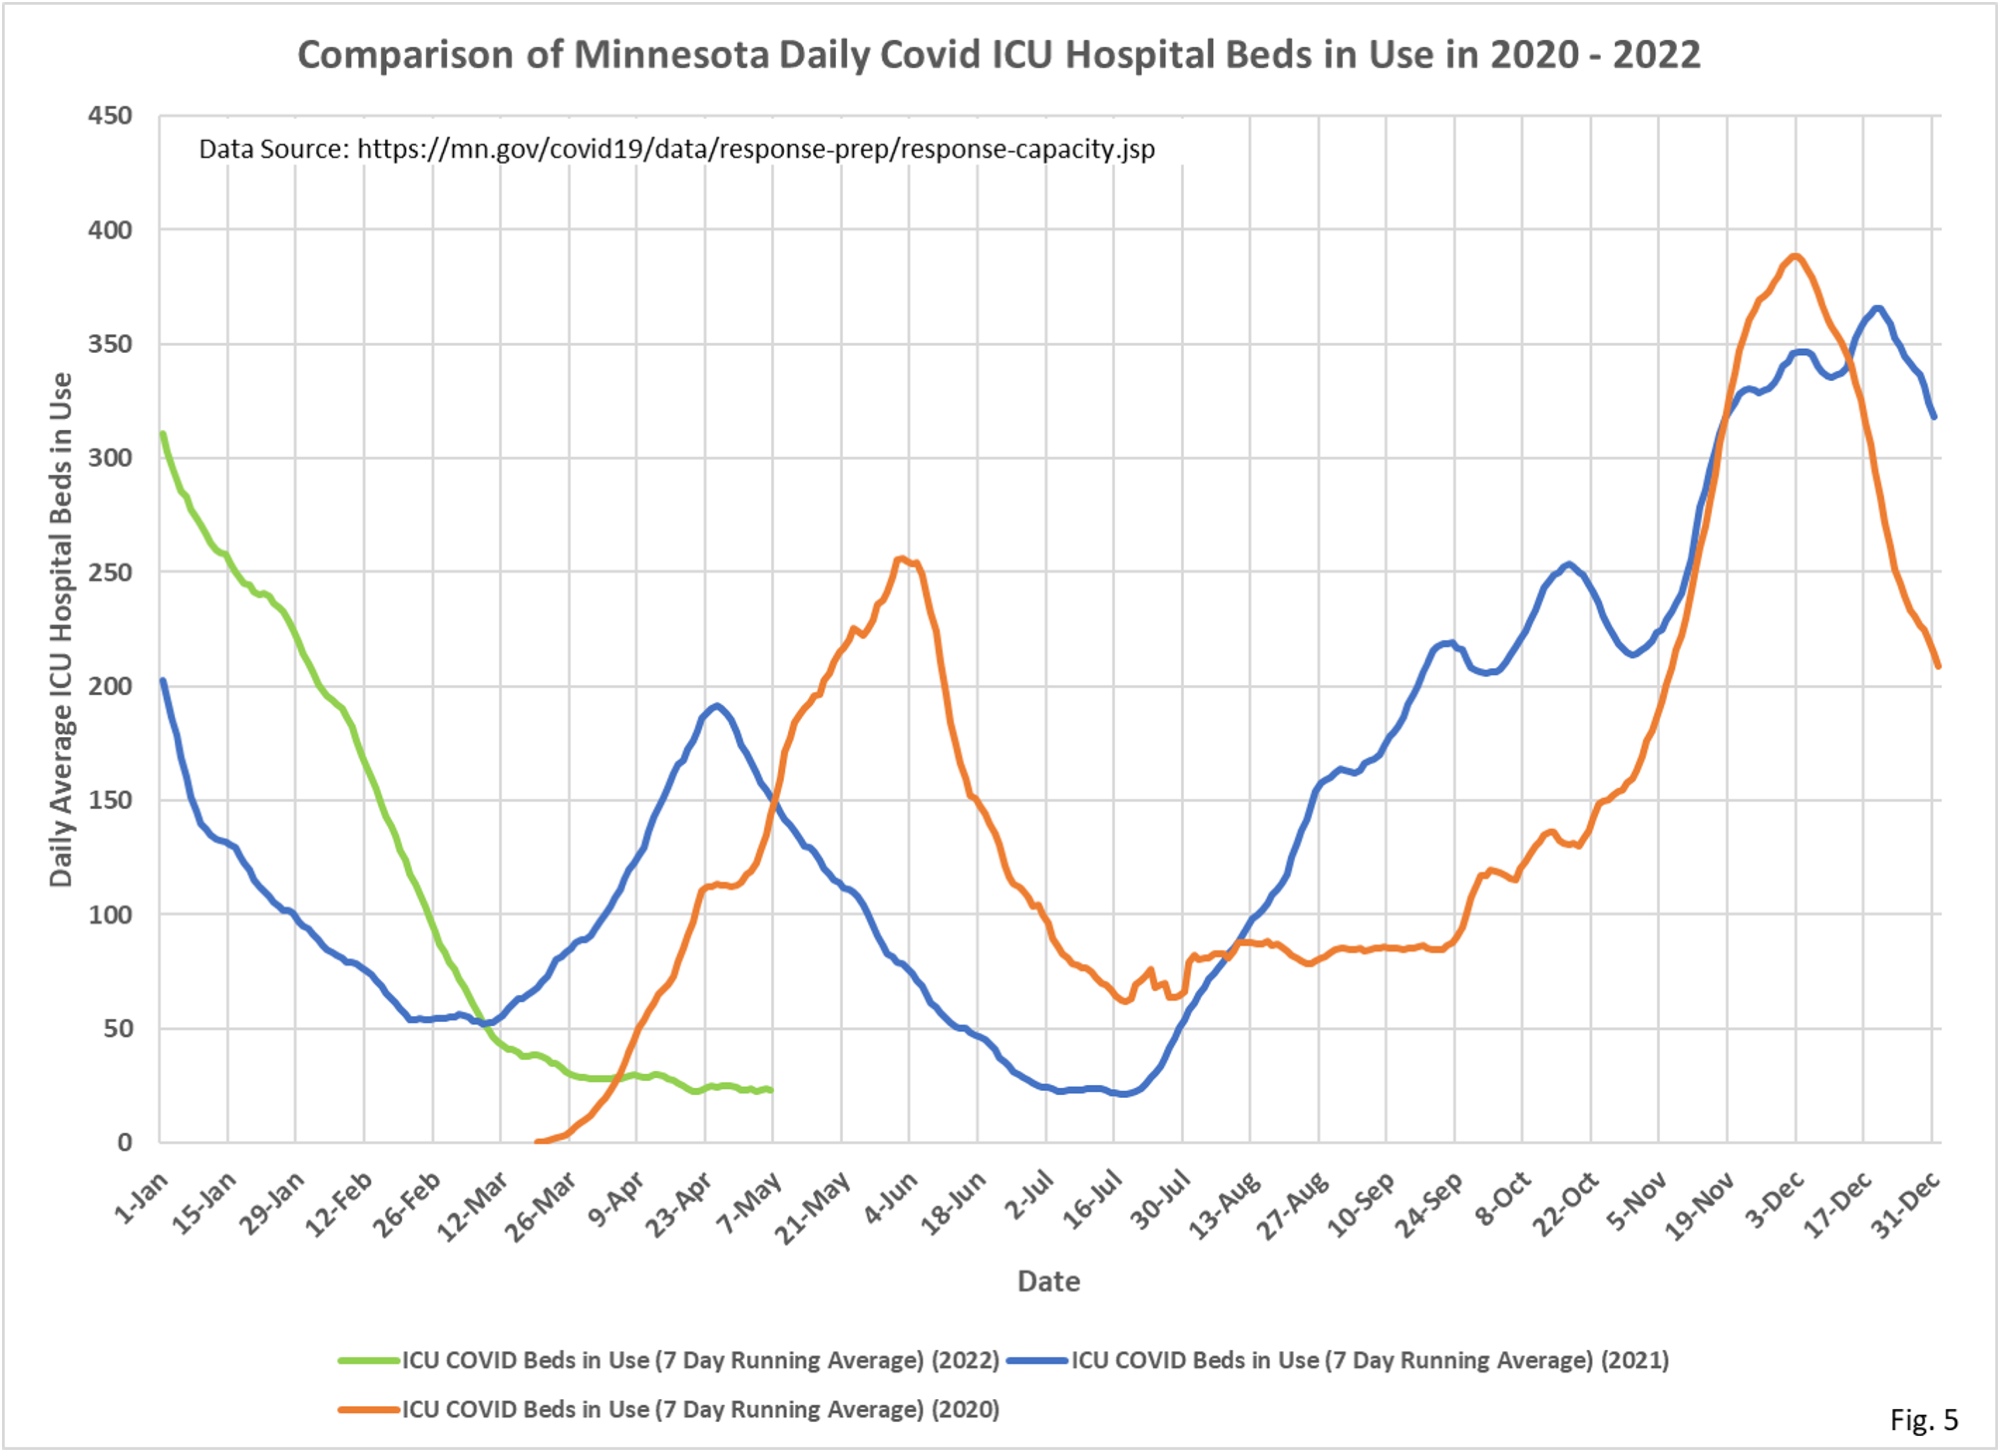
- Fig. 5: ICU Covid hospital beds in use continue to trend lower. There have been less than 30 ICU beds in use every day since 3/27/2022, and are approaching the lowest point of the pandemic, excluding the very earliest days, There are currently 23.3 ICU Covid beds in use, and the low point in 2021 was 21.6 Covid beds.
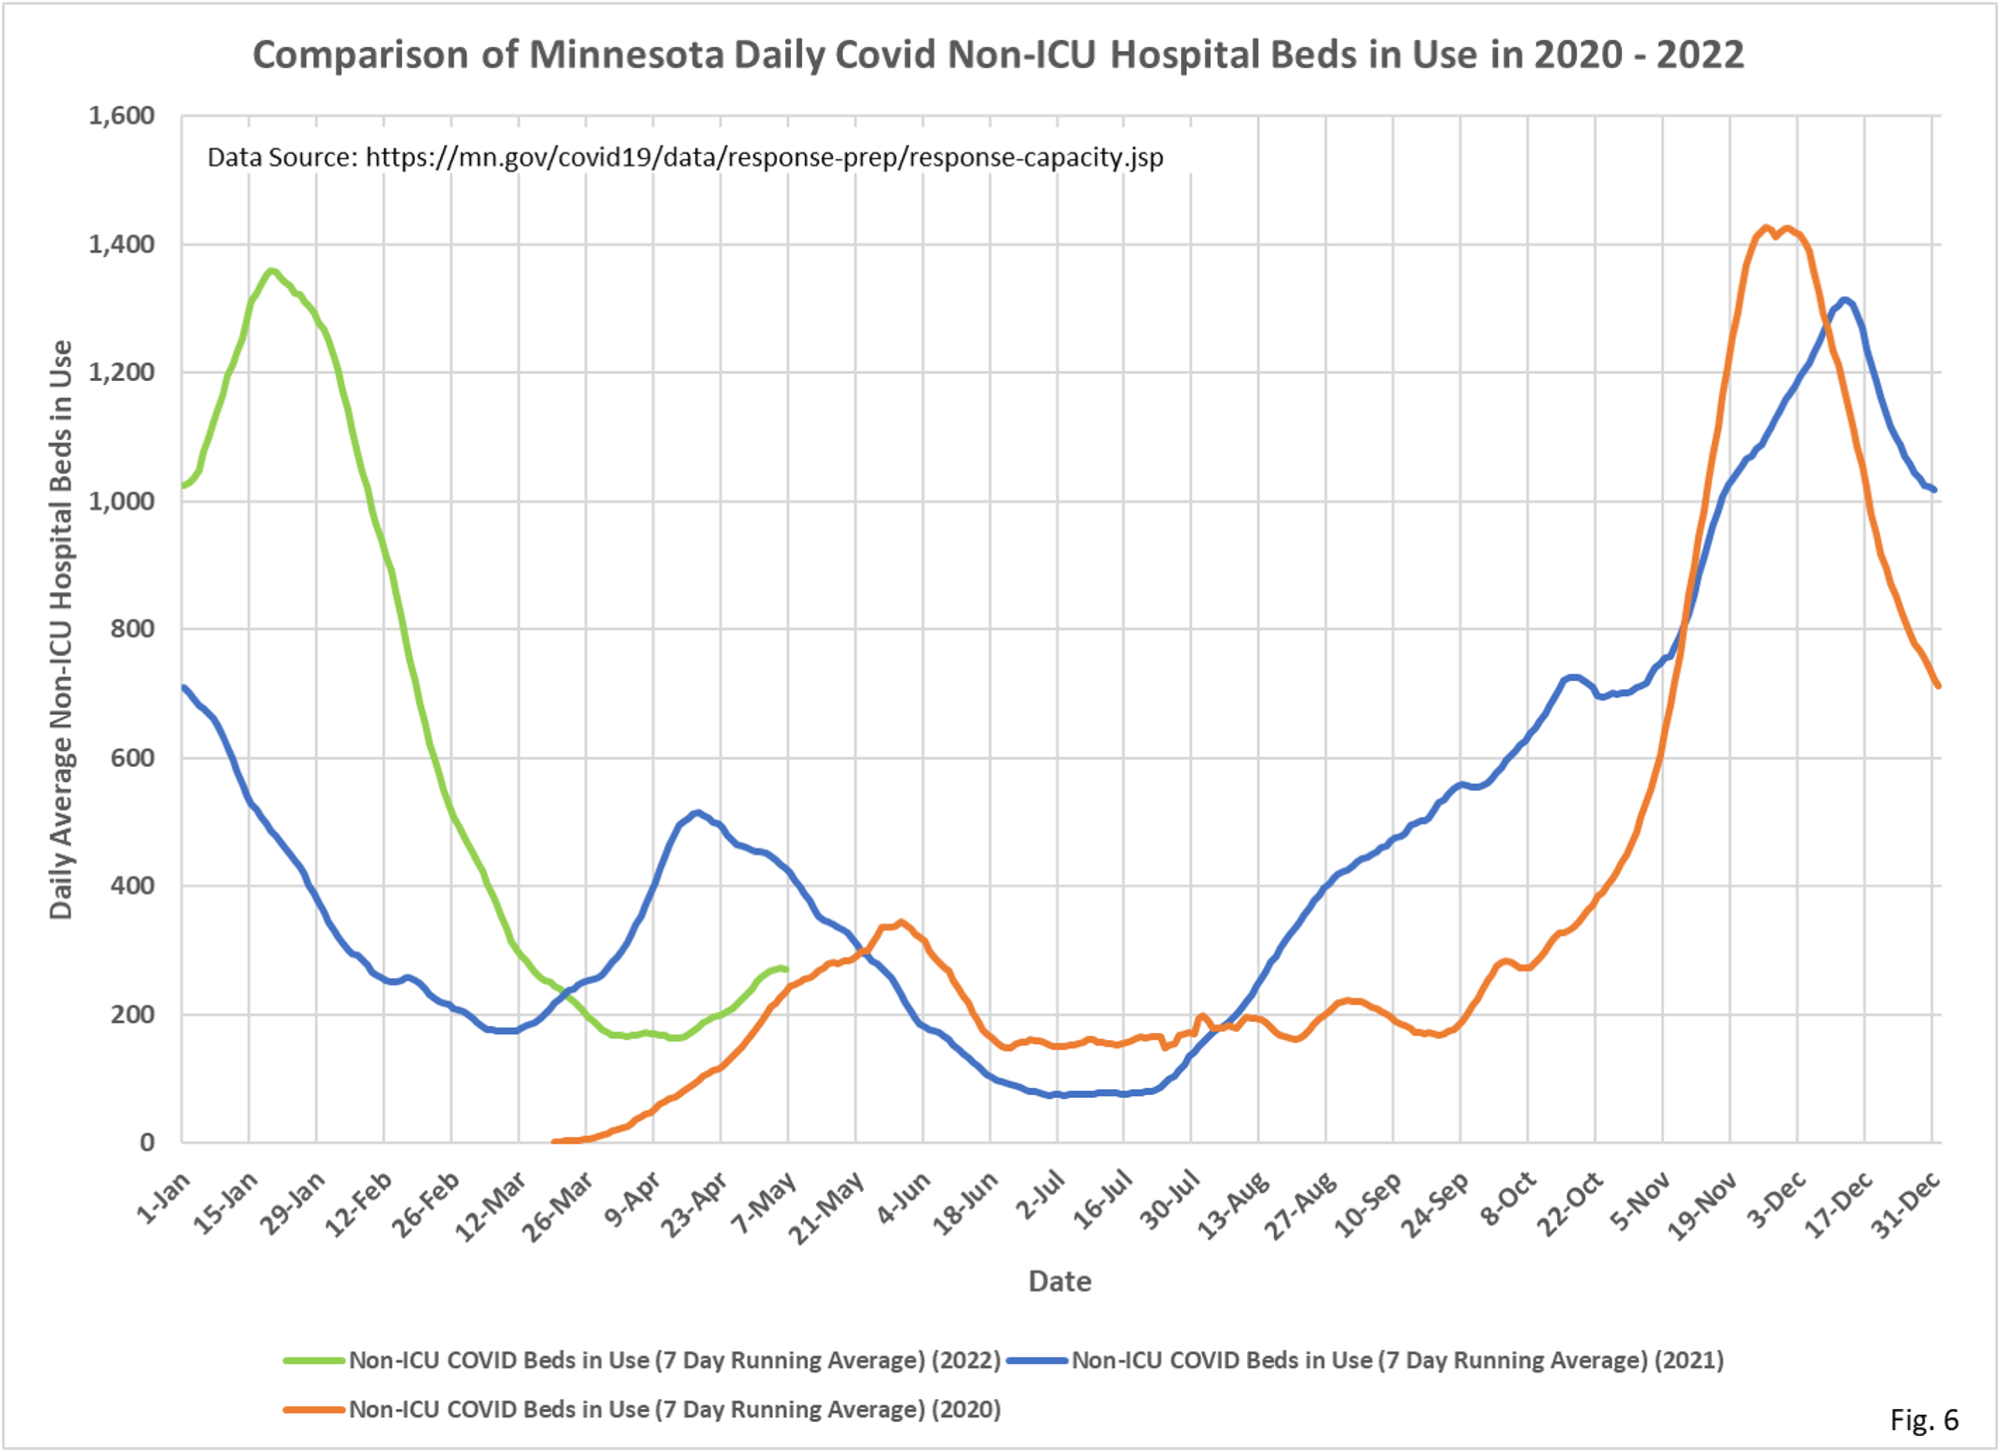
- Fig. 6: Non-ICU Covid hospital beds in use appear to be plateauing. The lowest number of Non-ICU Covid beds in use was 162.4 beds on 4/13/2022, and on 5/06/2022 were at 271.
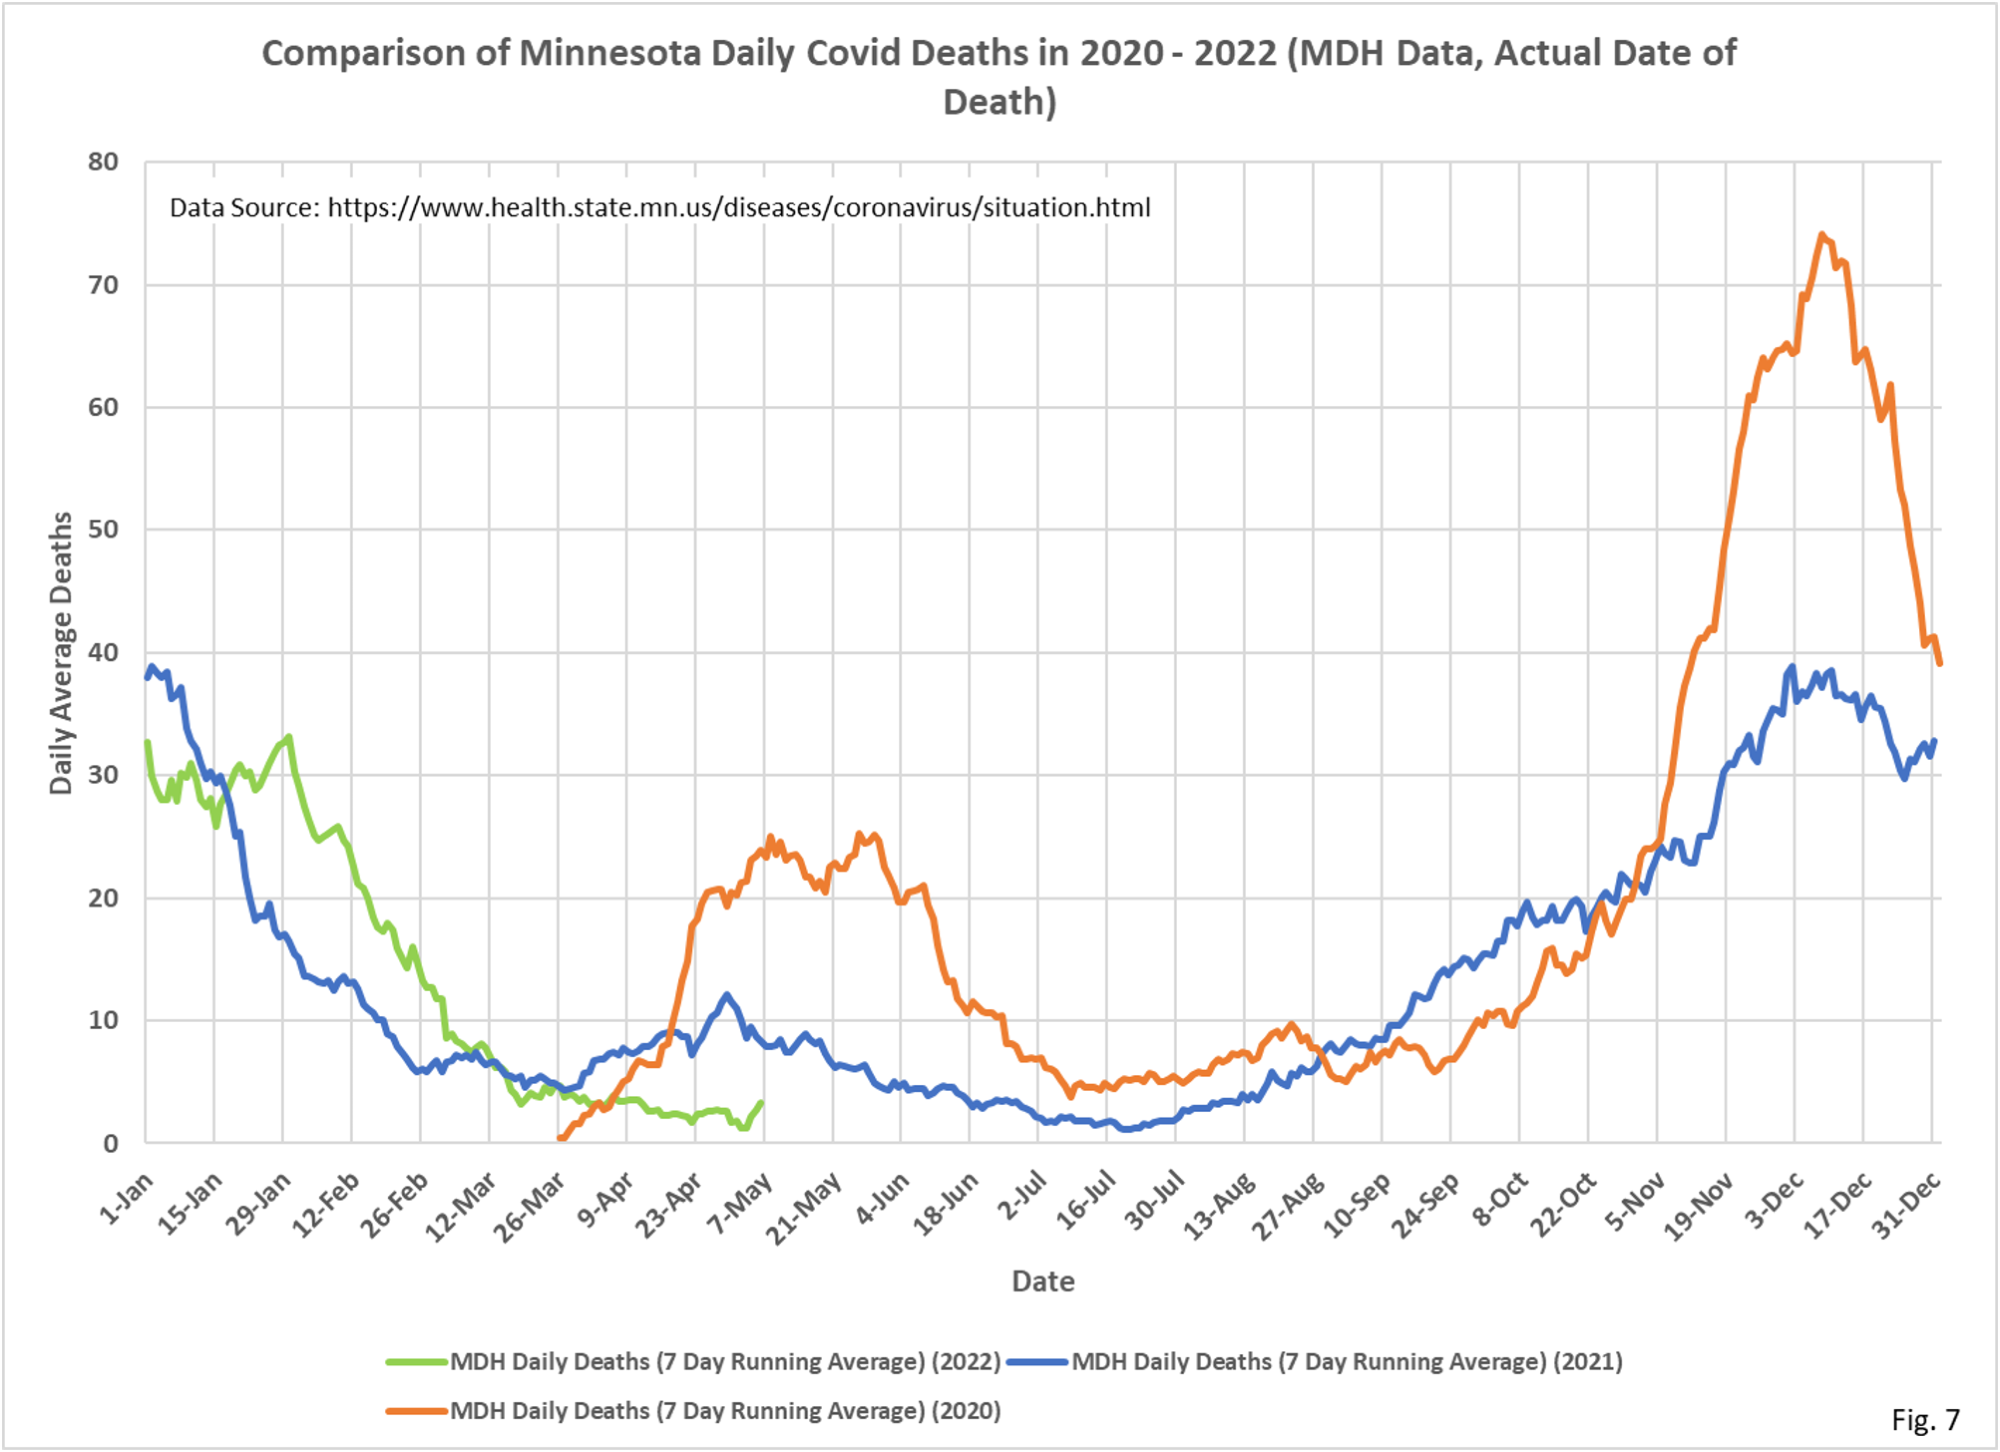
- Fig. 7: Deaths attributed to Covid have increased slightly in recent days. There were an average of 2.1 Covid deaths per day on 4/28/2022, but have risen to 3.3 deaths per day on 5/06/2022.
- For all charts the last 7 days of data is excluded to avoid charting incomplete data.
- All data is taken from the Minnesota Department of Health Situation Update for OCVID-19 web page https://www.health.state.mn.
us/diseases/coronavirus/ situation.html and from the Response and Preparation web page https://mn.gov/covid19/data/ response-prep/response- capacity.jsp. - All data is shown as 7 day running averages.

Mr. Roche,
Should the bigger picture comparison focus on the total number of respiratory viruses, not exclusively Covid? I suppose that would be close to impossible given that until now, very few people ever tested for these illnesses. I’m curious if the incidence of respiratory viruses has changed given all of the disruptions from non-pharmaceutical interventions.
Glad you continue your work. Thank you!