The reported stats show an uptick in some events, reflected in our longer-term epidemic charts. Note again that many hospitalizations are not for treatment of CV-19, but just reflect positive tests at admission. They should not be counted but are by DOH as part of the legacy terror campaign.
 Dave’s notes:
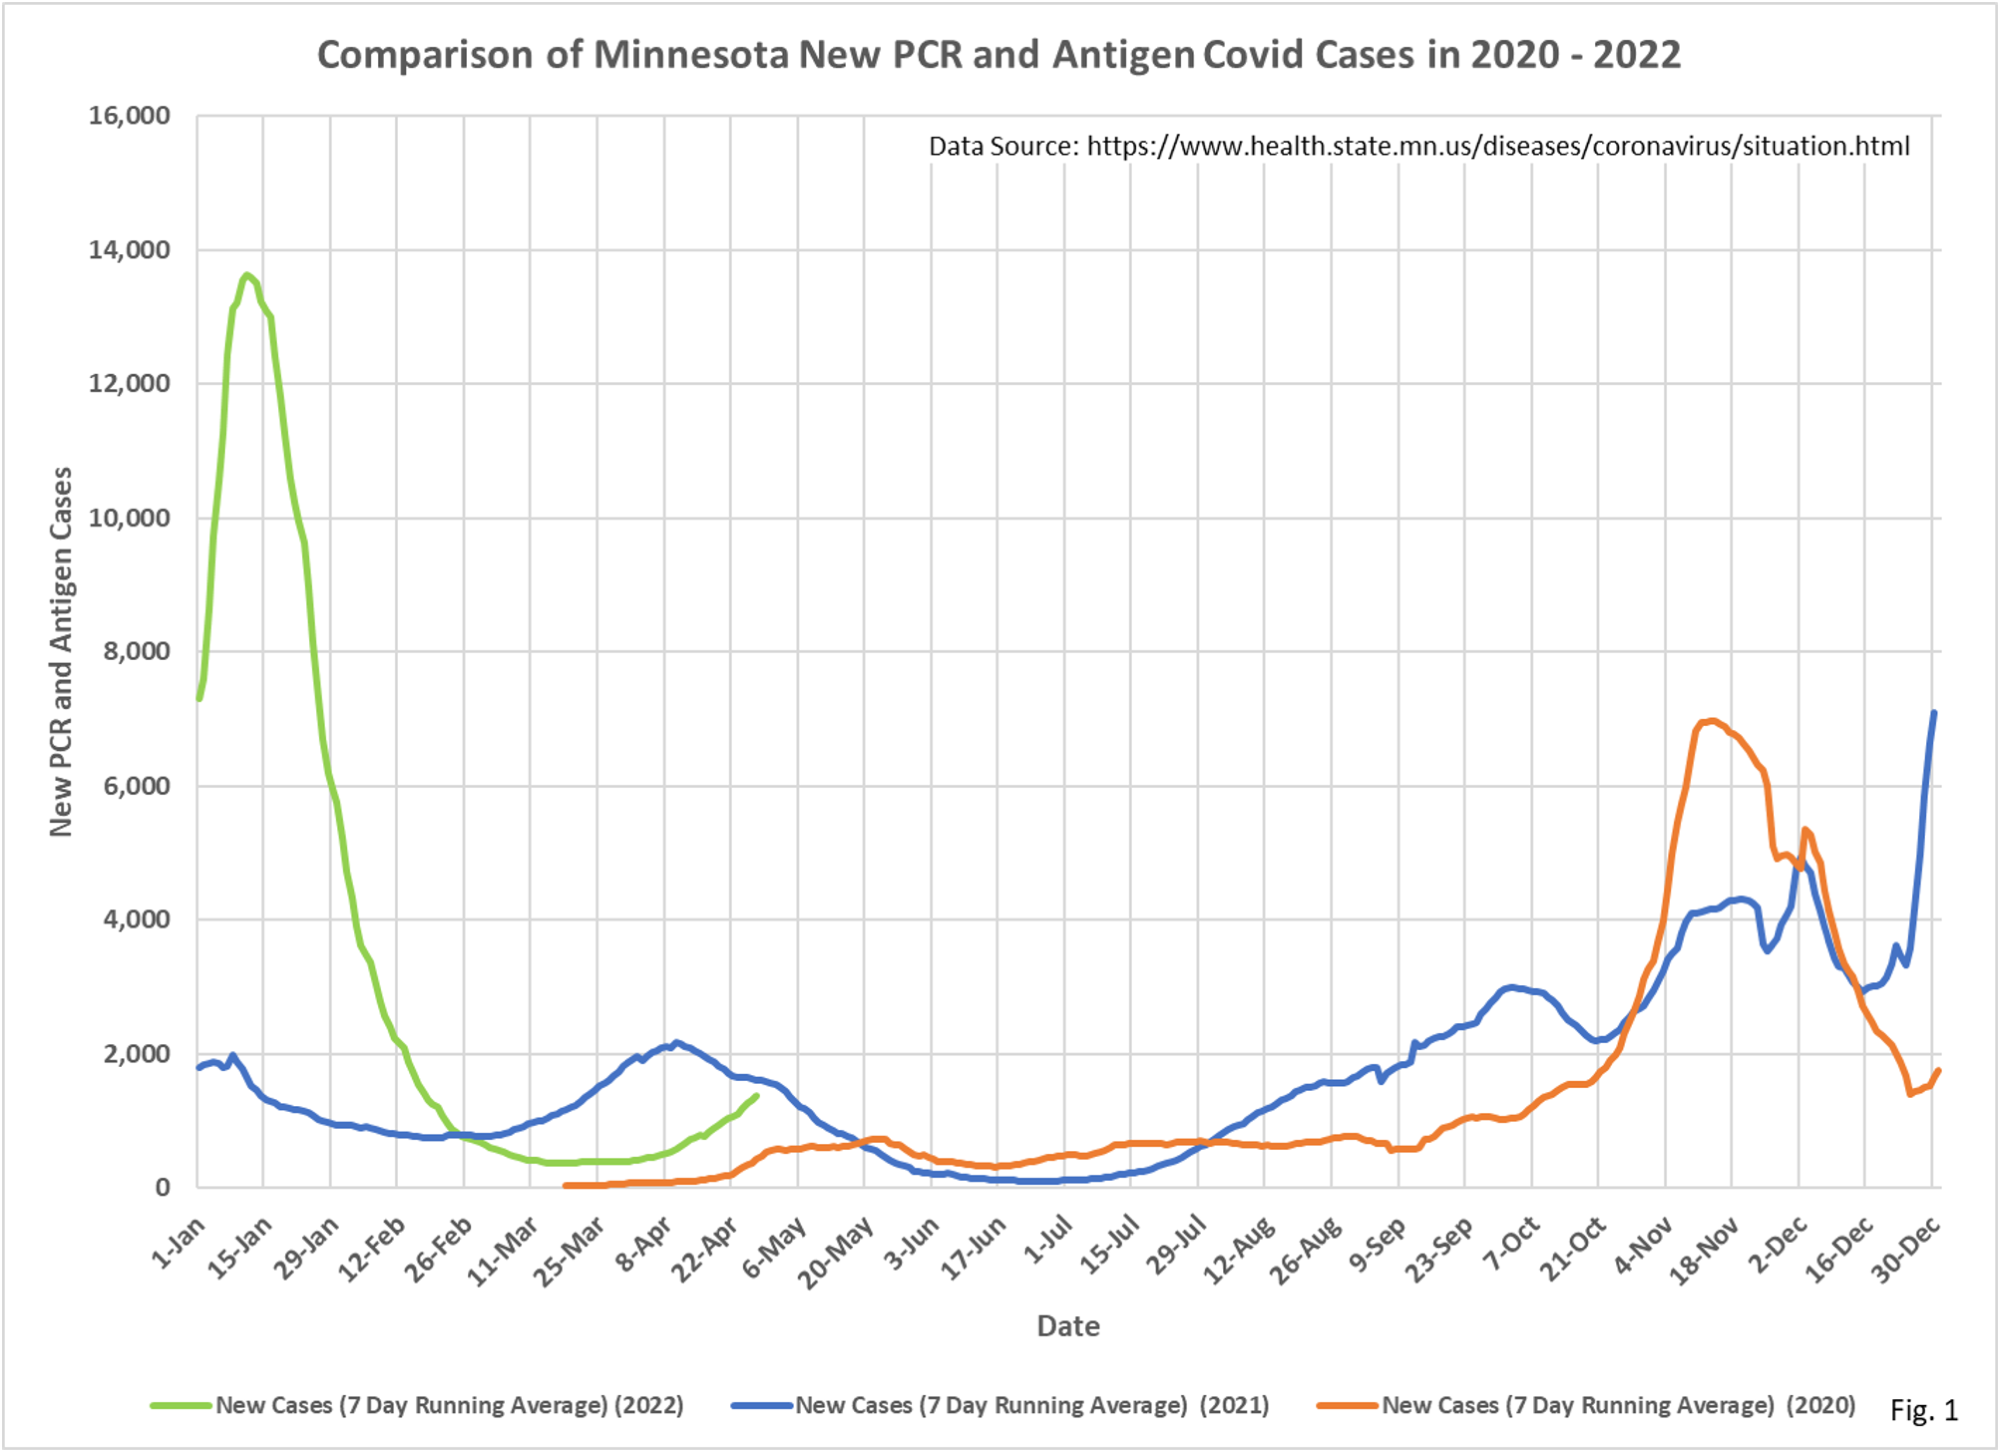
- Fig. 1: New daily cases per day bottomed out at 374 average cases per day on 3/20/2022. Daily cases have now risen to 1370 cases on 4/28/2022 on the most recent date displayed (continuing our policy of not displaying the most recent 7 days due to incomplete reporting by MDH).
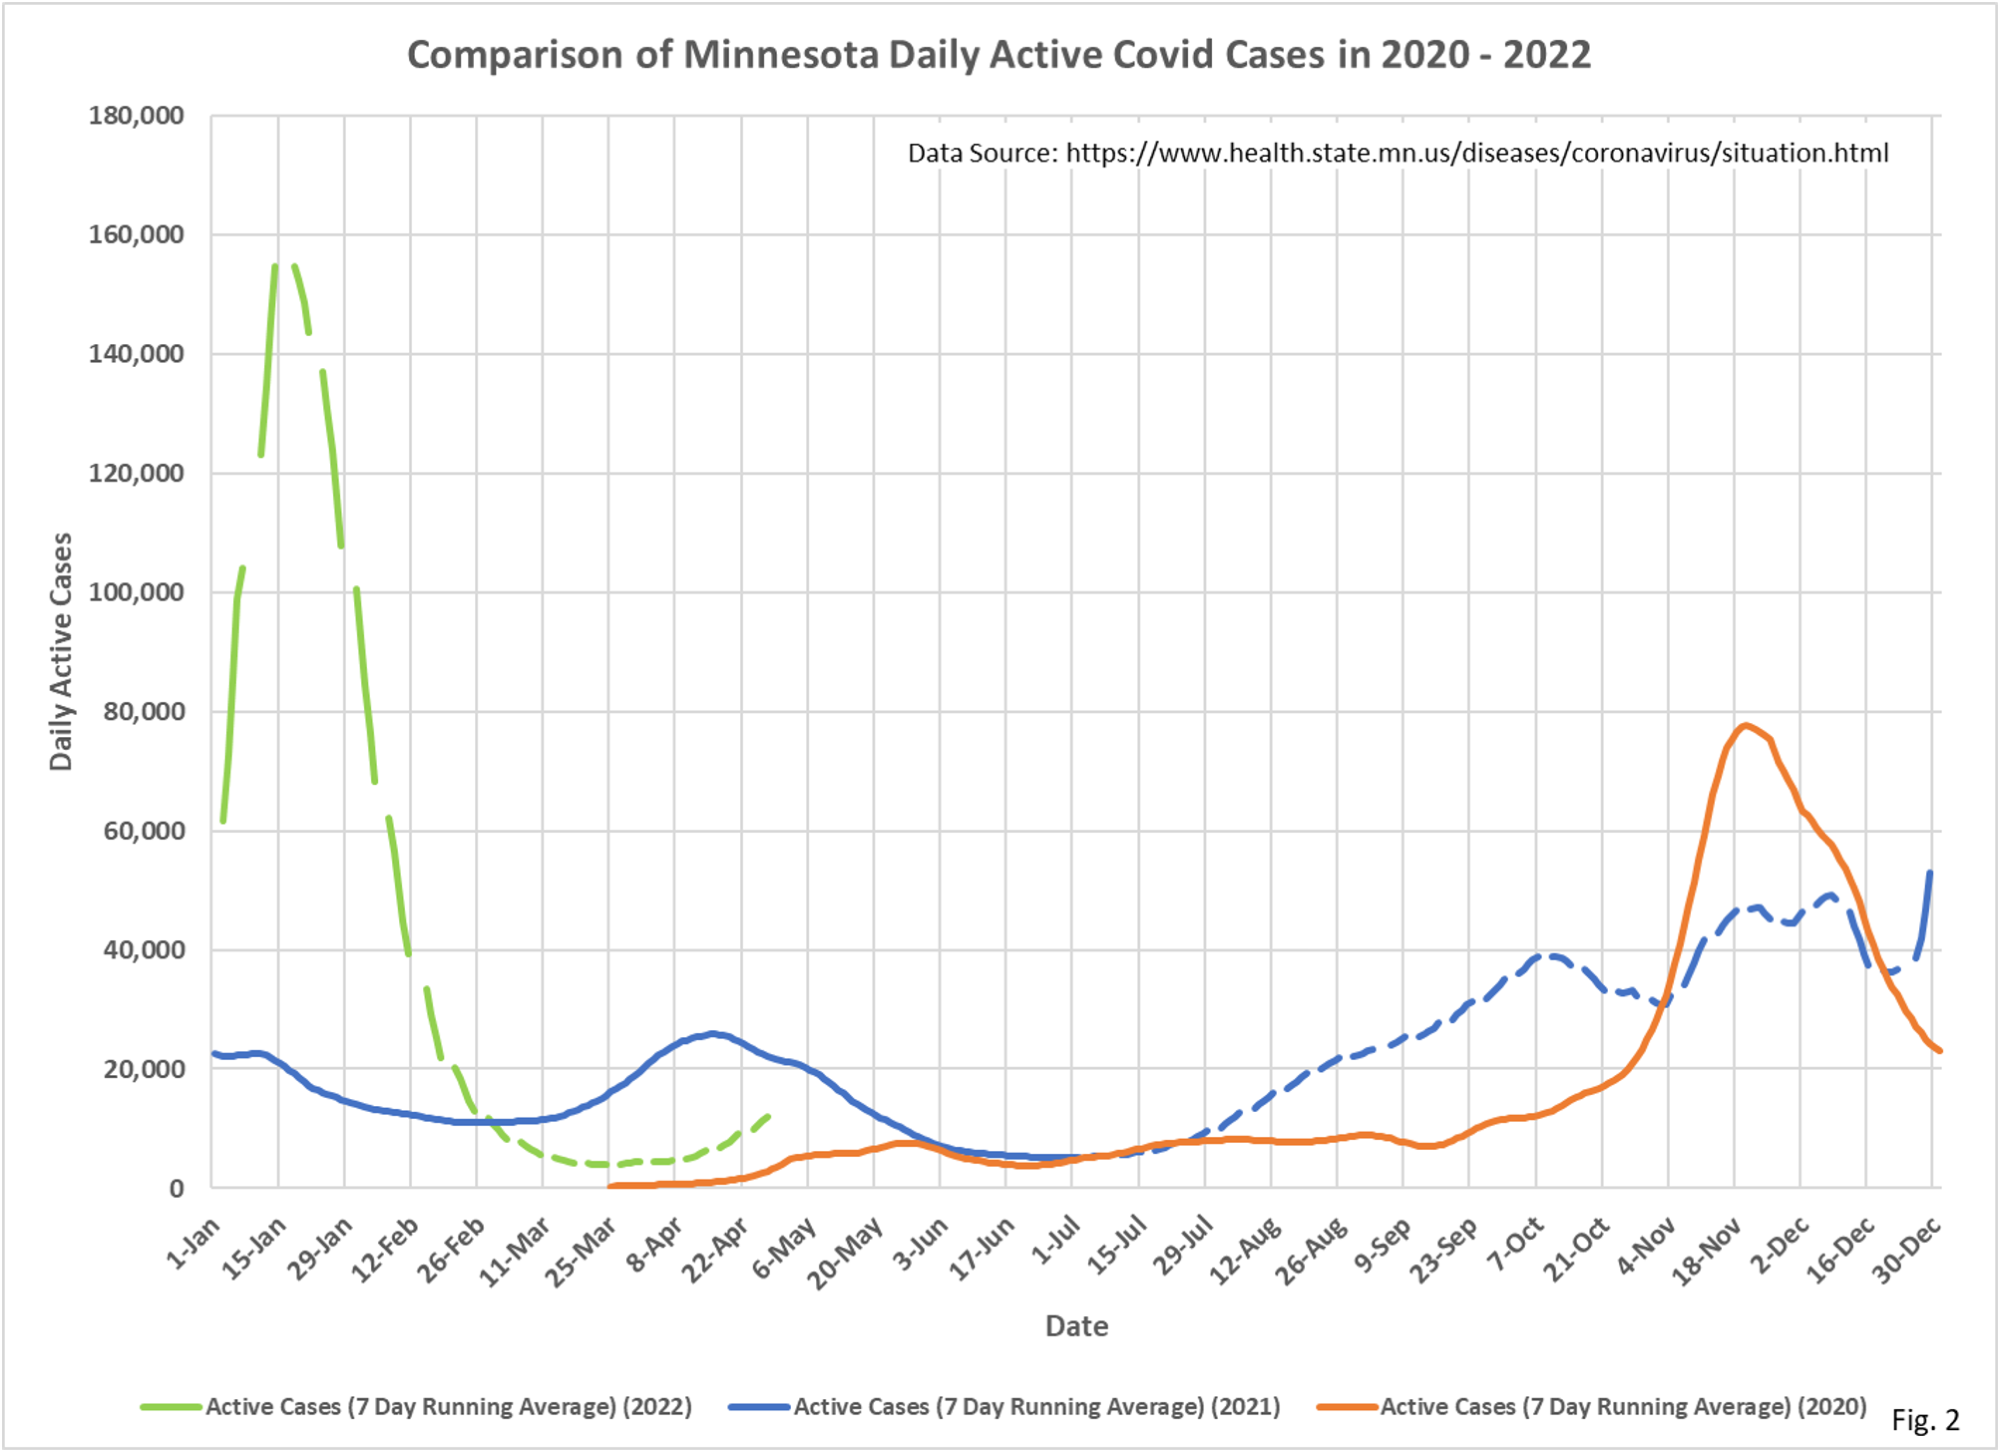
- Fig. 2: Active cases reached a recent low at 4,053 cases on 3/24/2022, and have since risen to 12,019 active cases on 4/28/2022.
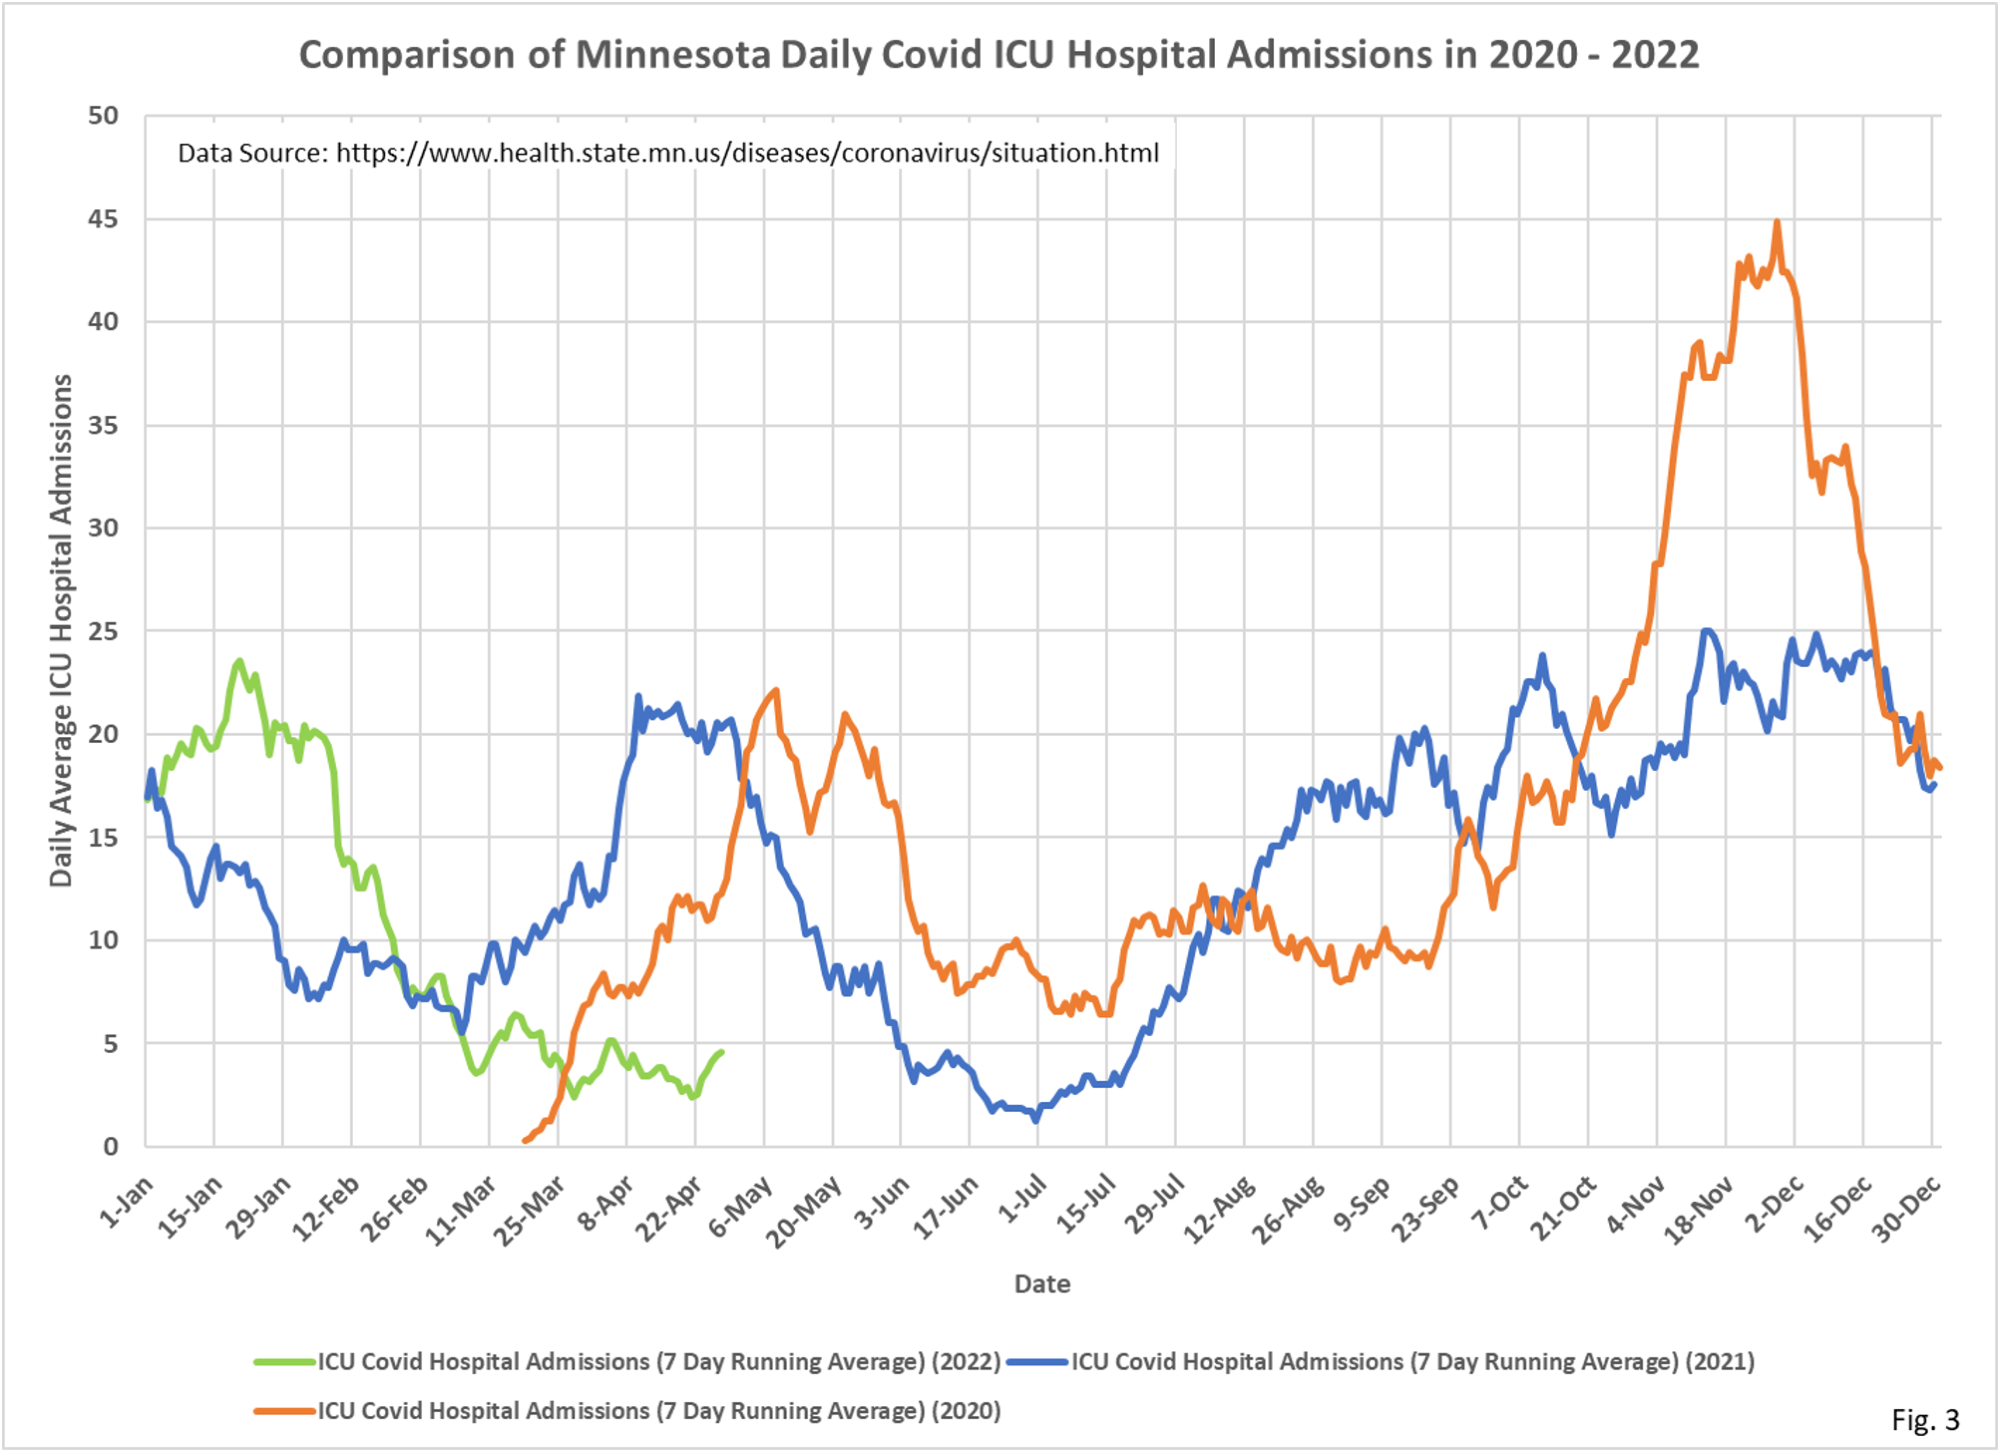
- Fig. 3: Covid ICU admissions achieved recent lows of 2.4 average admissions per day on 3/29/2022 and 4/22/2022, and have risen to 4.6 admissions per day on 4/28/2022.
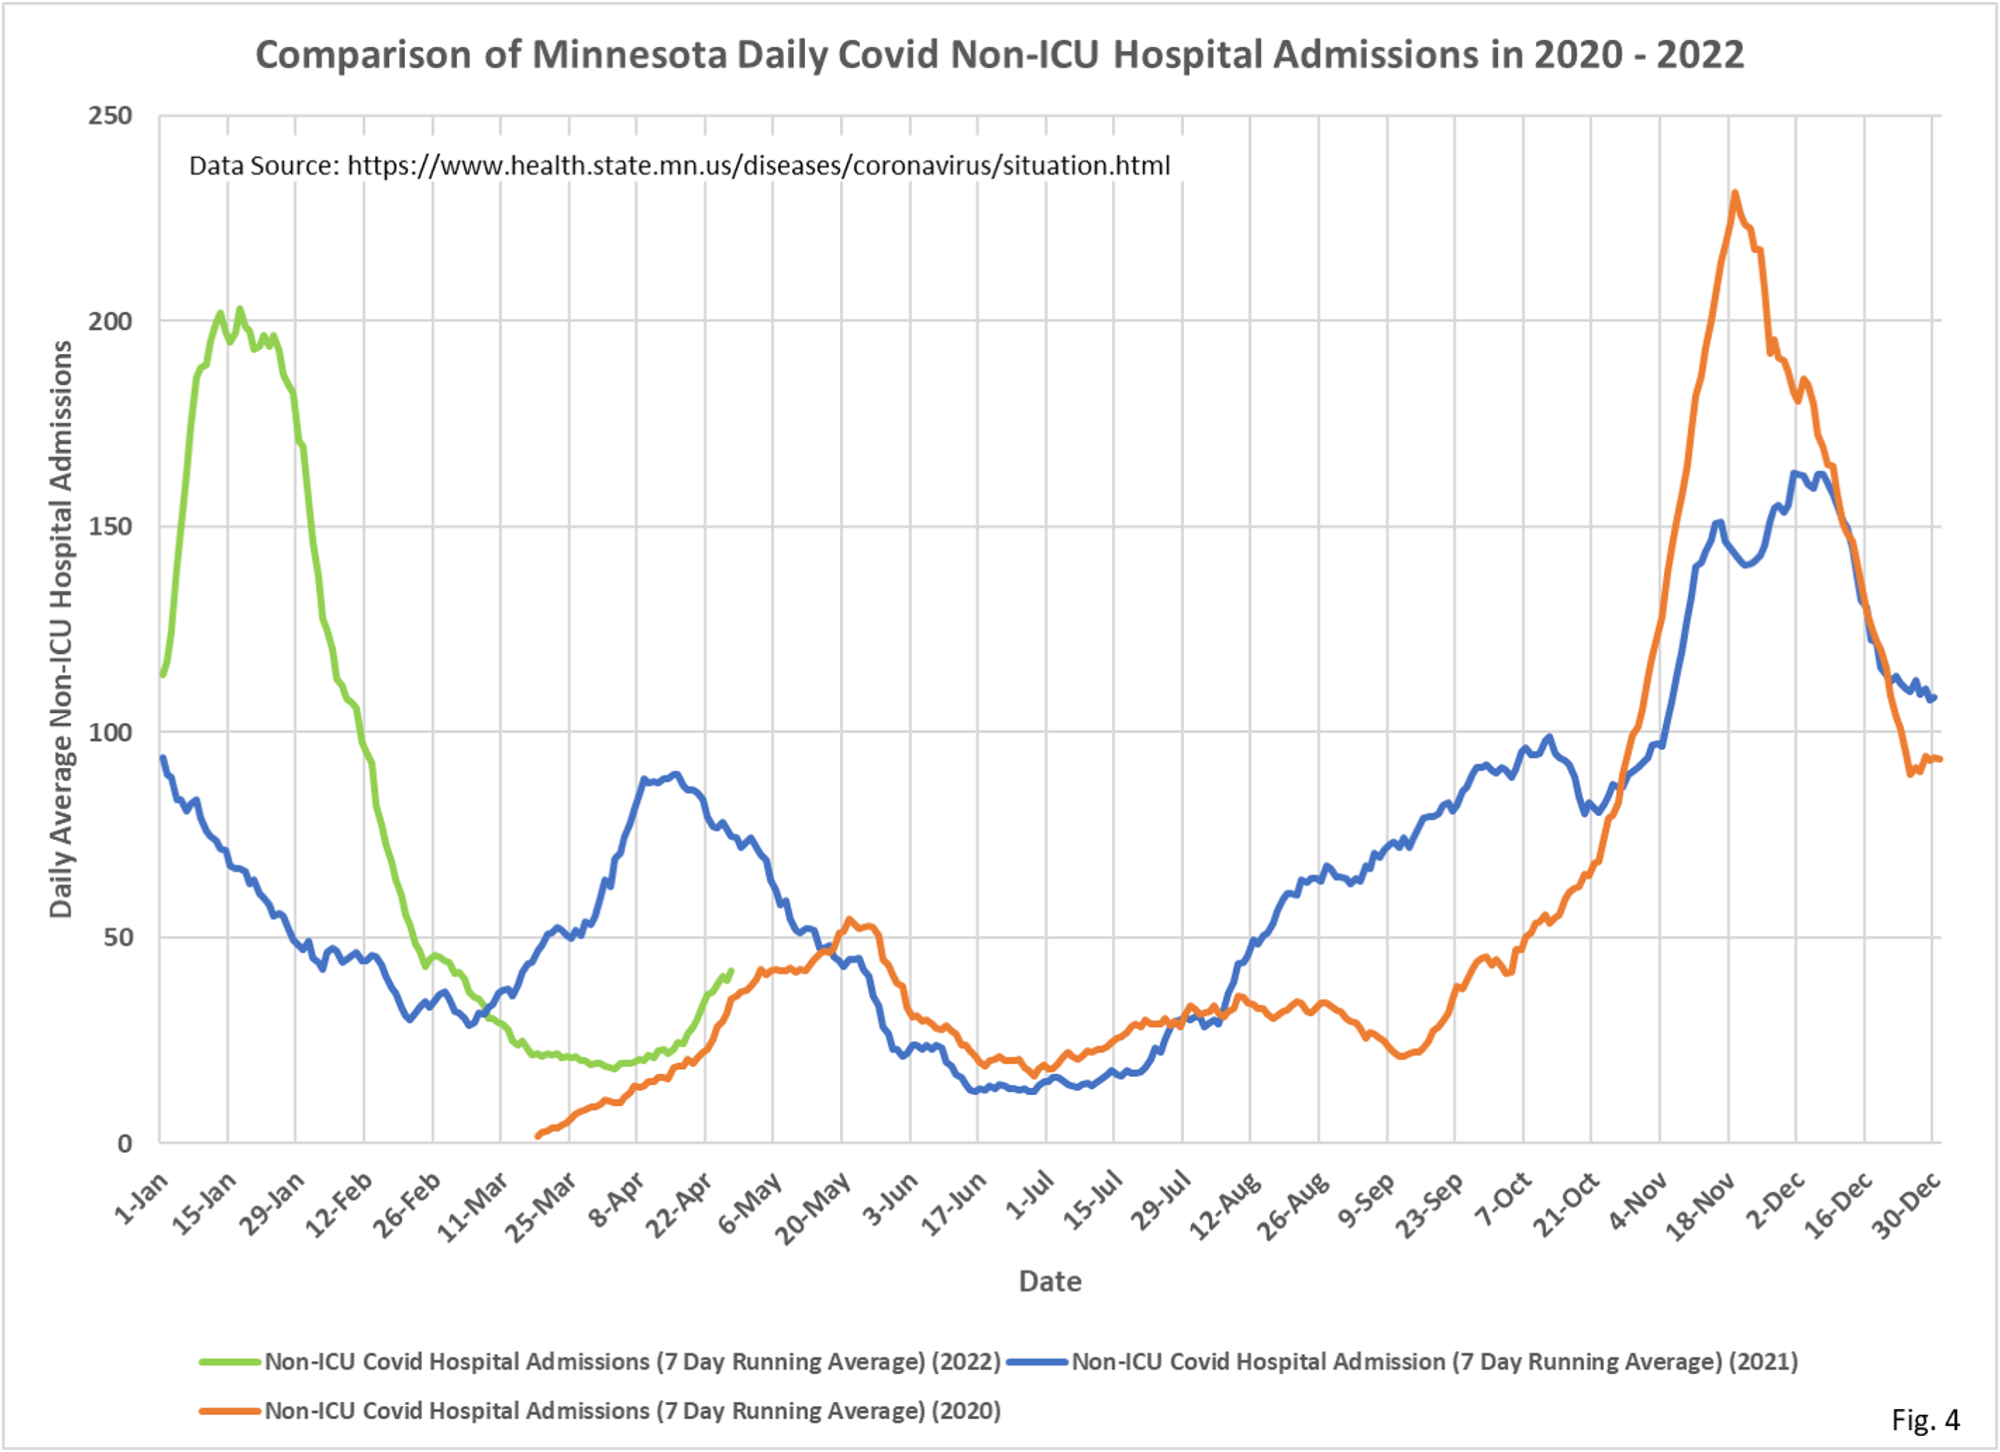
- Fig. 4: Covid Non-ICU admissions were at a minimum of 18.0 admissions per day on 4/4/2022, and most recently are at 41.9 admissions per day on 4/28/2022.
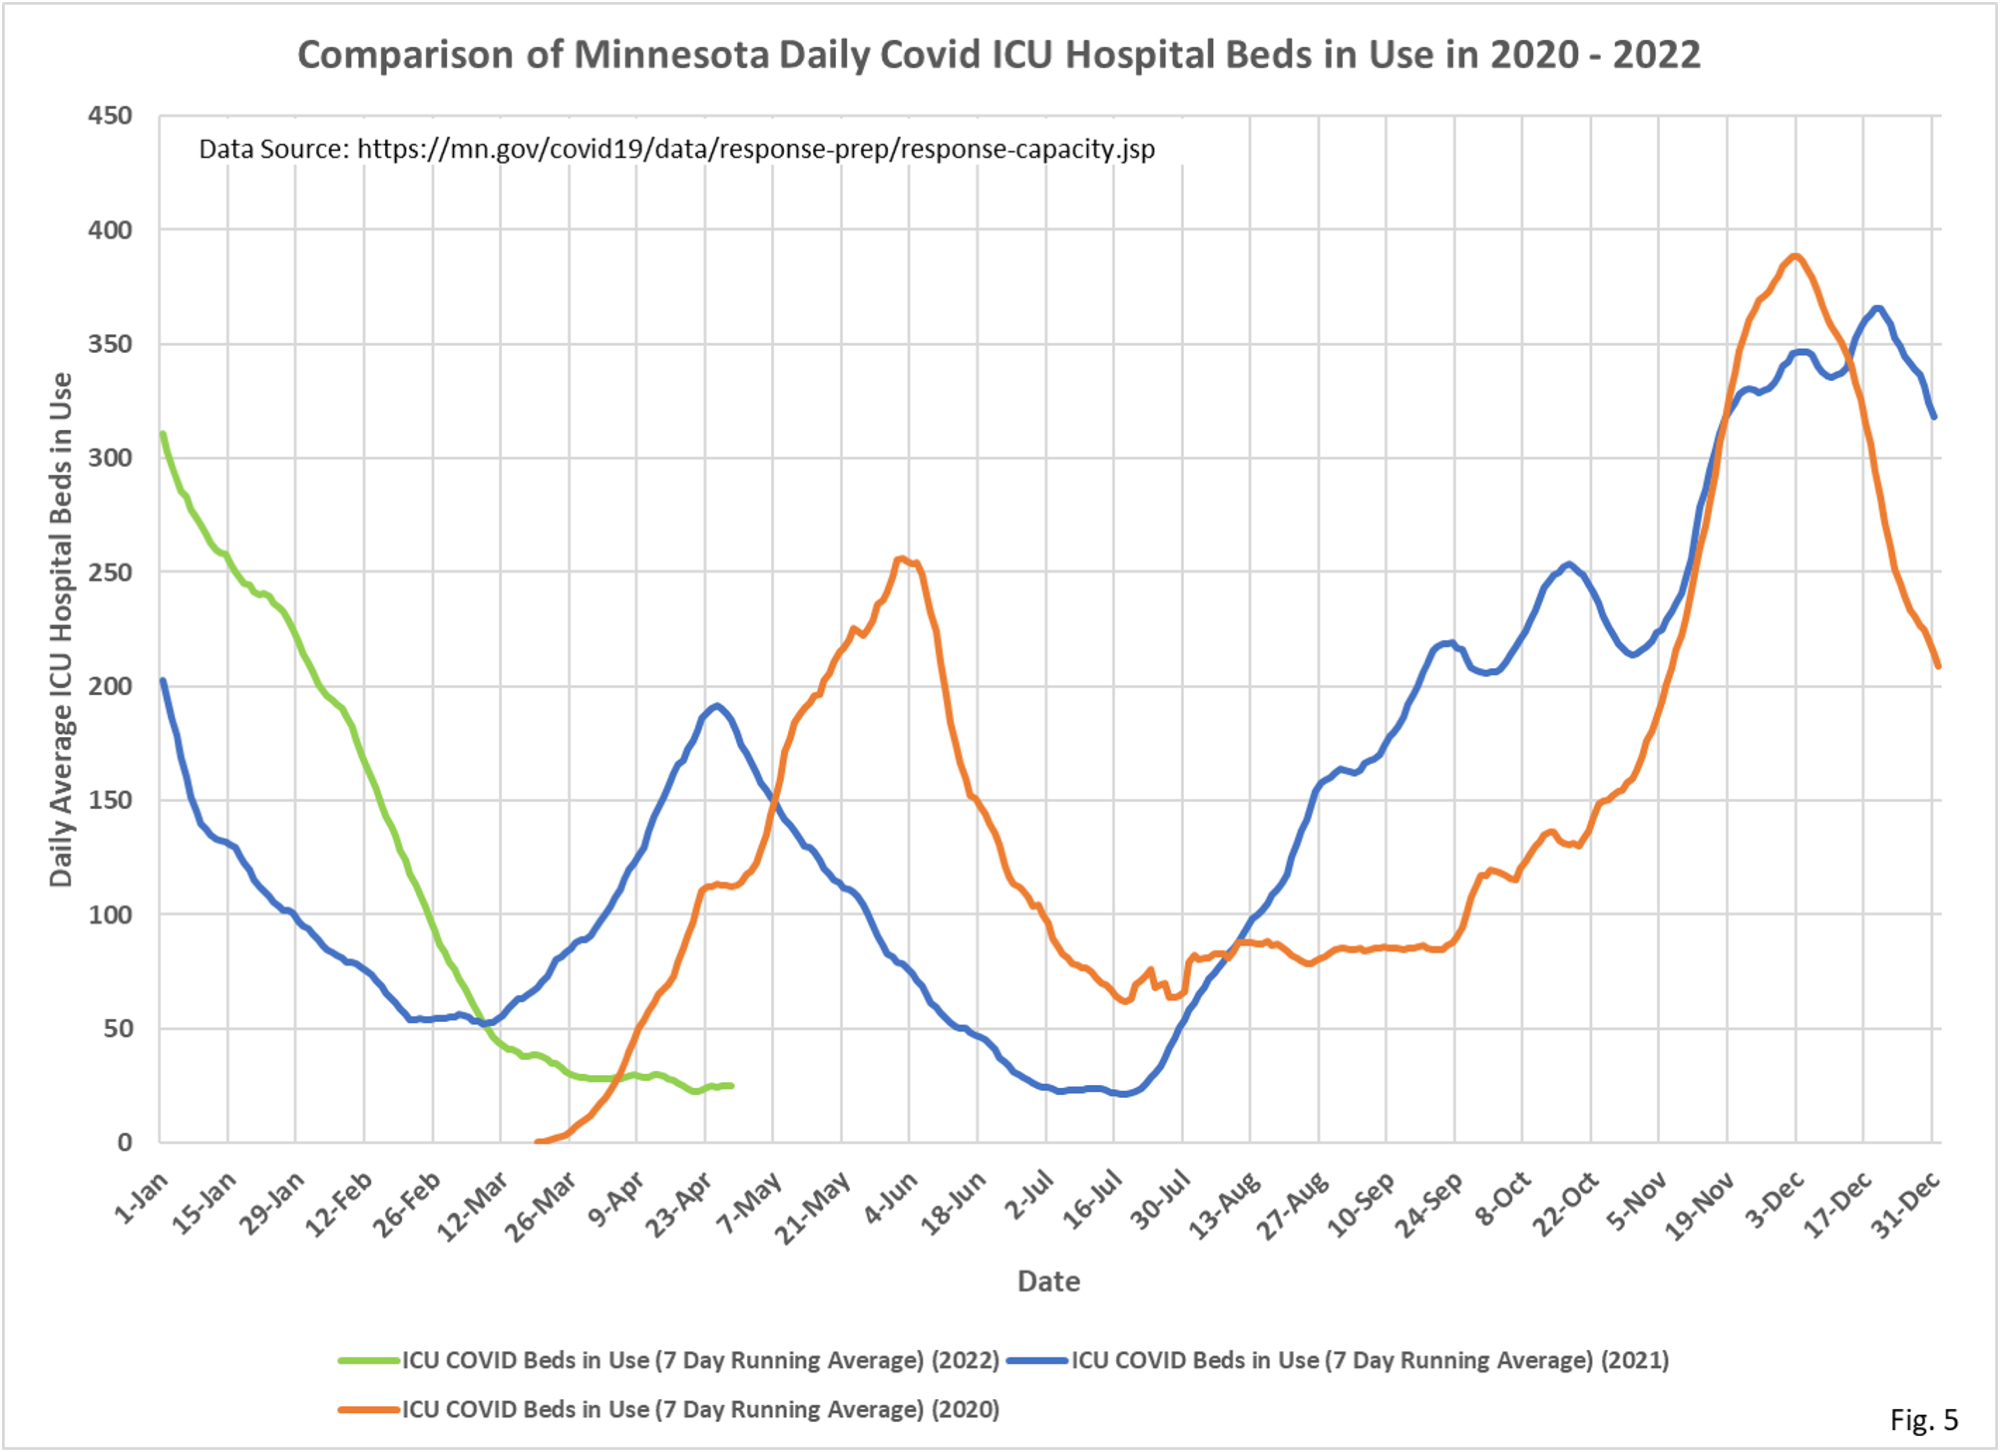
- Fig. 5: ICU Covid hospital beds in use appear to still be trending lower generally. There have been less than 30 ICU beds in use every day since 3/27/2022.
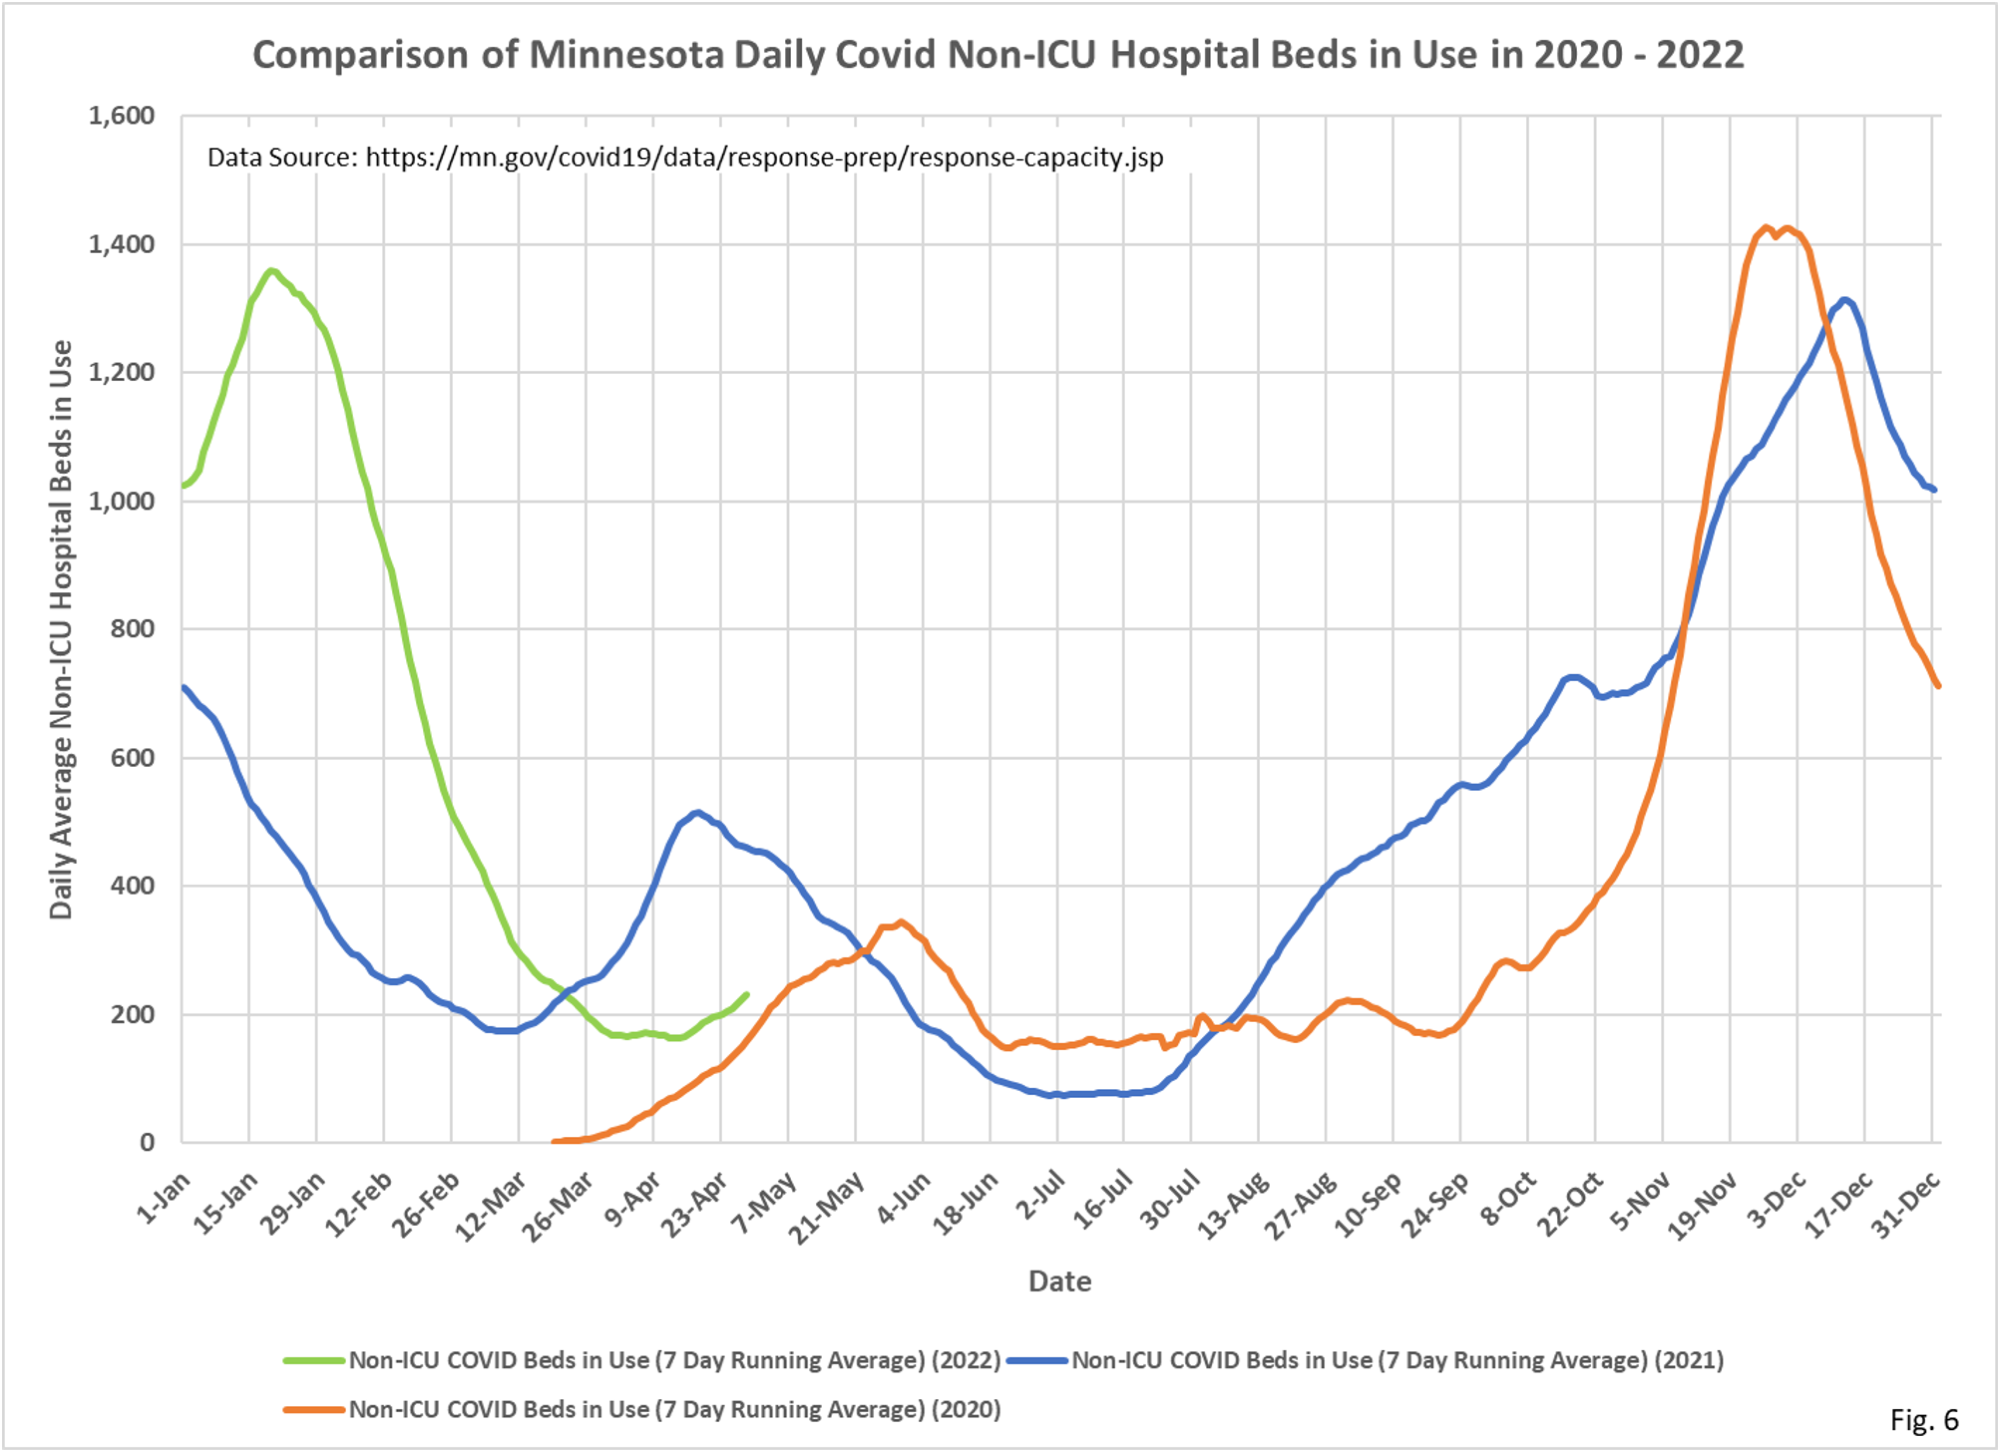
- Fig. 6: Non-ICU Covid hospital beds in use, in contrast to ICU beds in use, are increasing recently. The lowest number of Non-ICU Covid beds in use was 162.4 beds on 4/13/2022, and have risen to 231.3 beds in use on 4/28/2022.
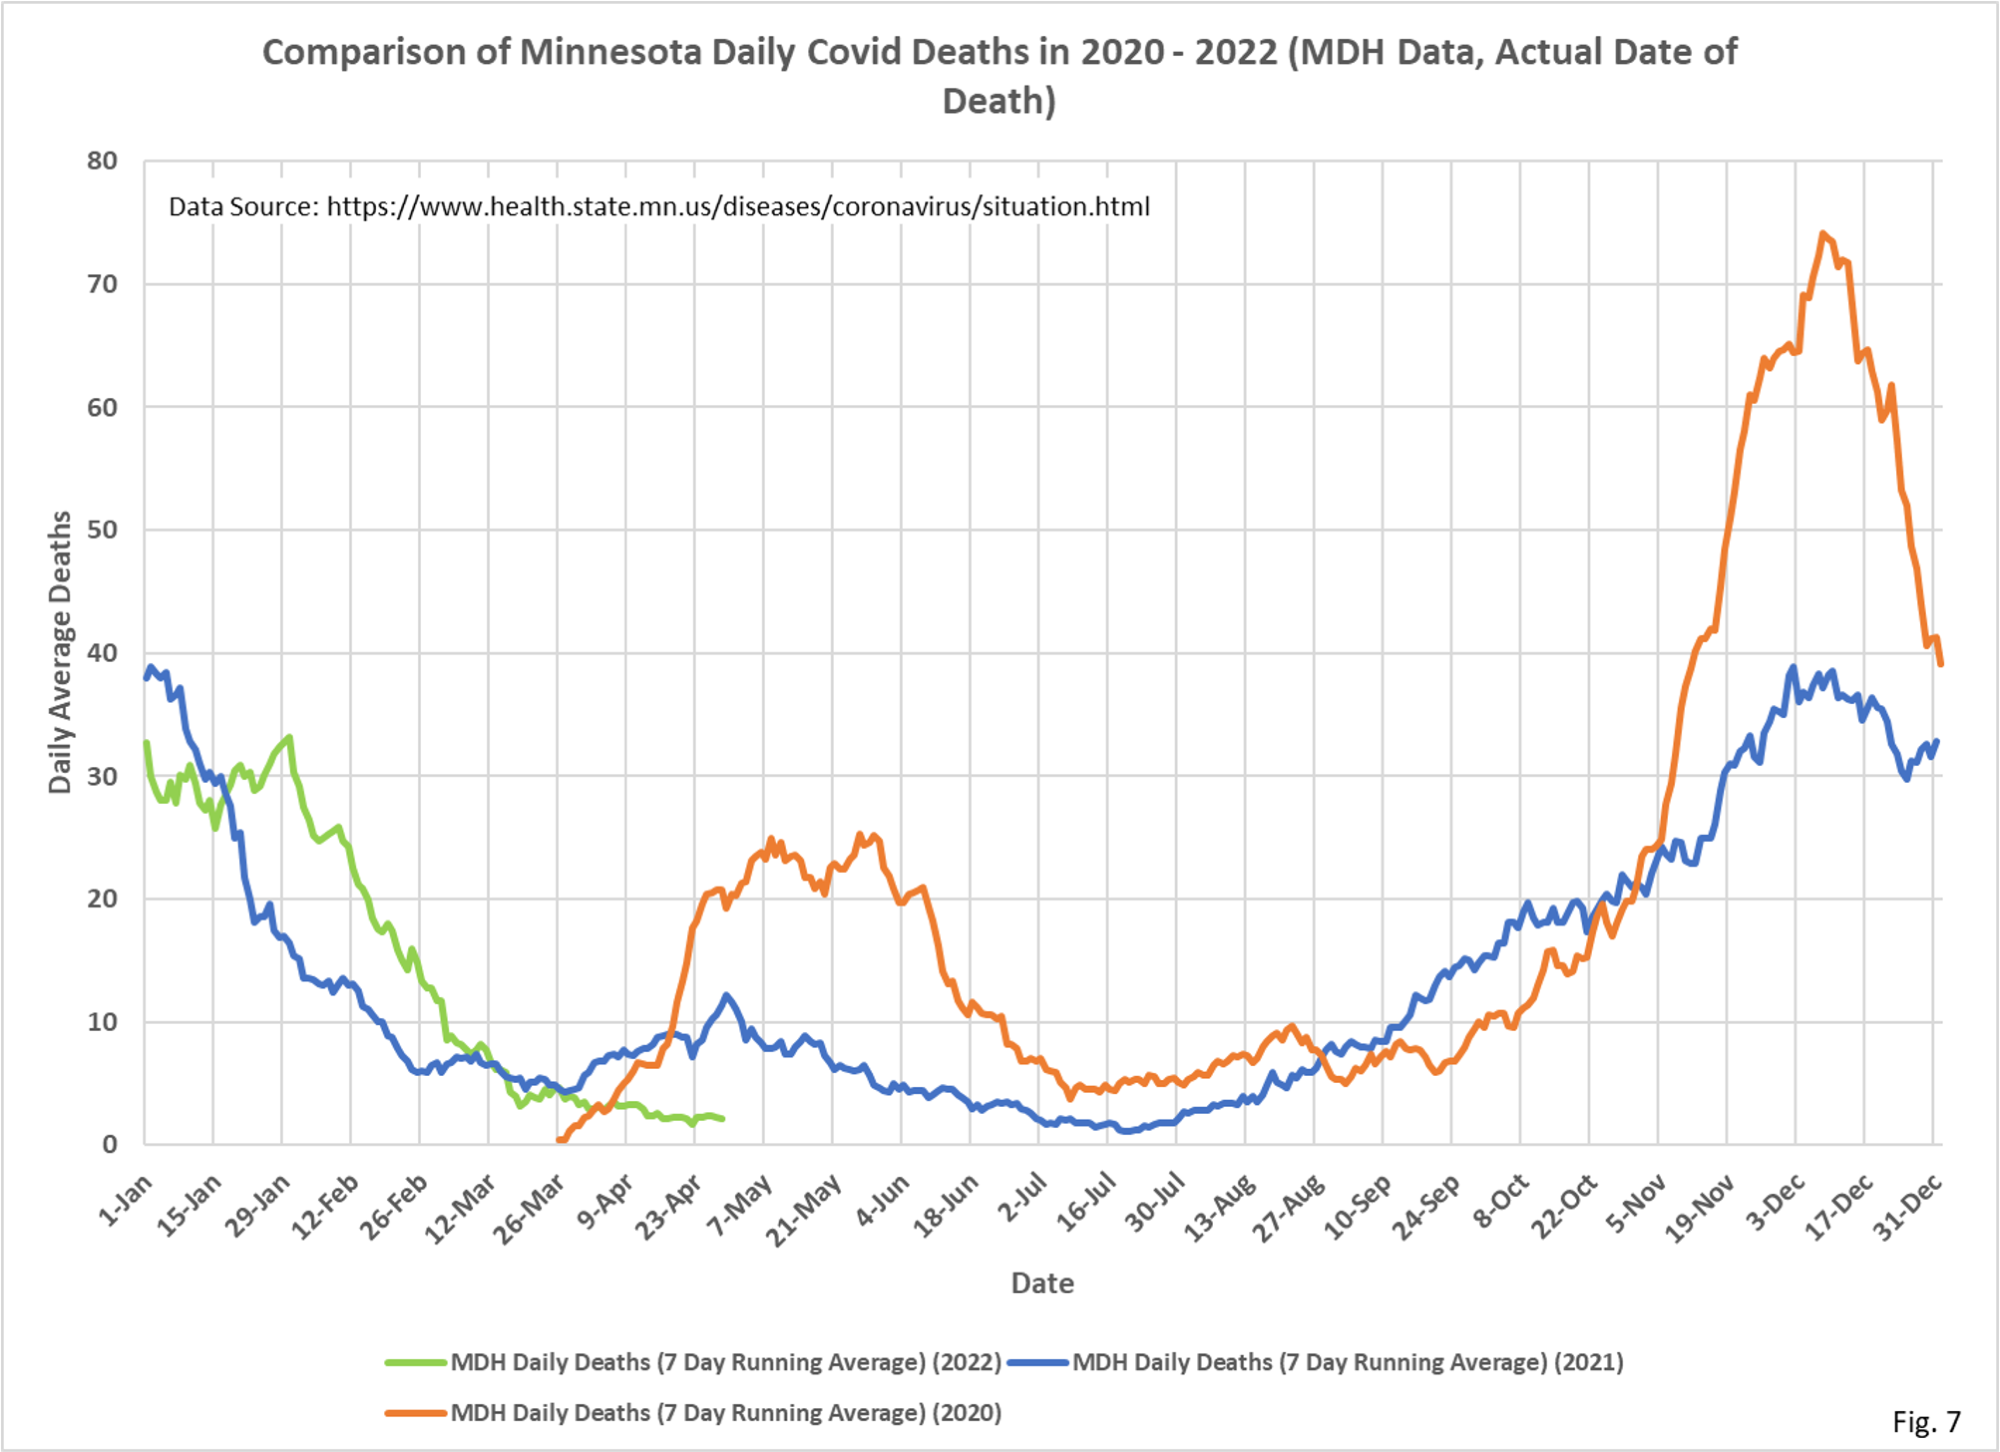
- Fig. 7: Deaths attributed to Covid continue to fall, despite the recent increase in cases. There were an average of 2.1 Covid deaths per day on 4/28/2022, but deaths reporting tends to lag and this average may increases slightly as more data is reported..
- For all charts the last 7 days of data is excluded to avoid charting incomplete data. For the deaths chart data from the last 14 days is excluded.
- All data is taken from the Minnesota Department of Health Situation Update for OCVID-19 web page https://www.health.state.mn.
us/diseases/coronavirus/ situation.html and from the Response and Preparation web page https://mn.gov/covid19/data/ response-prep/response- capacity.jsp. - All data is shown as 7 day running averages.

