There is a lot of CV-19 out there, but not showing up in the official stats. And it is very mild. You may have seen headlines about how CV-19 deaths have been undercounted around the world. I can’t speak definitively about other countries, but there is no question that they are overcounted here, with unprecedented attribution methods. Some people try to treat the terror and lockdown deaths as CV-19 ones, but that is revisionist garbage–those are the result of the response, not CV-19. And exaggerating death counts and hospitalizations was a key part of the terror campaign. This week’s age structure charts, courtesy as usual of Dave Dixon’s outstanding work, show mild upticks in cases. And note that the majority of regular hospitalizations are likely incidentals.
 Dave’s notes:
- Overall, Covid cases, ICU admissions, and non-ICU admissions continue to rise slowly, while Covid deaths continue to generally decrease.
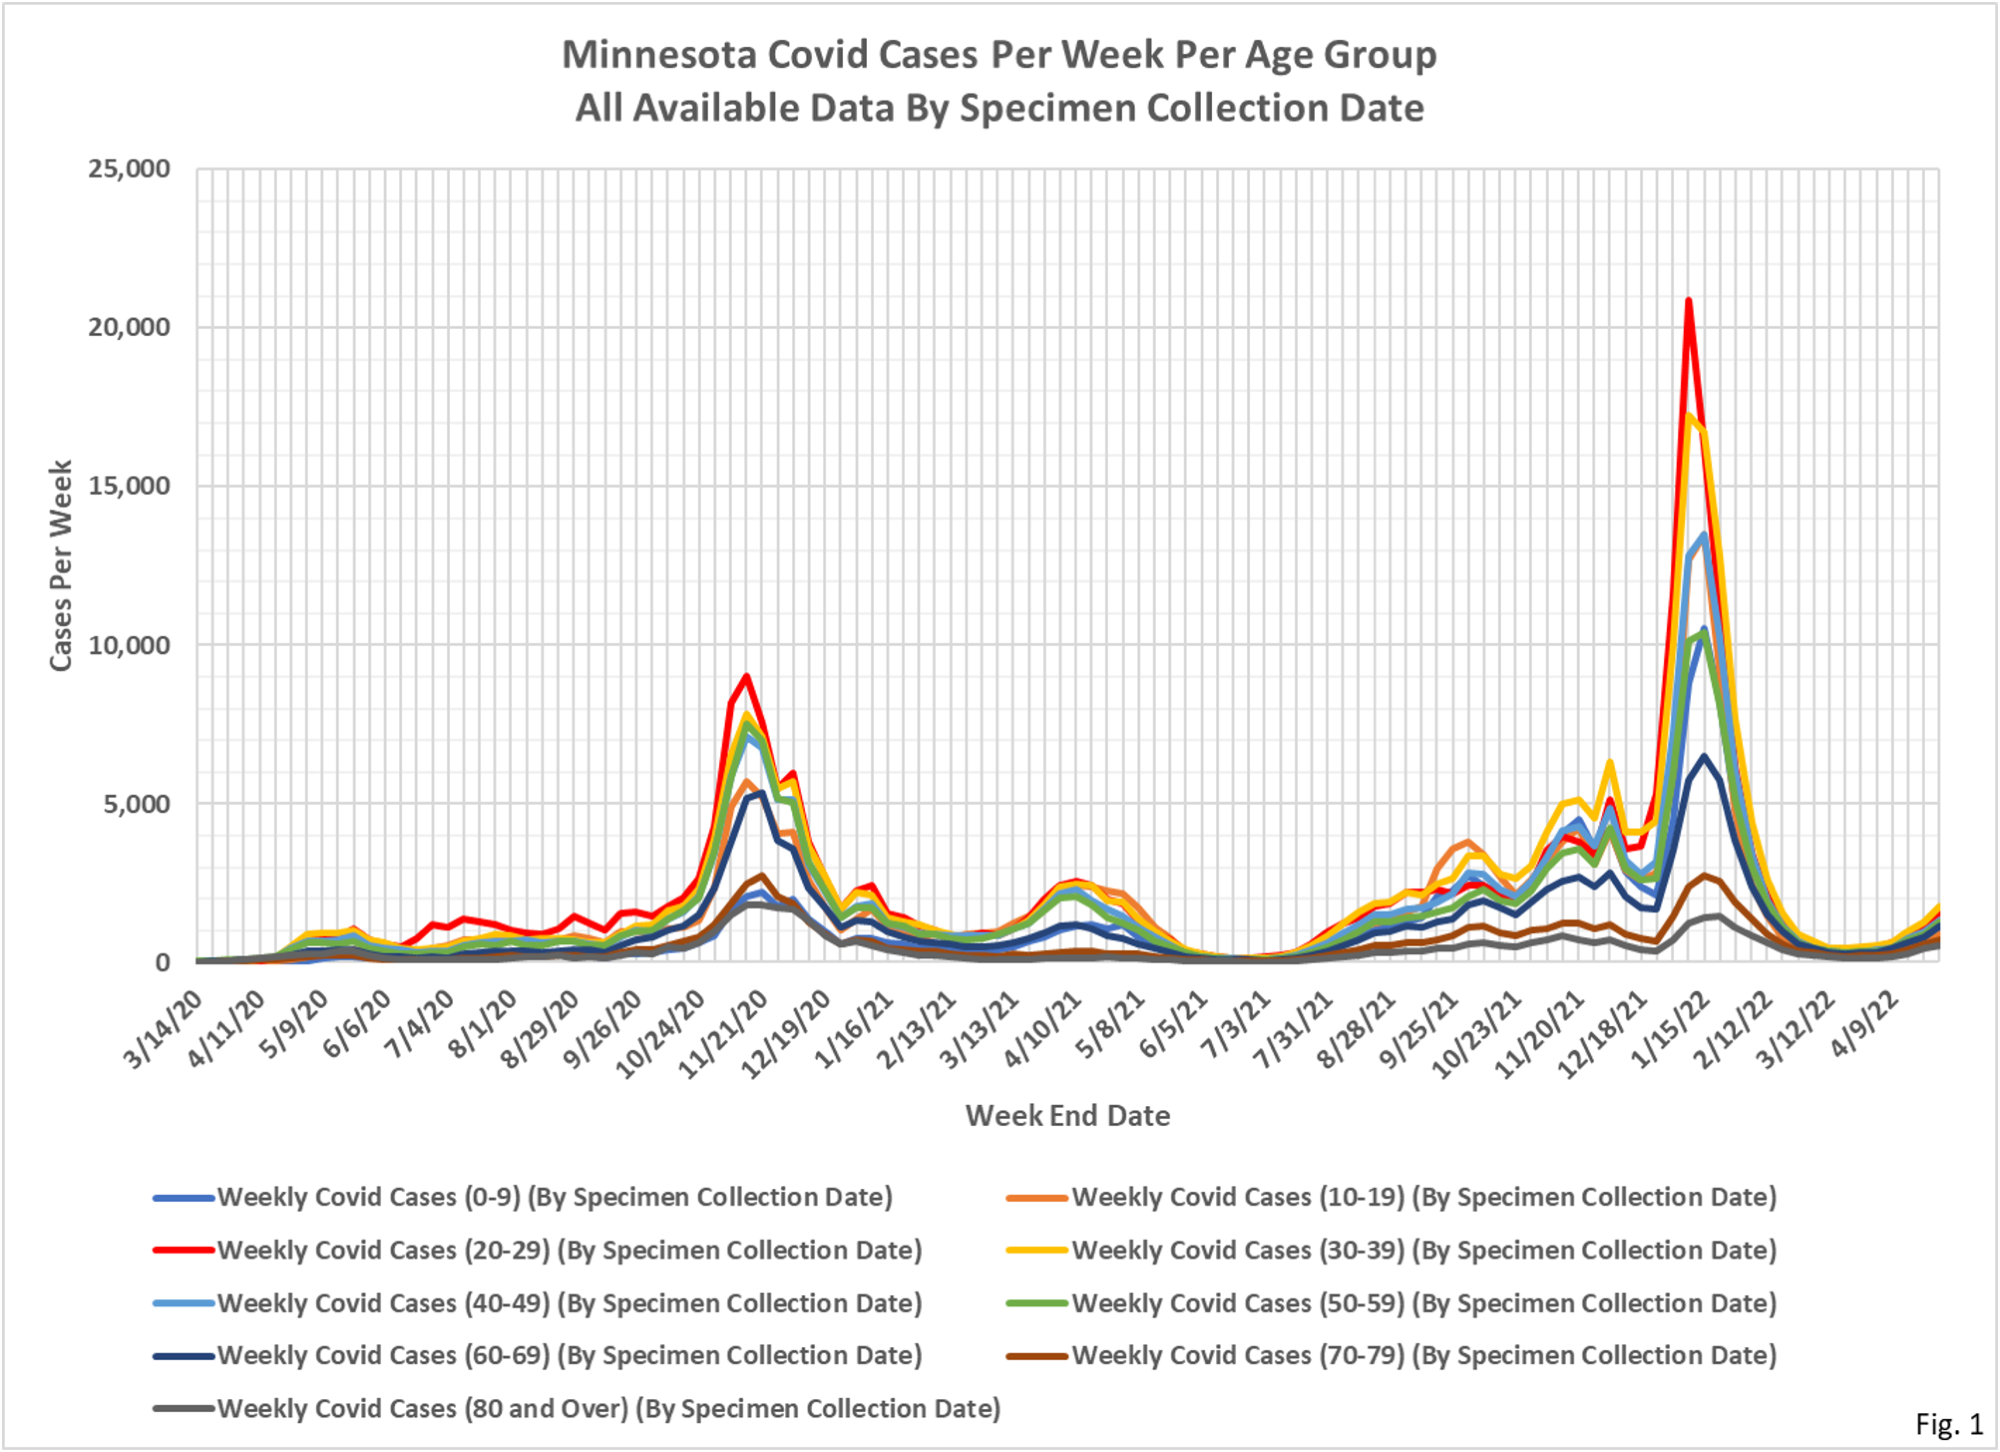
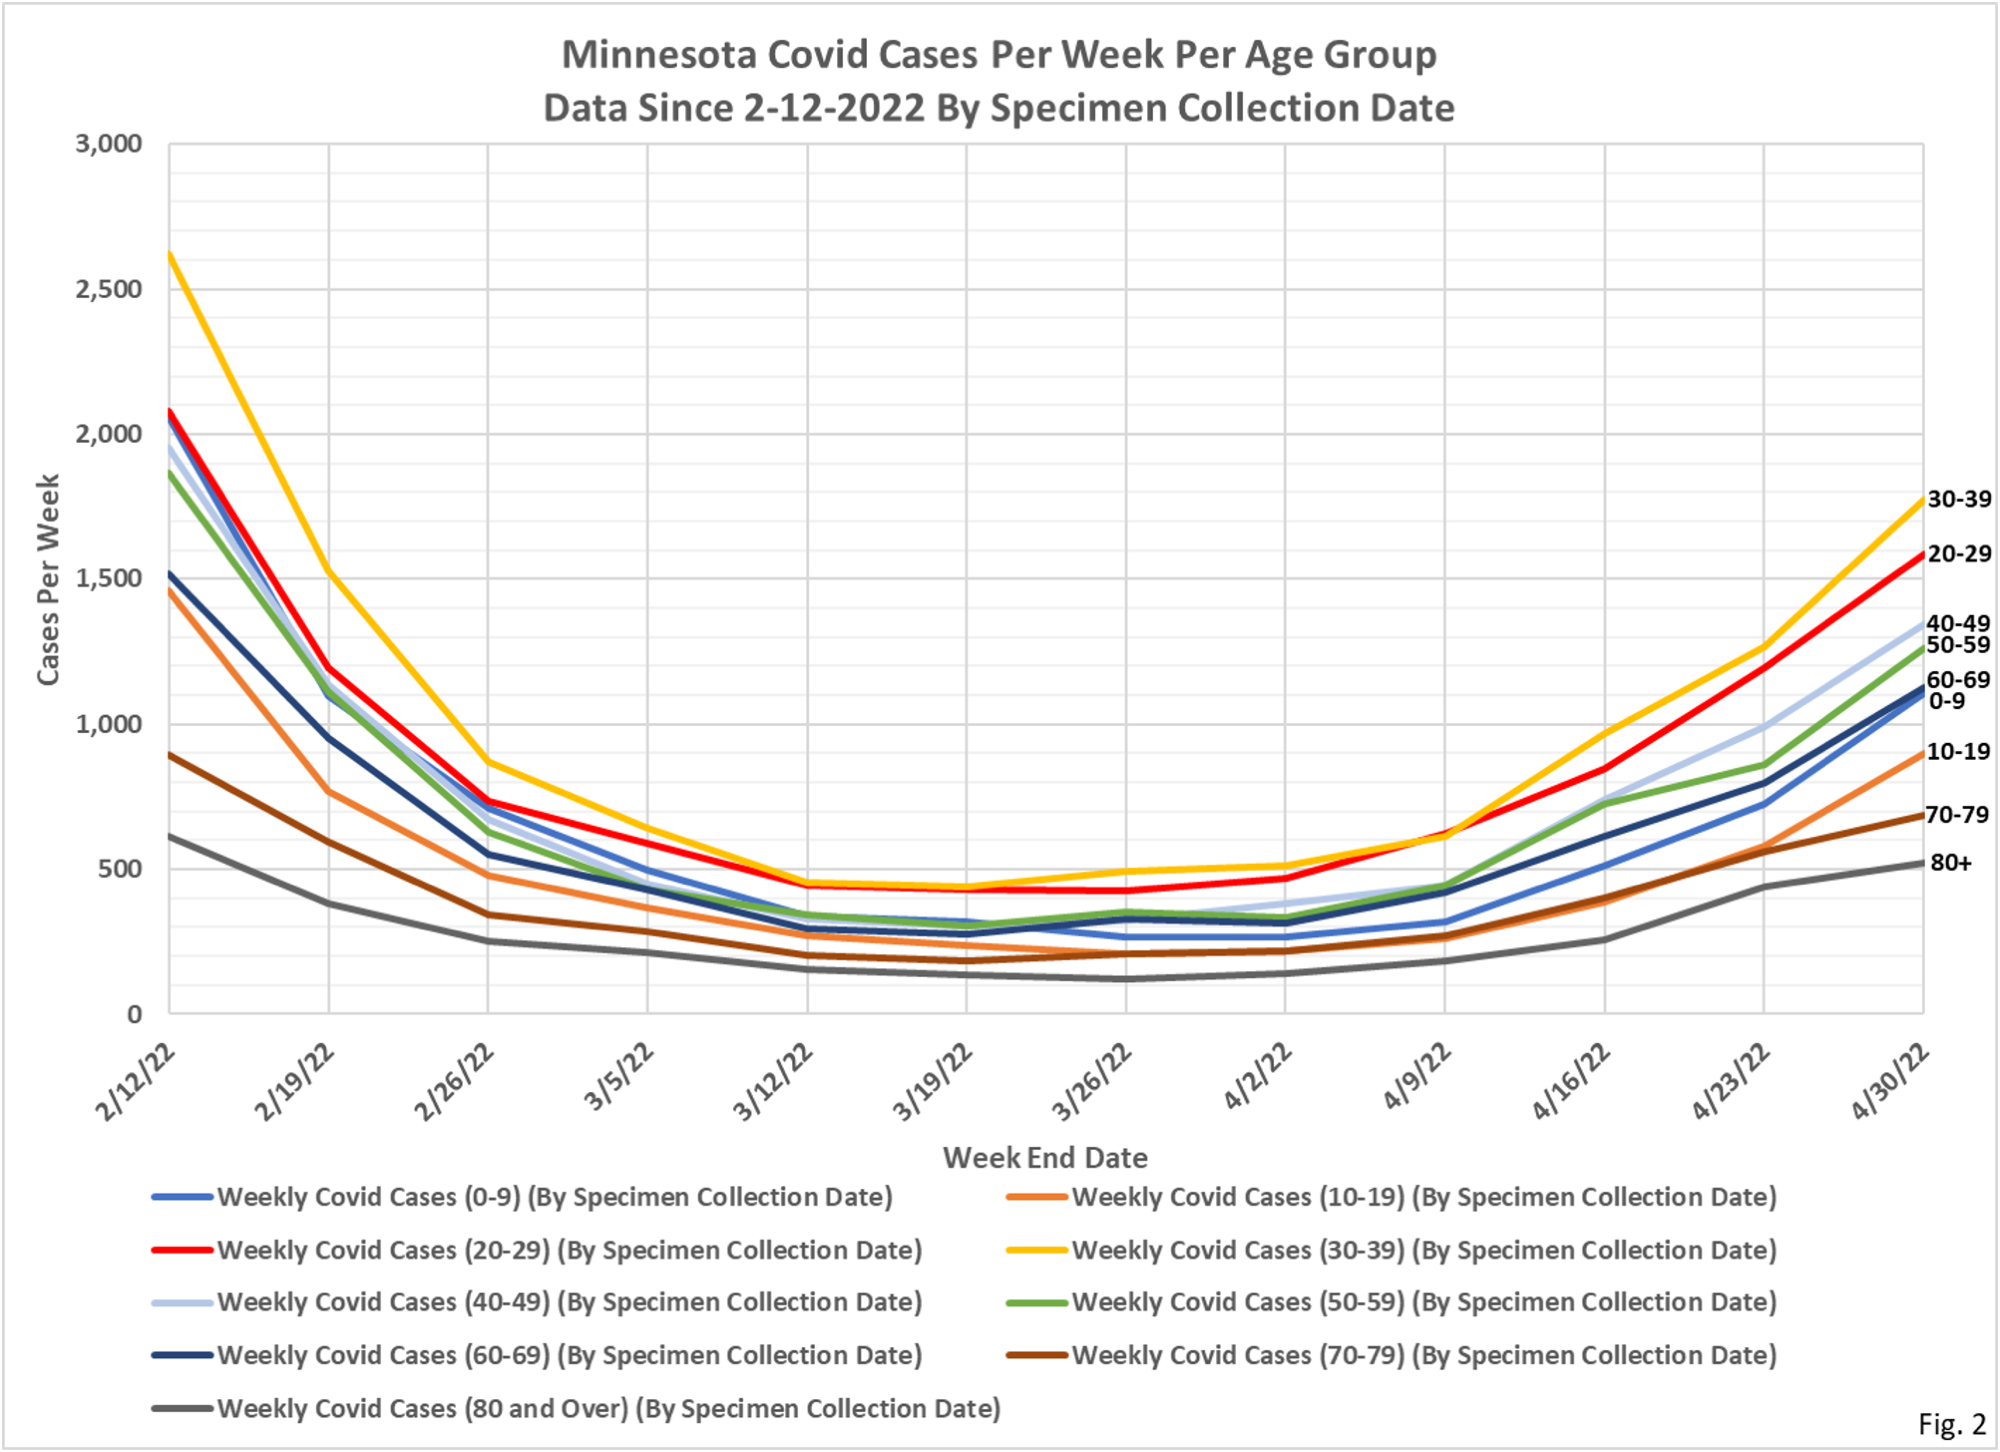
- Fig. 1 and 2: Covid Cases Per Week. The reported Covid cases this week are slightly higher again this week for all age groups, continuing a trend we have seen for 5 weeks now. Total reported cases for the week were 10,306 total for all age groups, an increase from the 7,417 revised cases reported last week.
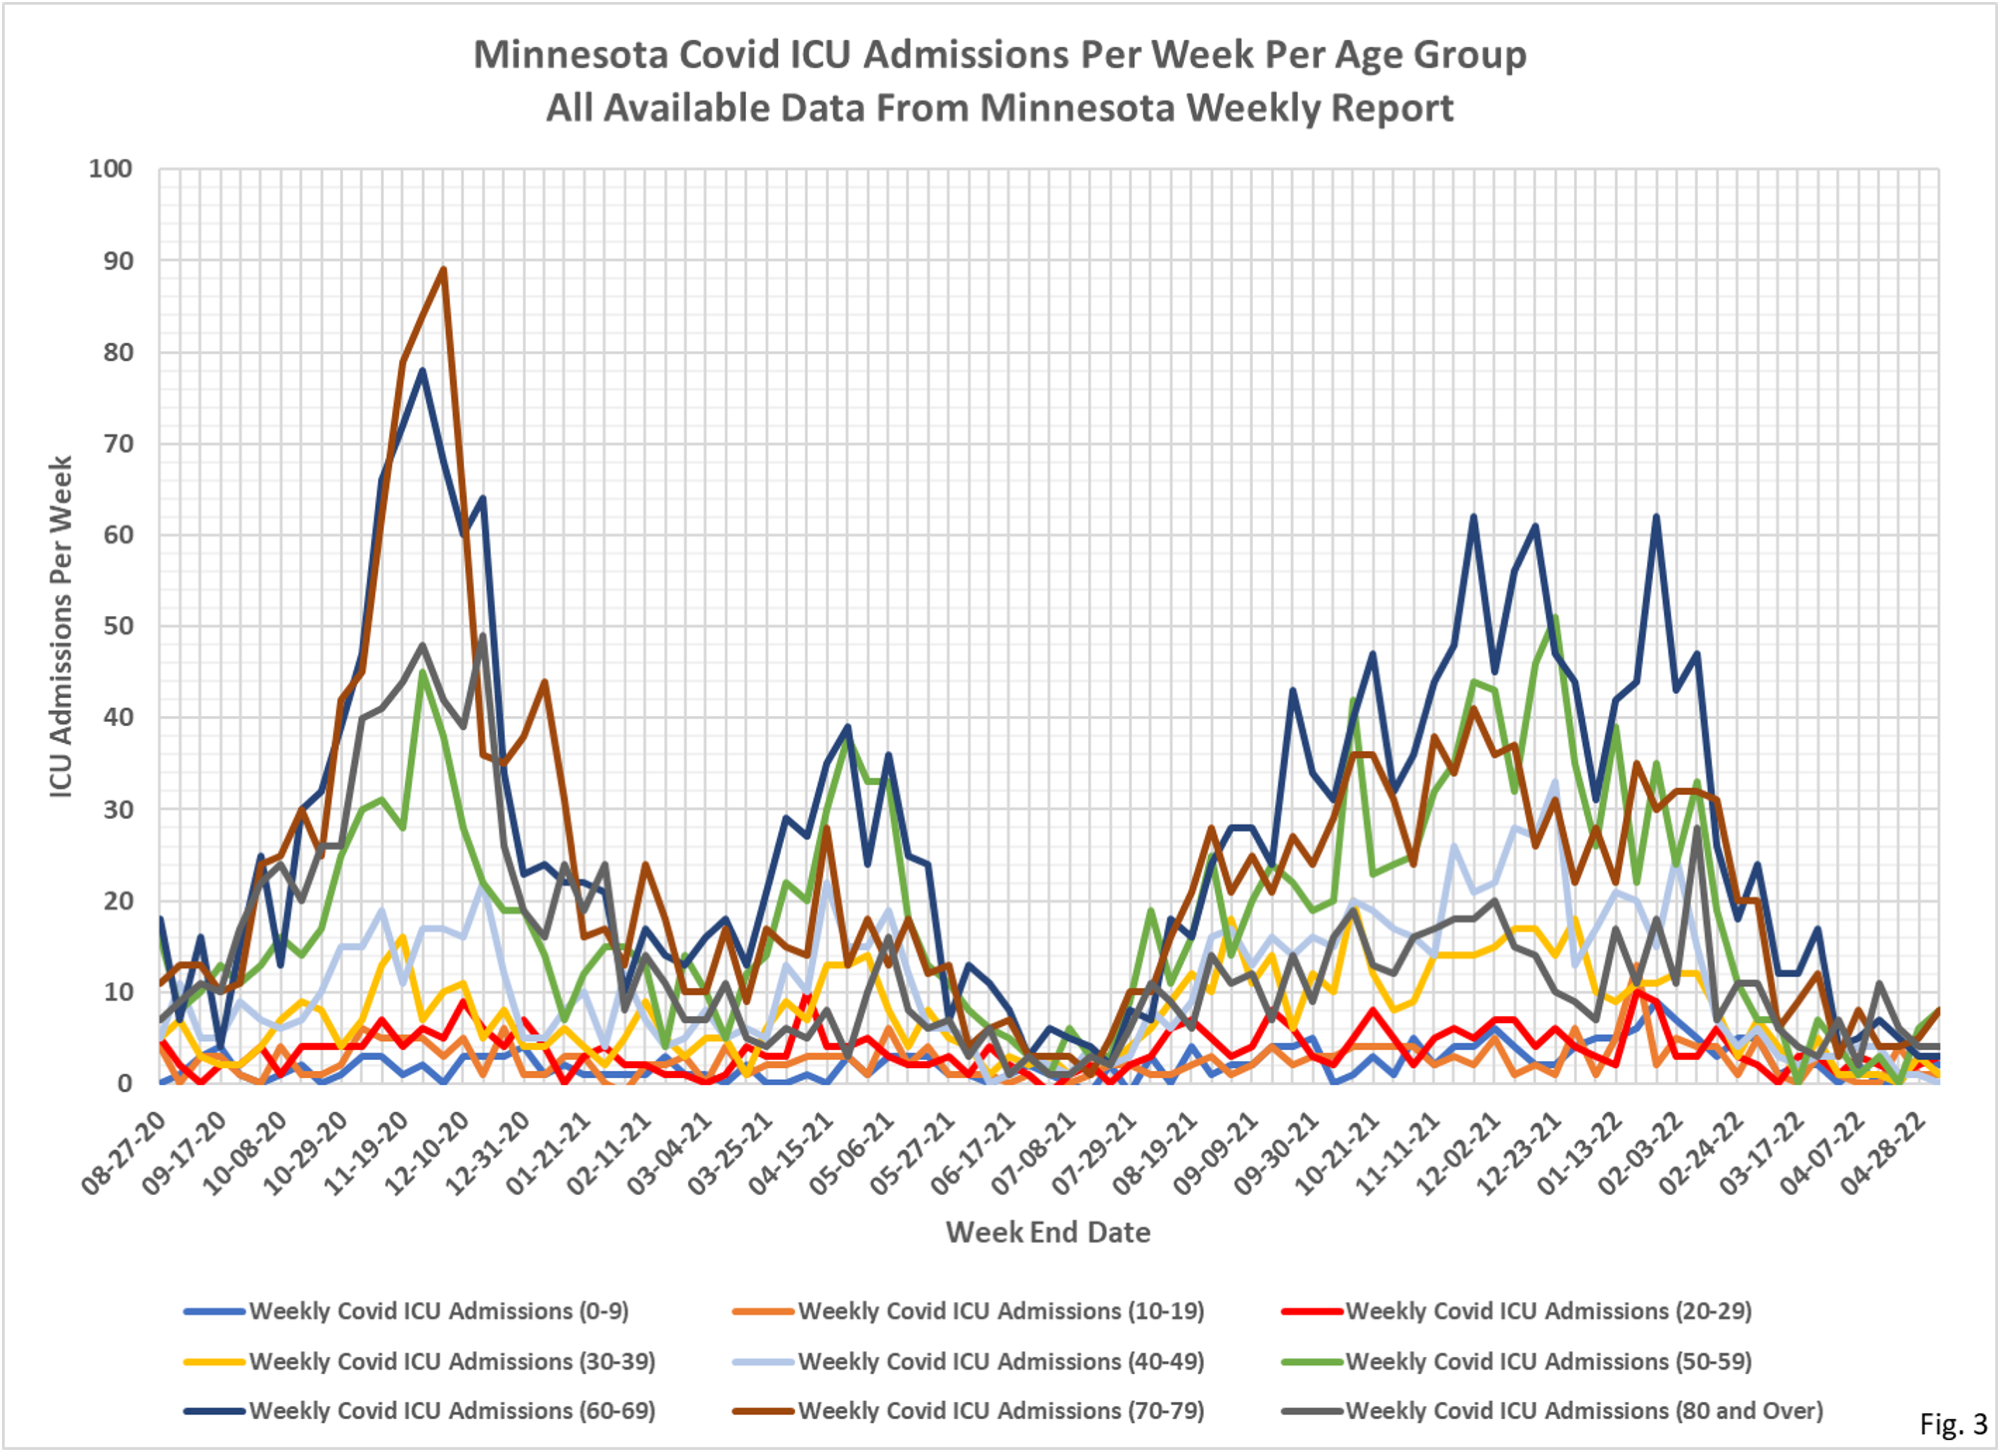
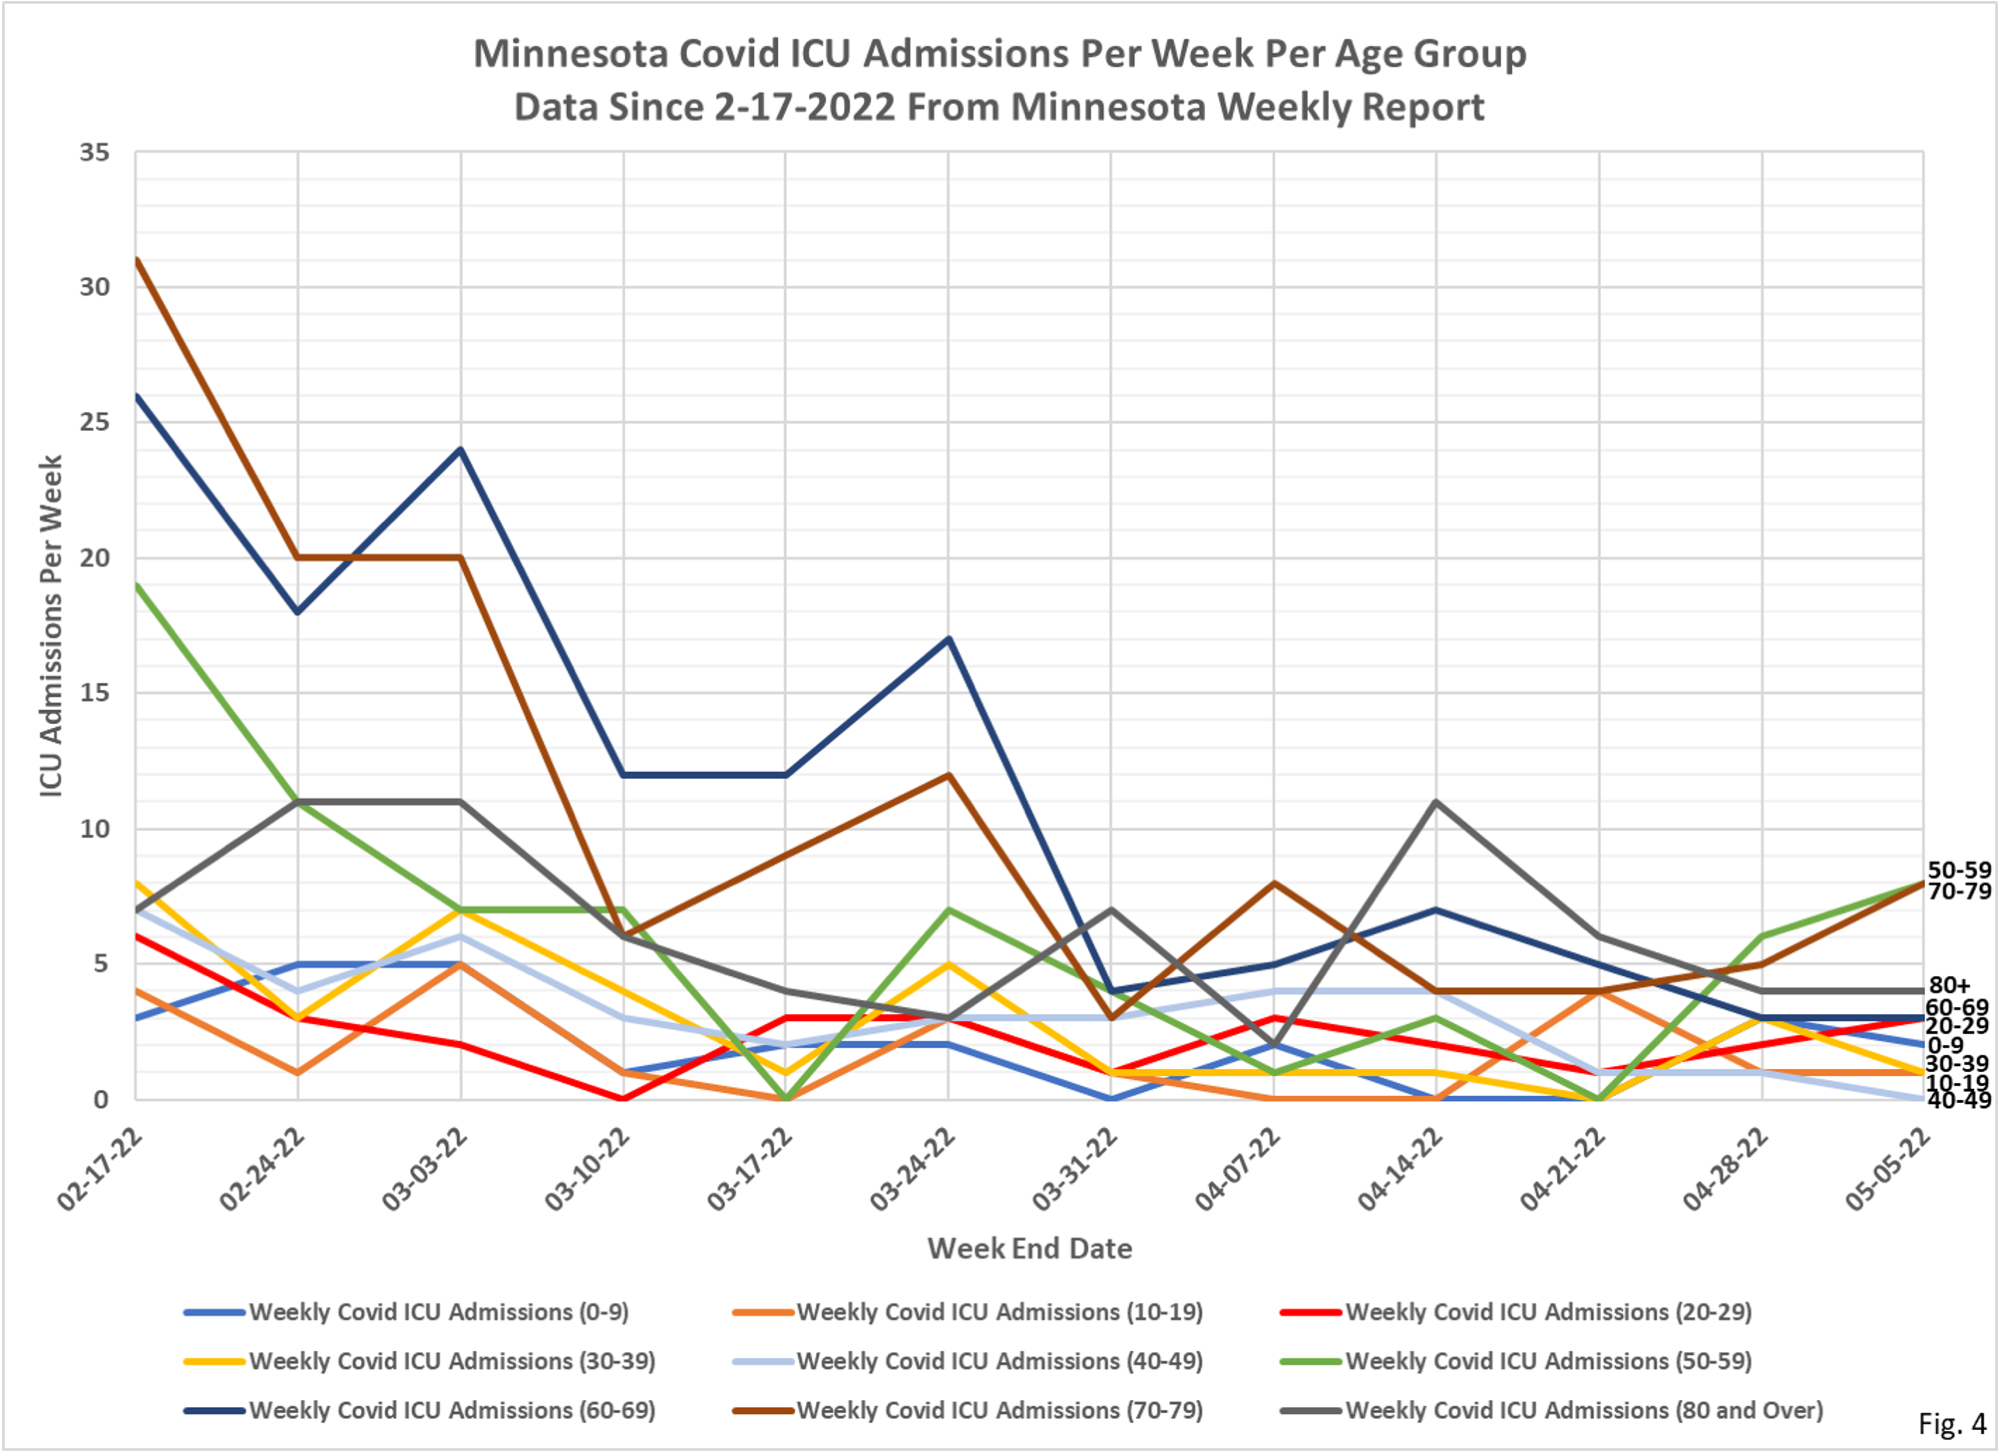
- Fig. 3 and 4: ICU Covid Admissions Per Week. Reported total ICU admissions for the week were 30, an increase of 2 from the total of 28 admissions reported last week, but within the general range of admissions reported for the past 6 weeks. The 50-59 and 70-79 age groups have had increased ICU admissions in recent, and have now separated from the other age groups.
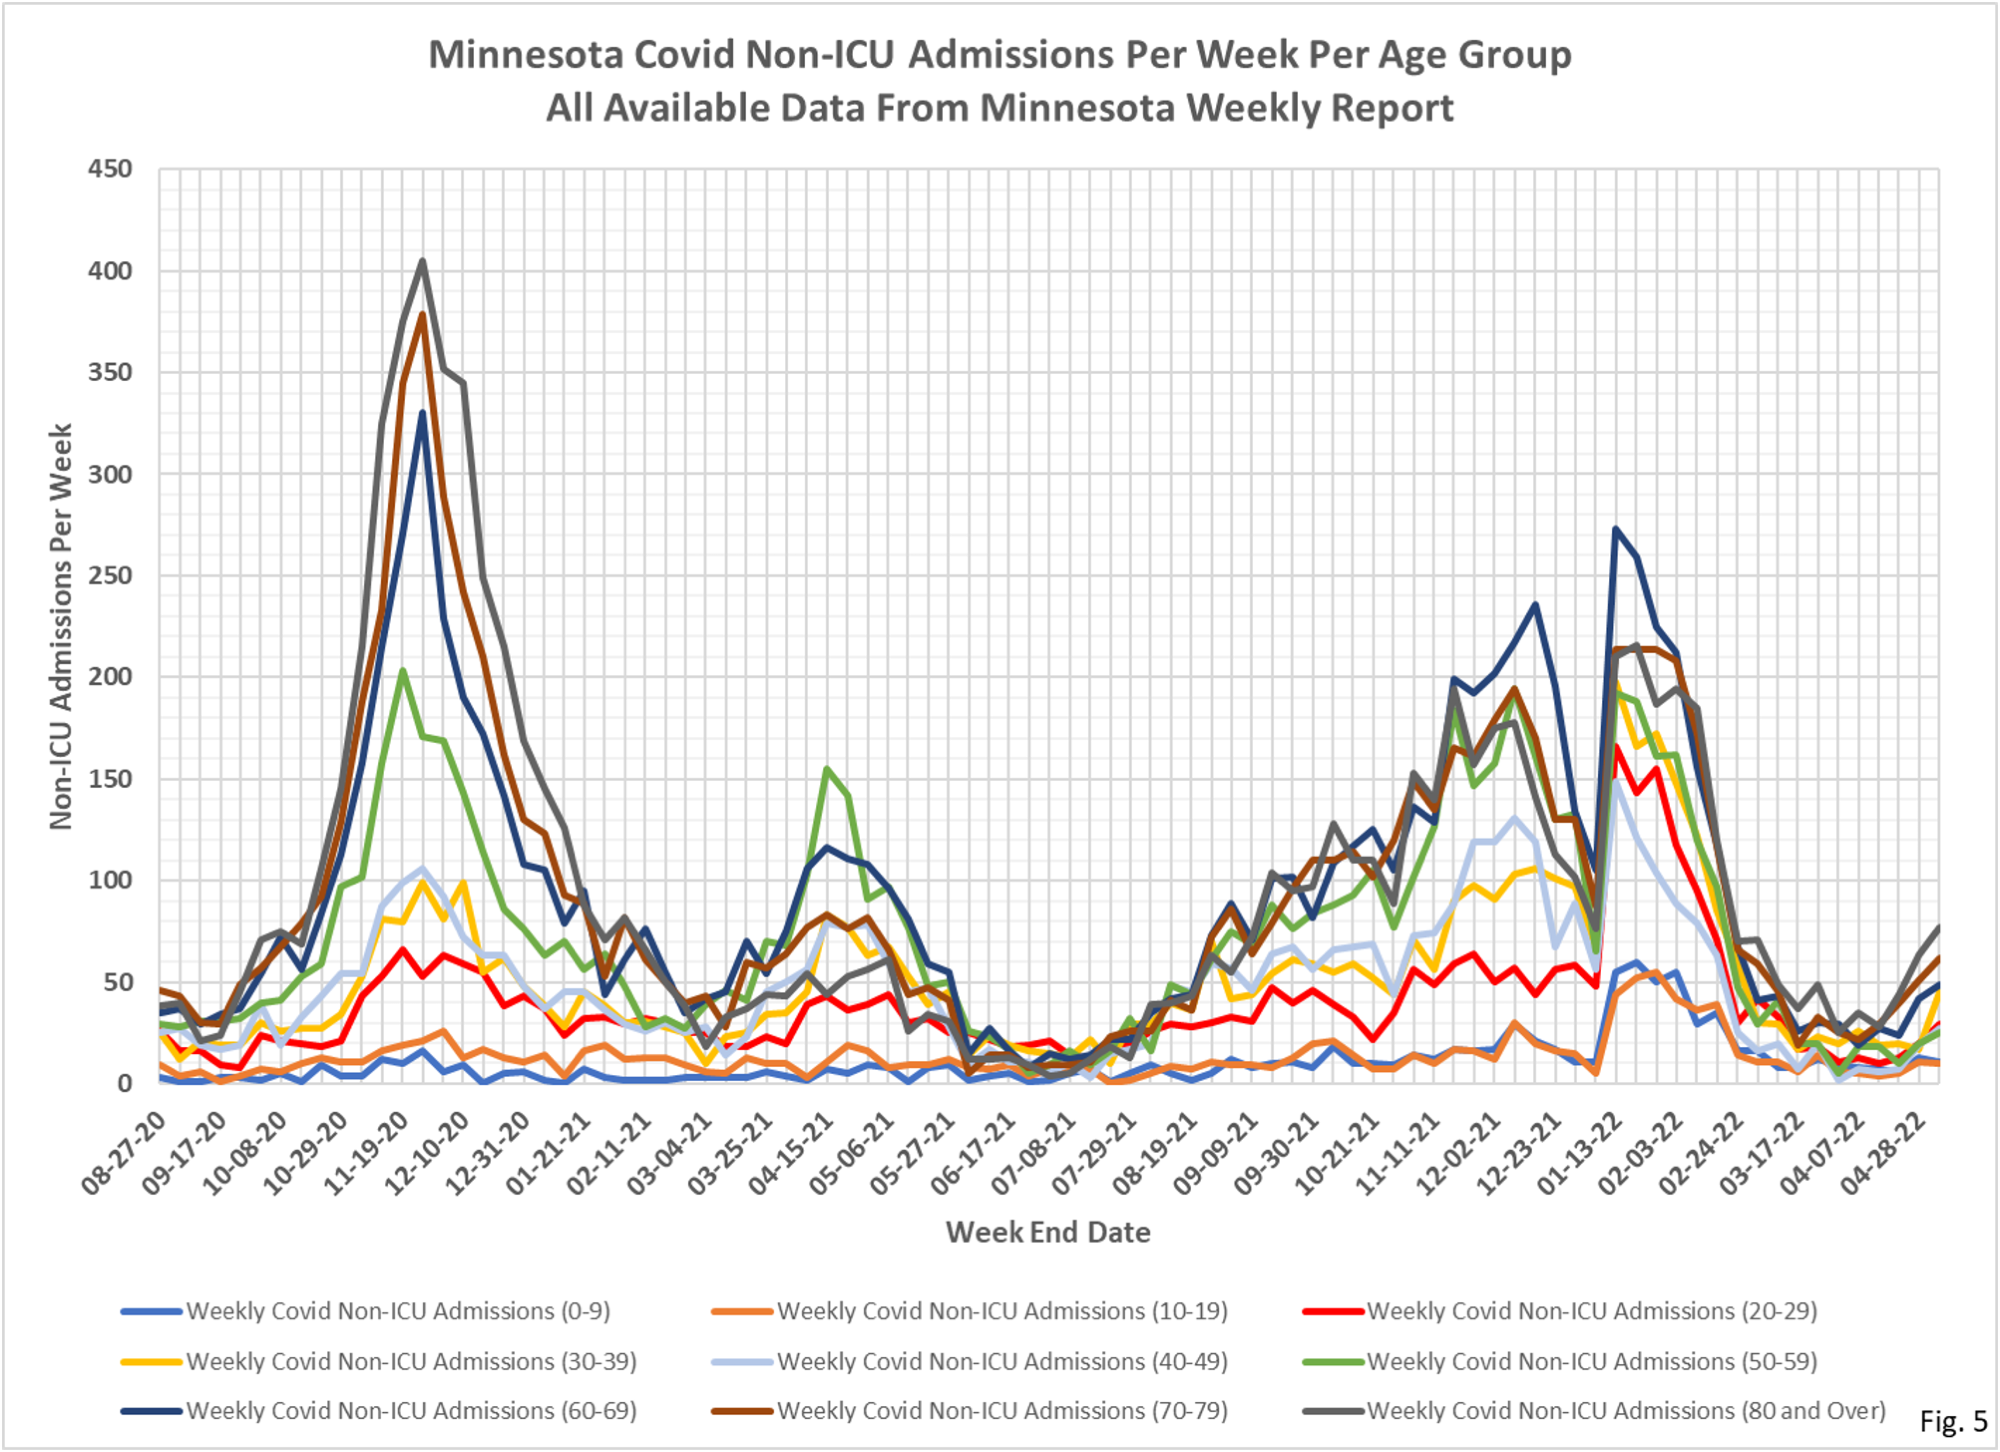
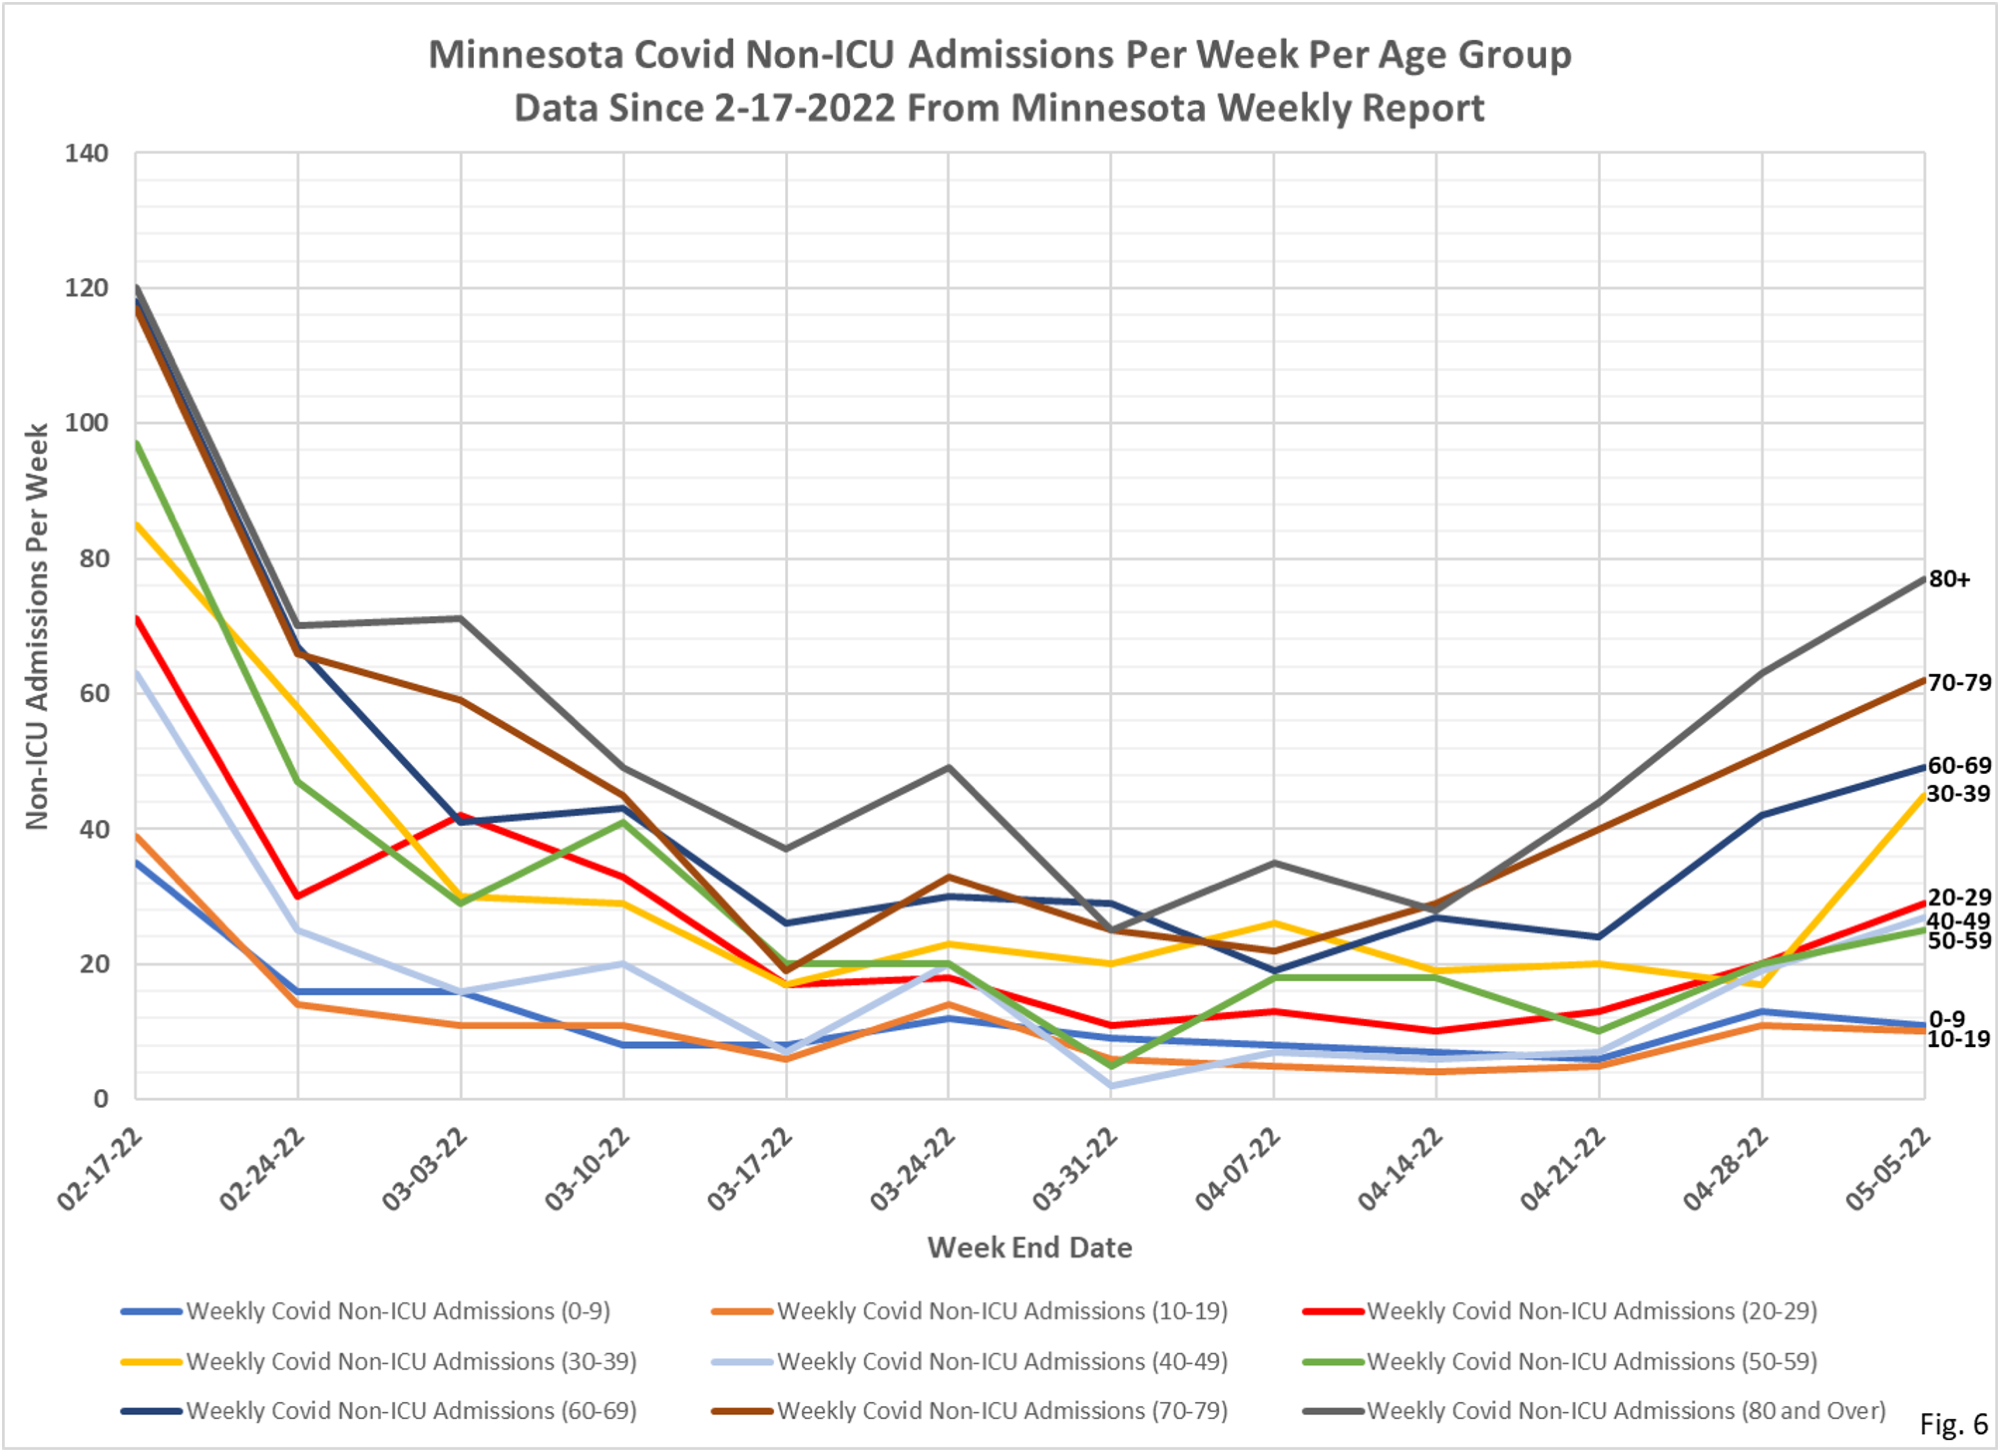
- Fig. 5 and 6: Non-ICU Covid Admissions Per Week. Reported Non-ICU Covid admissions were higher again this week in all age groups except the 0-9 and 10-19 age groups, with a total of 335 admissions reported, an increase of 79 admissions from last week’s total of 256.
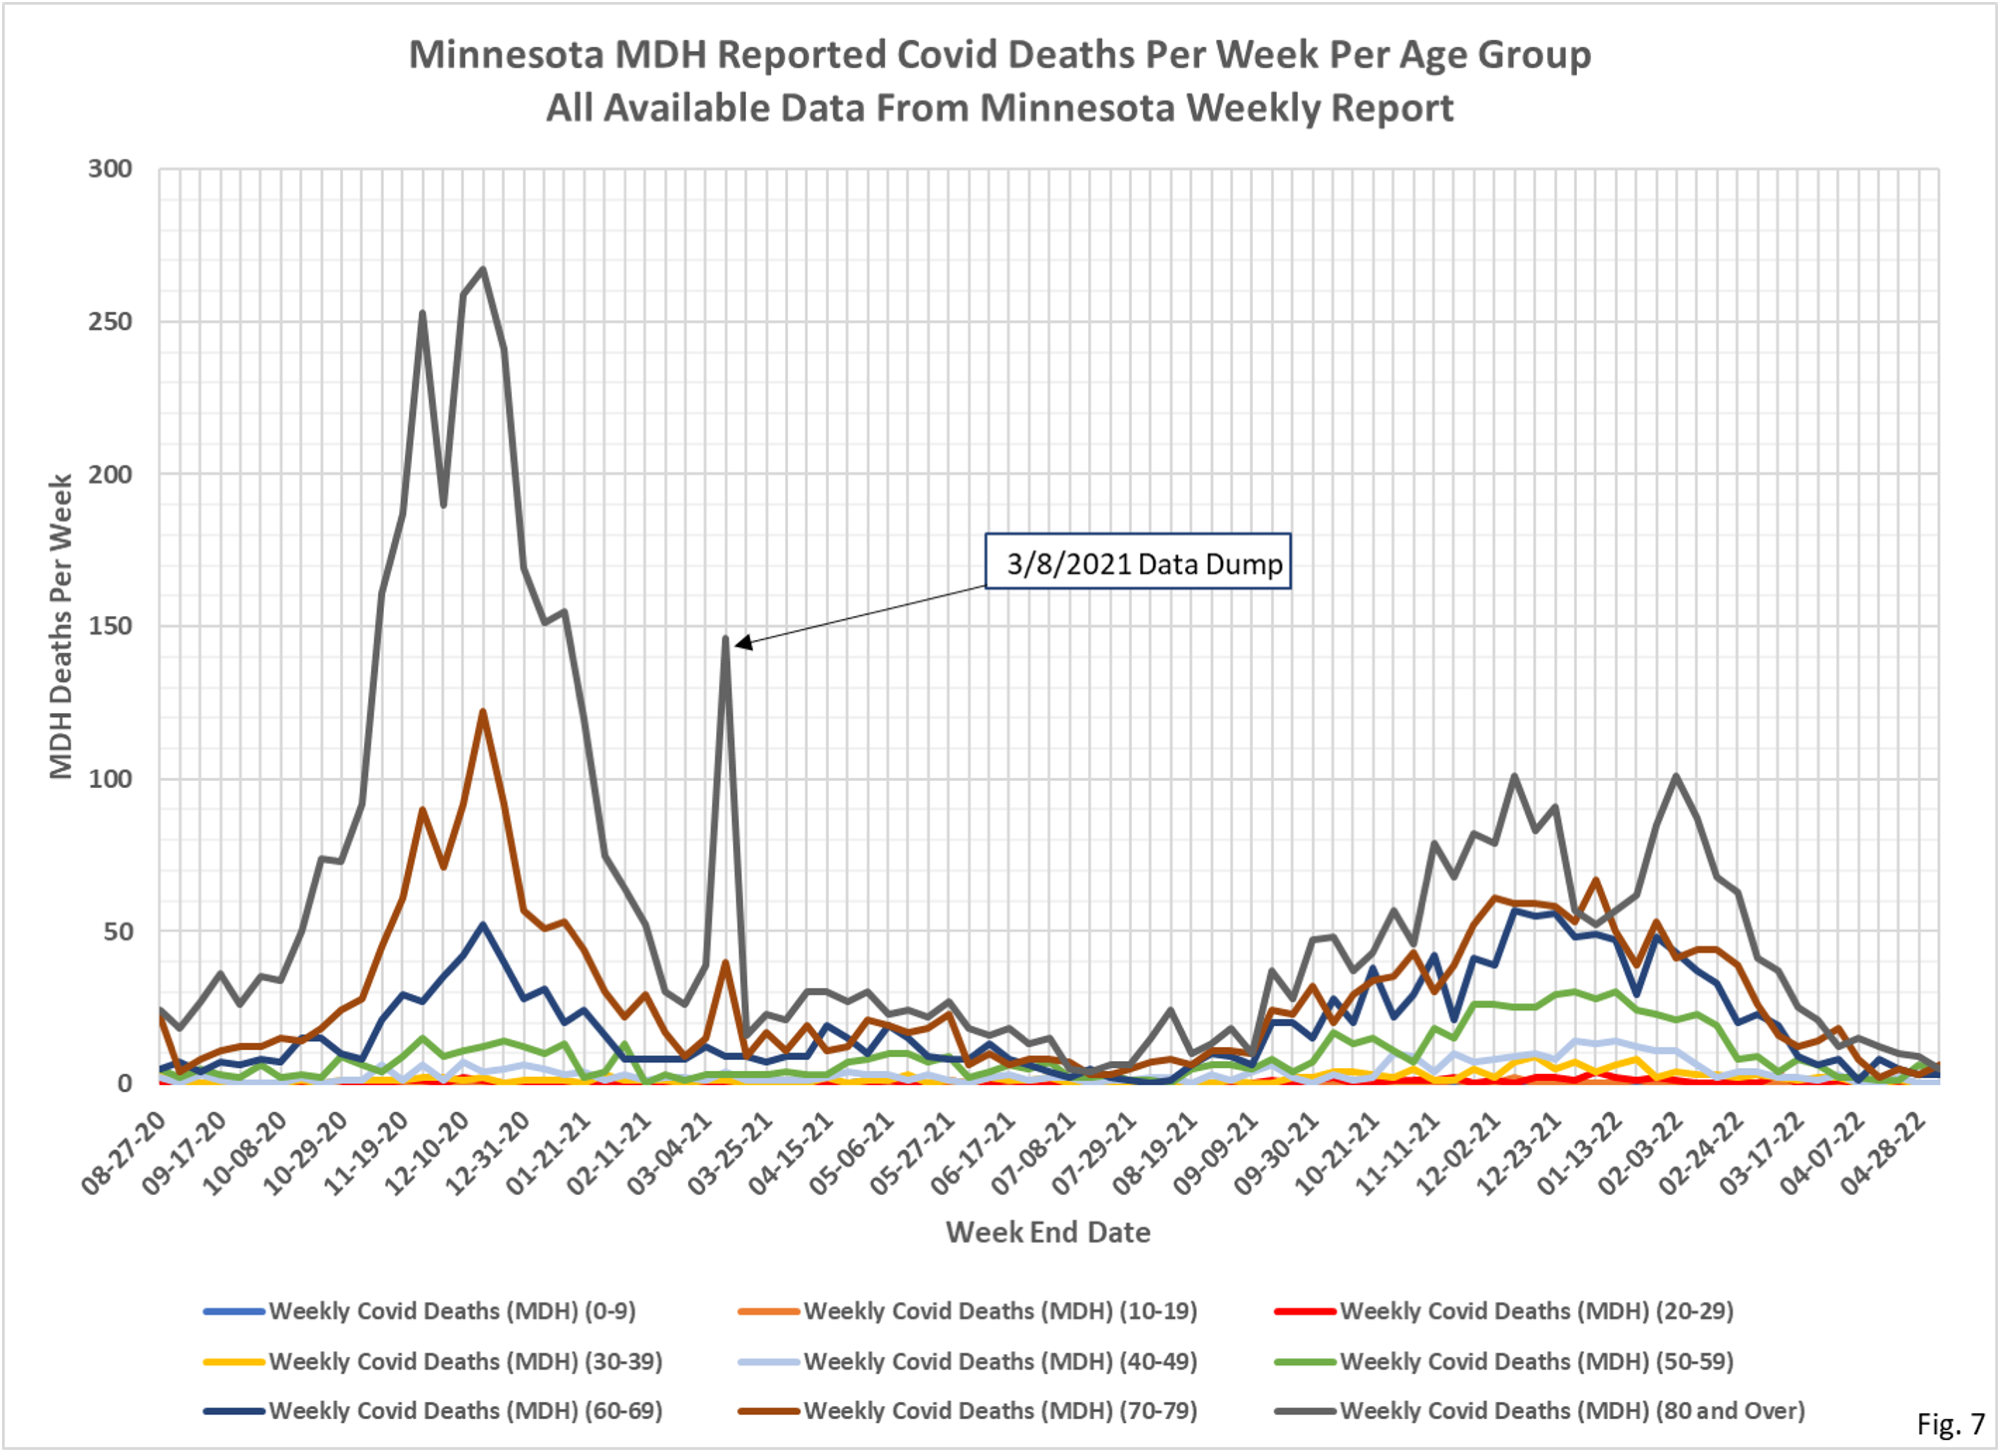
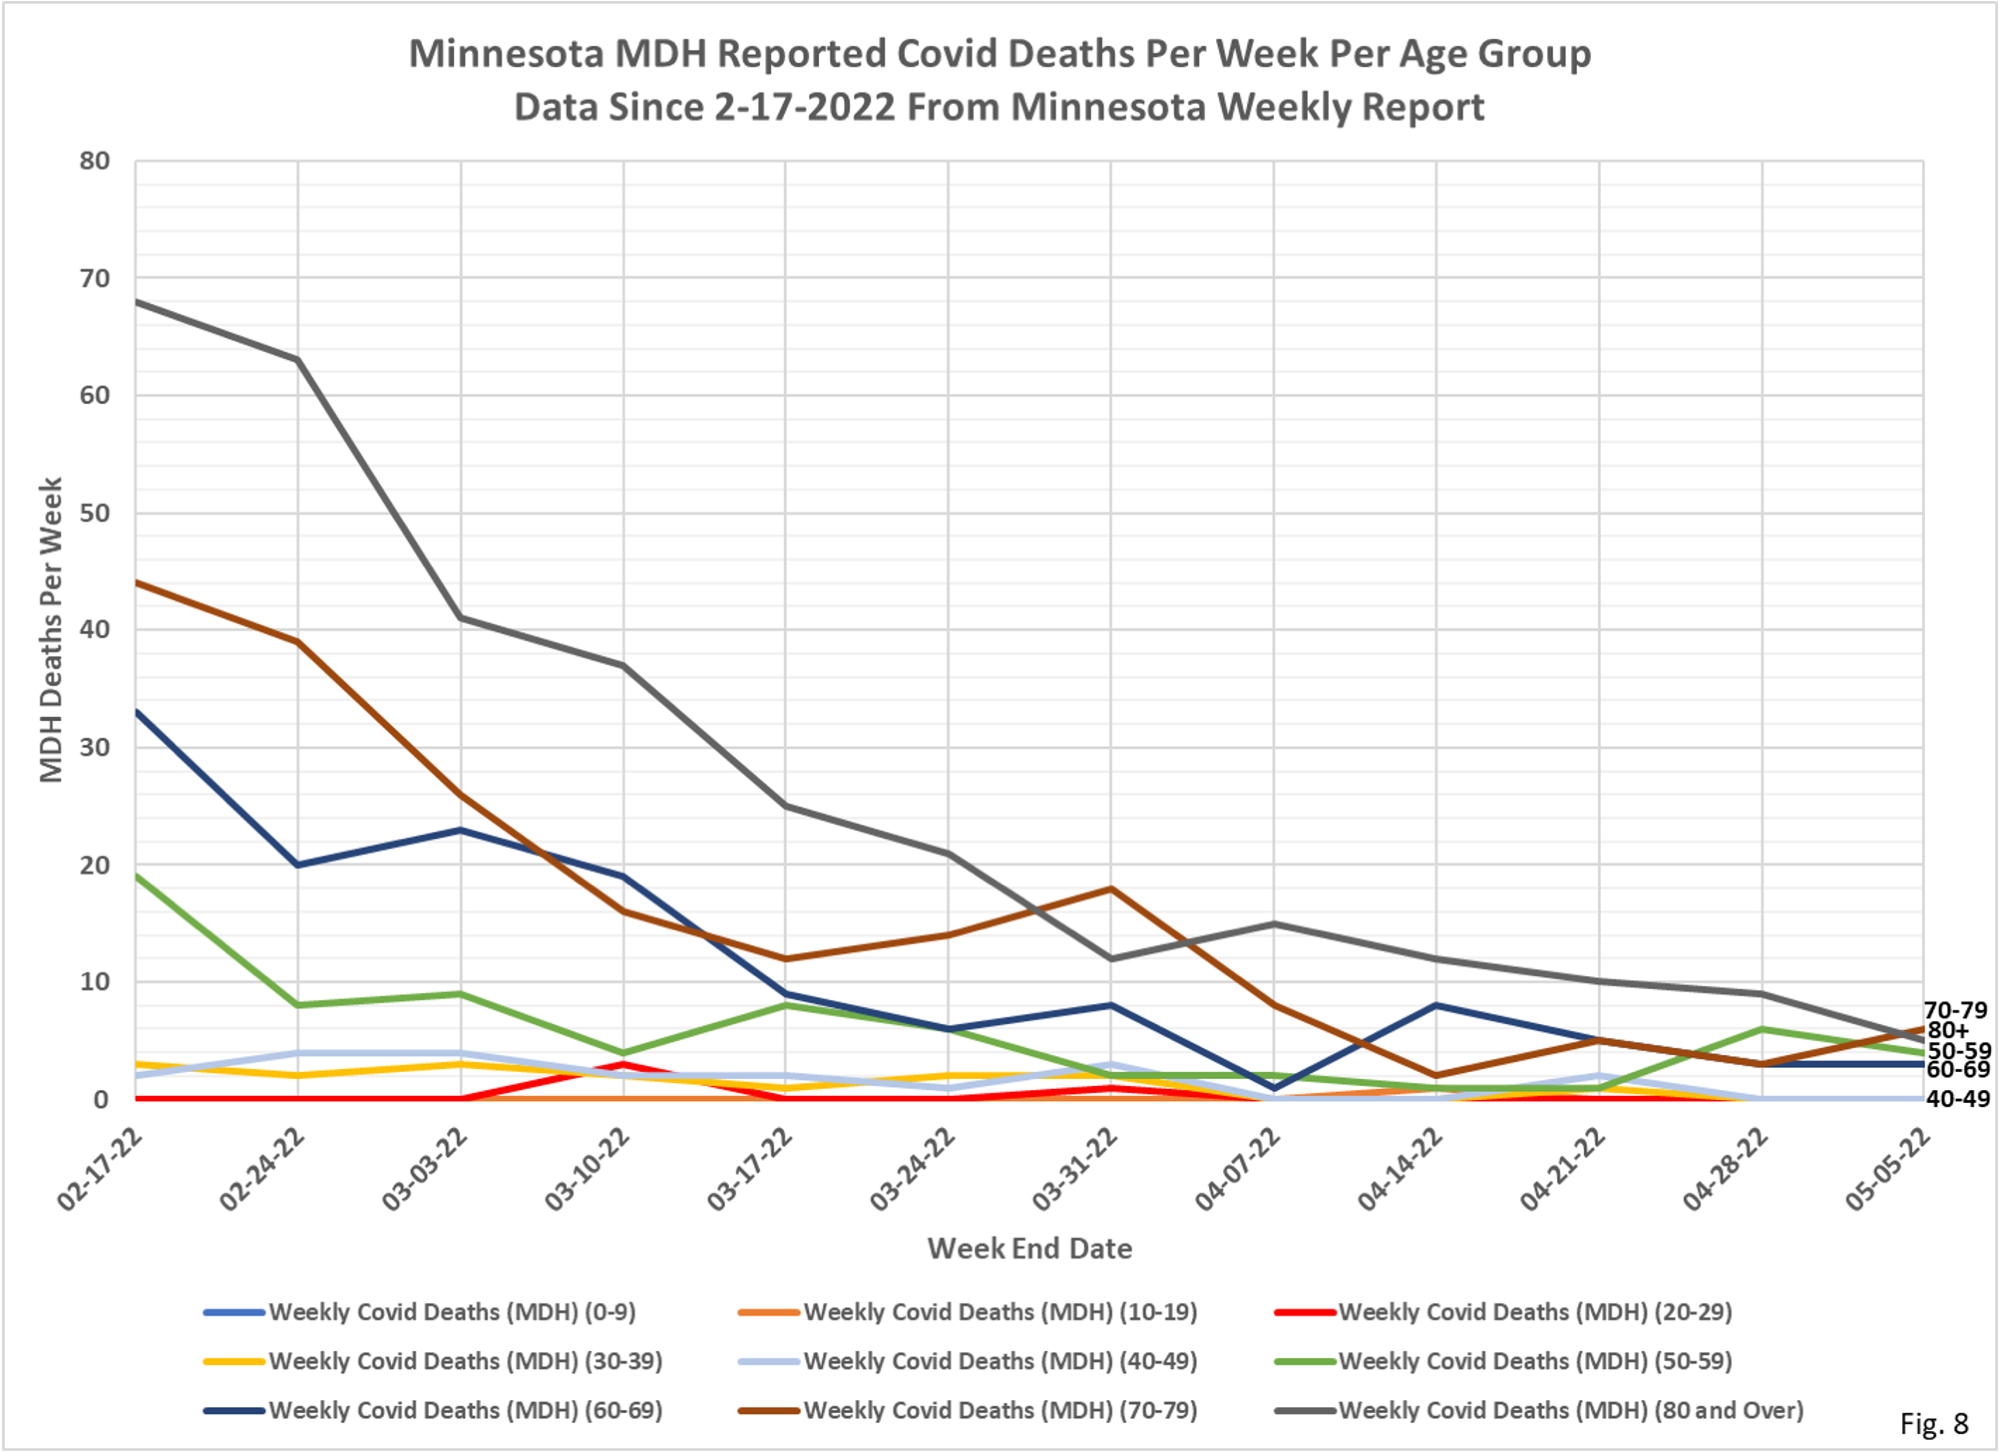
- Fig. 7 and 8: Covid Deaths Per Week. Total reported Covid deaths for the week were 18,down from 21 reported deaths last week. The 70-79 age group increased from 3 to 6 deaths, no other age group had an increase in Covid deaths..
Data Sources:
1. The data for the charts on testing, hospital admissions, and deaths comes from the Minnesota Weekly Report (available here: https://www.health.state.mn.us/diseases/coronavirus/stats/index.html). The data in the Weekly Report is presented as cumulative totals for each data type each week. I am taking weekly differences and assembling the data into charts. This data is by date of report, meaning the charts are documenting new events reported this week, even though the underlying event occurred sometime in the past. The data is provided for 5 year age groups, and I am assembling into 10 year age groups to make the charts more readable.
2. The data for the Covid cases per week come from a data file published along with the Minnesota Weekly Report, here: https://www.health.state.mn.us/diseases/coronavirus/stats/index.html#wagscd1 This data is published by date of specimen collection, rather than by date of report as the other data is. The data is provided as cases per week in 5 year age groups. I am compiling the data into 10 year age groups in order for the charts to be more readable. This data is updated by date of specimen collection, so it is possible that past week’s data will be updated.

interesting study on effectiveness of vaccines based on obesity of the individual
Kevin – thoughts
https://www.upi.com/Health_News/2022/05/06/Turkey-obesity-COVID-19-vaccine/5081651845725/