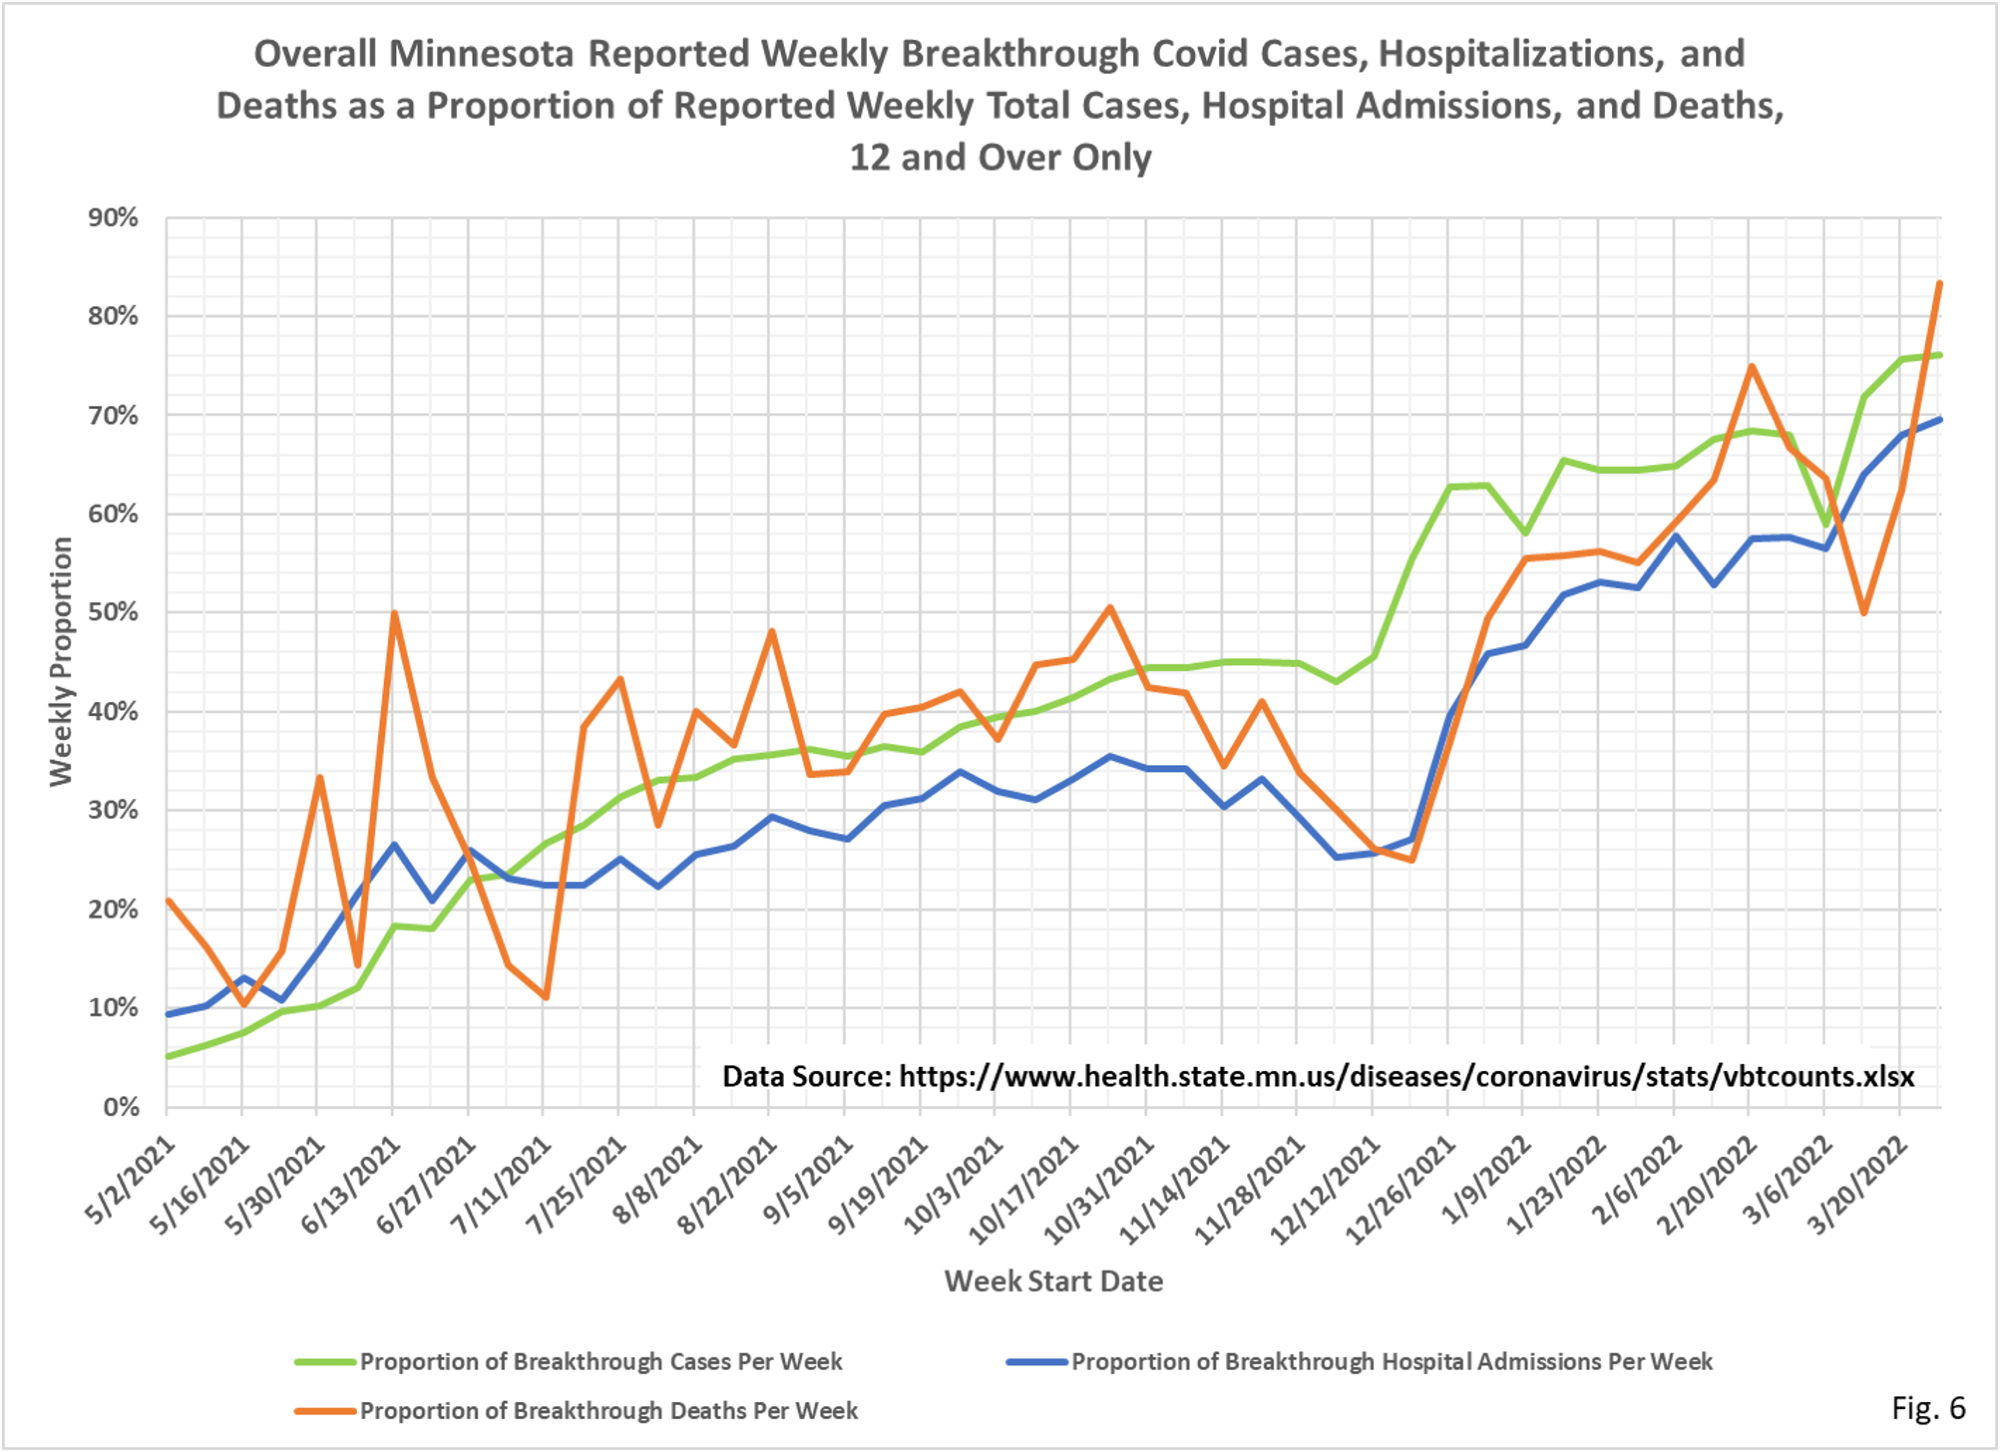
We have reached a truly astounding level of vaccine ineffectiveness, particularly against infection. And I absolutely guarantee you that these tables and charts wildly understate the current number of and proportion of breakthrough events, particularly cases. They are also lagged a month, so the current situation is likely even worse. In my family, and in every incident I hear about, everyone infected over the age of 12 and in one case a 6 year old, were vaxed. There is a massive number of breakthru cases being identified by home testing and never showing up in the stats. You may recall in the winter of 2020 the Governor and DOH told us the vax would end the epidemic. You may recall last fall the Governor said that all the serious illness was in the unvaxed. He was incredibly reckless in the first statement and just his usual lying self in the second. When do we get our apology. You know the answer. I sincerely hope none of you vote for that clown and do everything you can to persuade others to reject his lying, cretinous brand of politics.
 Dave’s notes:
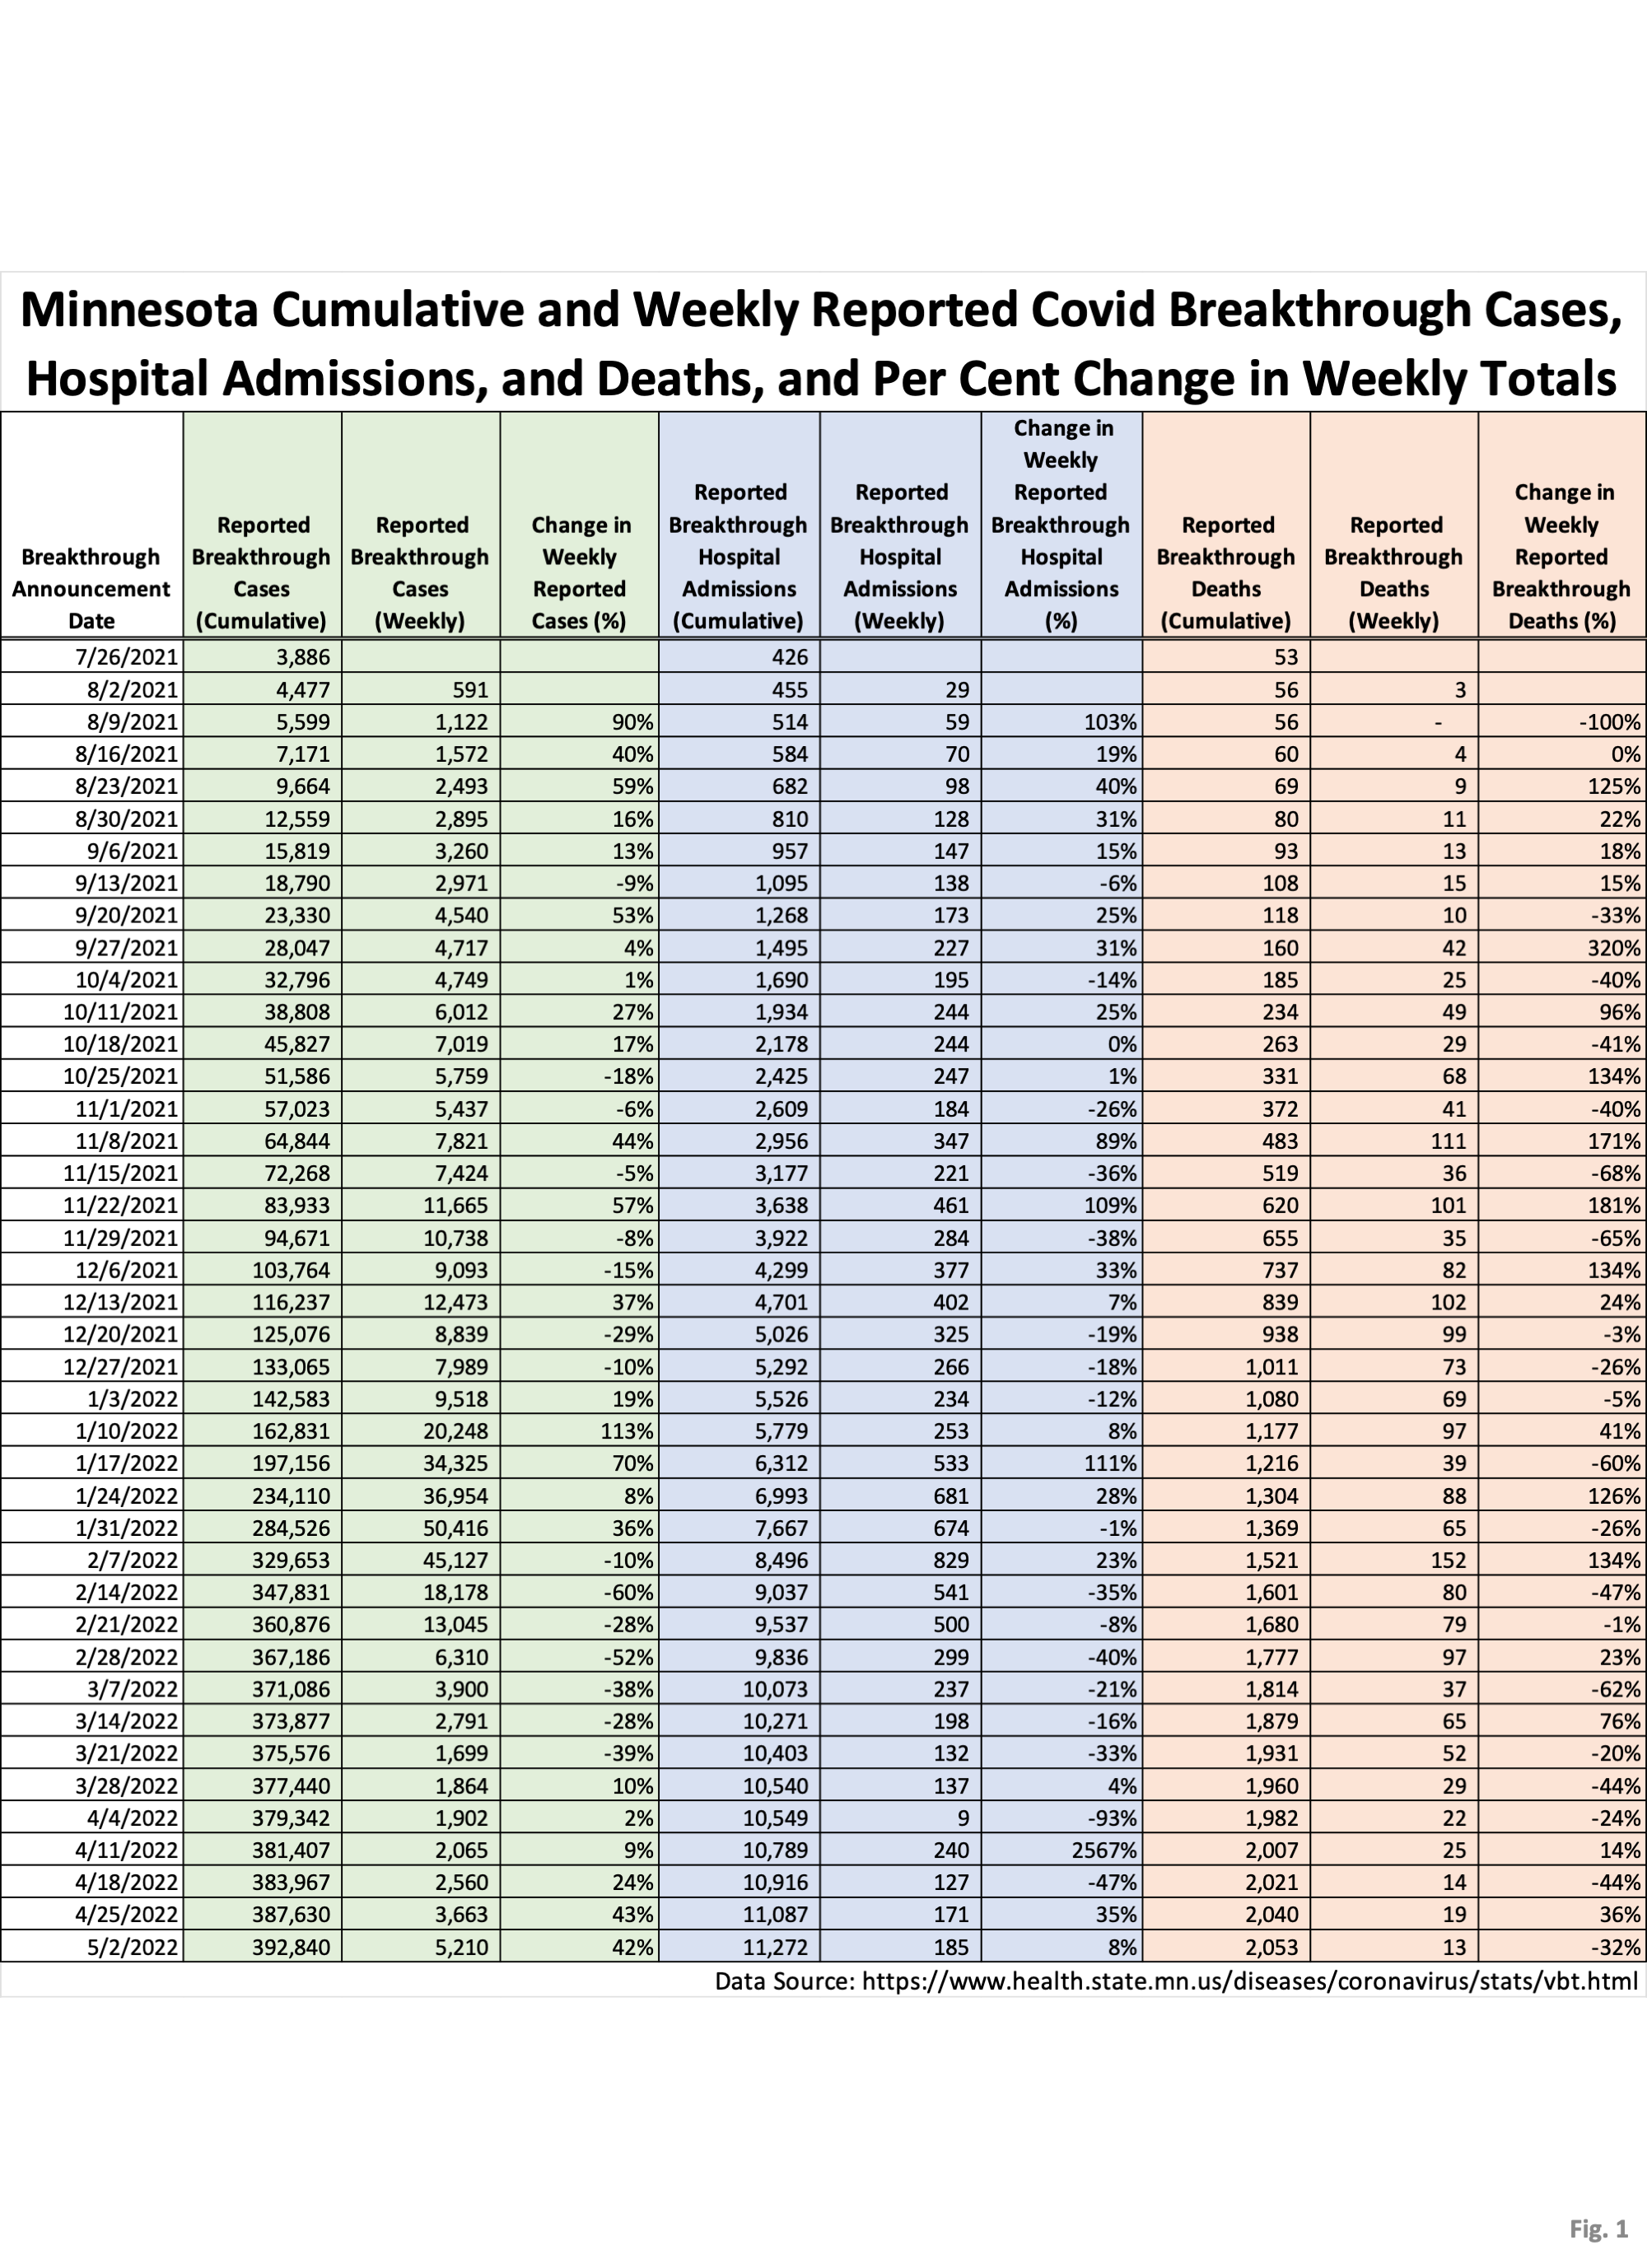
- Fig. 1: This table is the weekly announced cumulative breakthrough cases, hospital admissions, and deaths, as well as the weekly totals, and change in weekly totals, as published on the Vaccine Breakthrough Update web page https://www.health.state.mn.us/diseases/coronavirus/stats/vbt.html. New breakthrough cases announced on 5/02/2022 total 5,210 cases, up from 3,663 new breakthrough cases last week. Newly reported breakthrough cases have now been increasing for 6 weeks in a row. Newly reported breakthrough hospital admissions total 185 for the week, and remain highly variable. New breakthrough deaths totaled 13, compared to 19 reported breakthrough deaths last week.
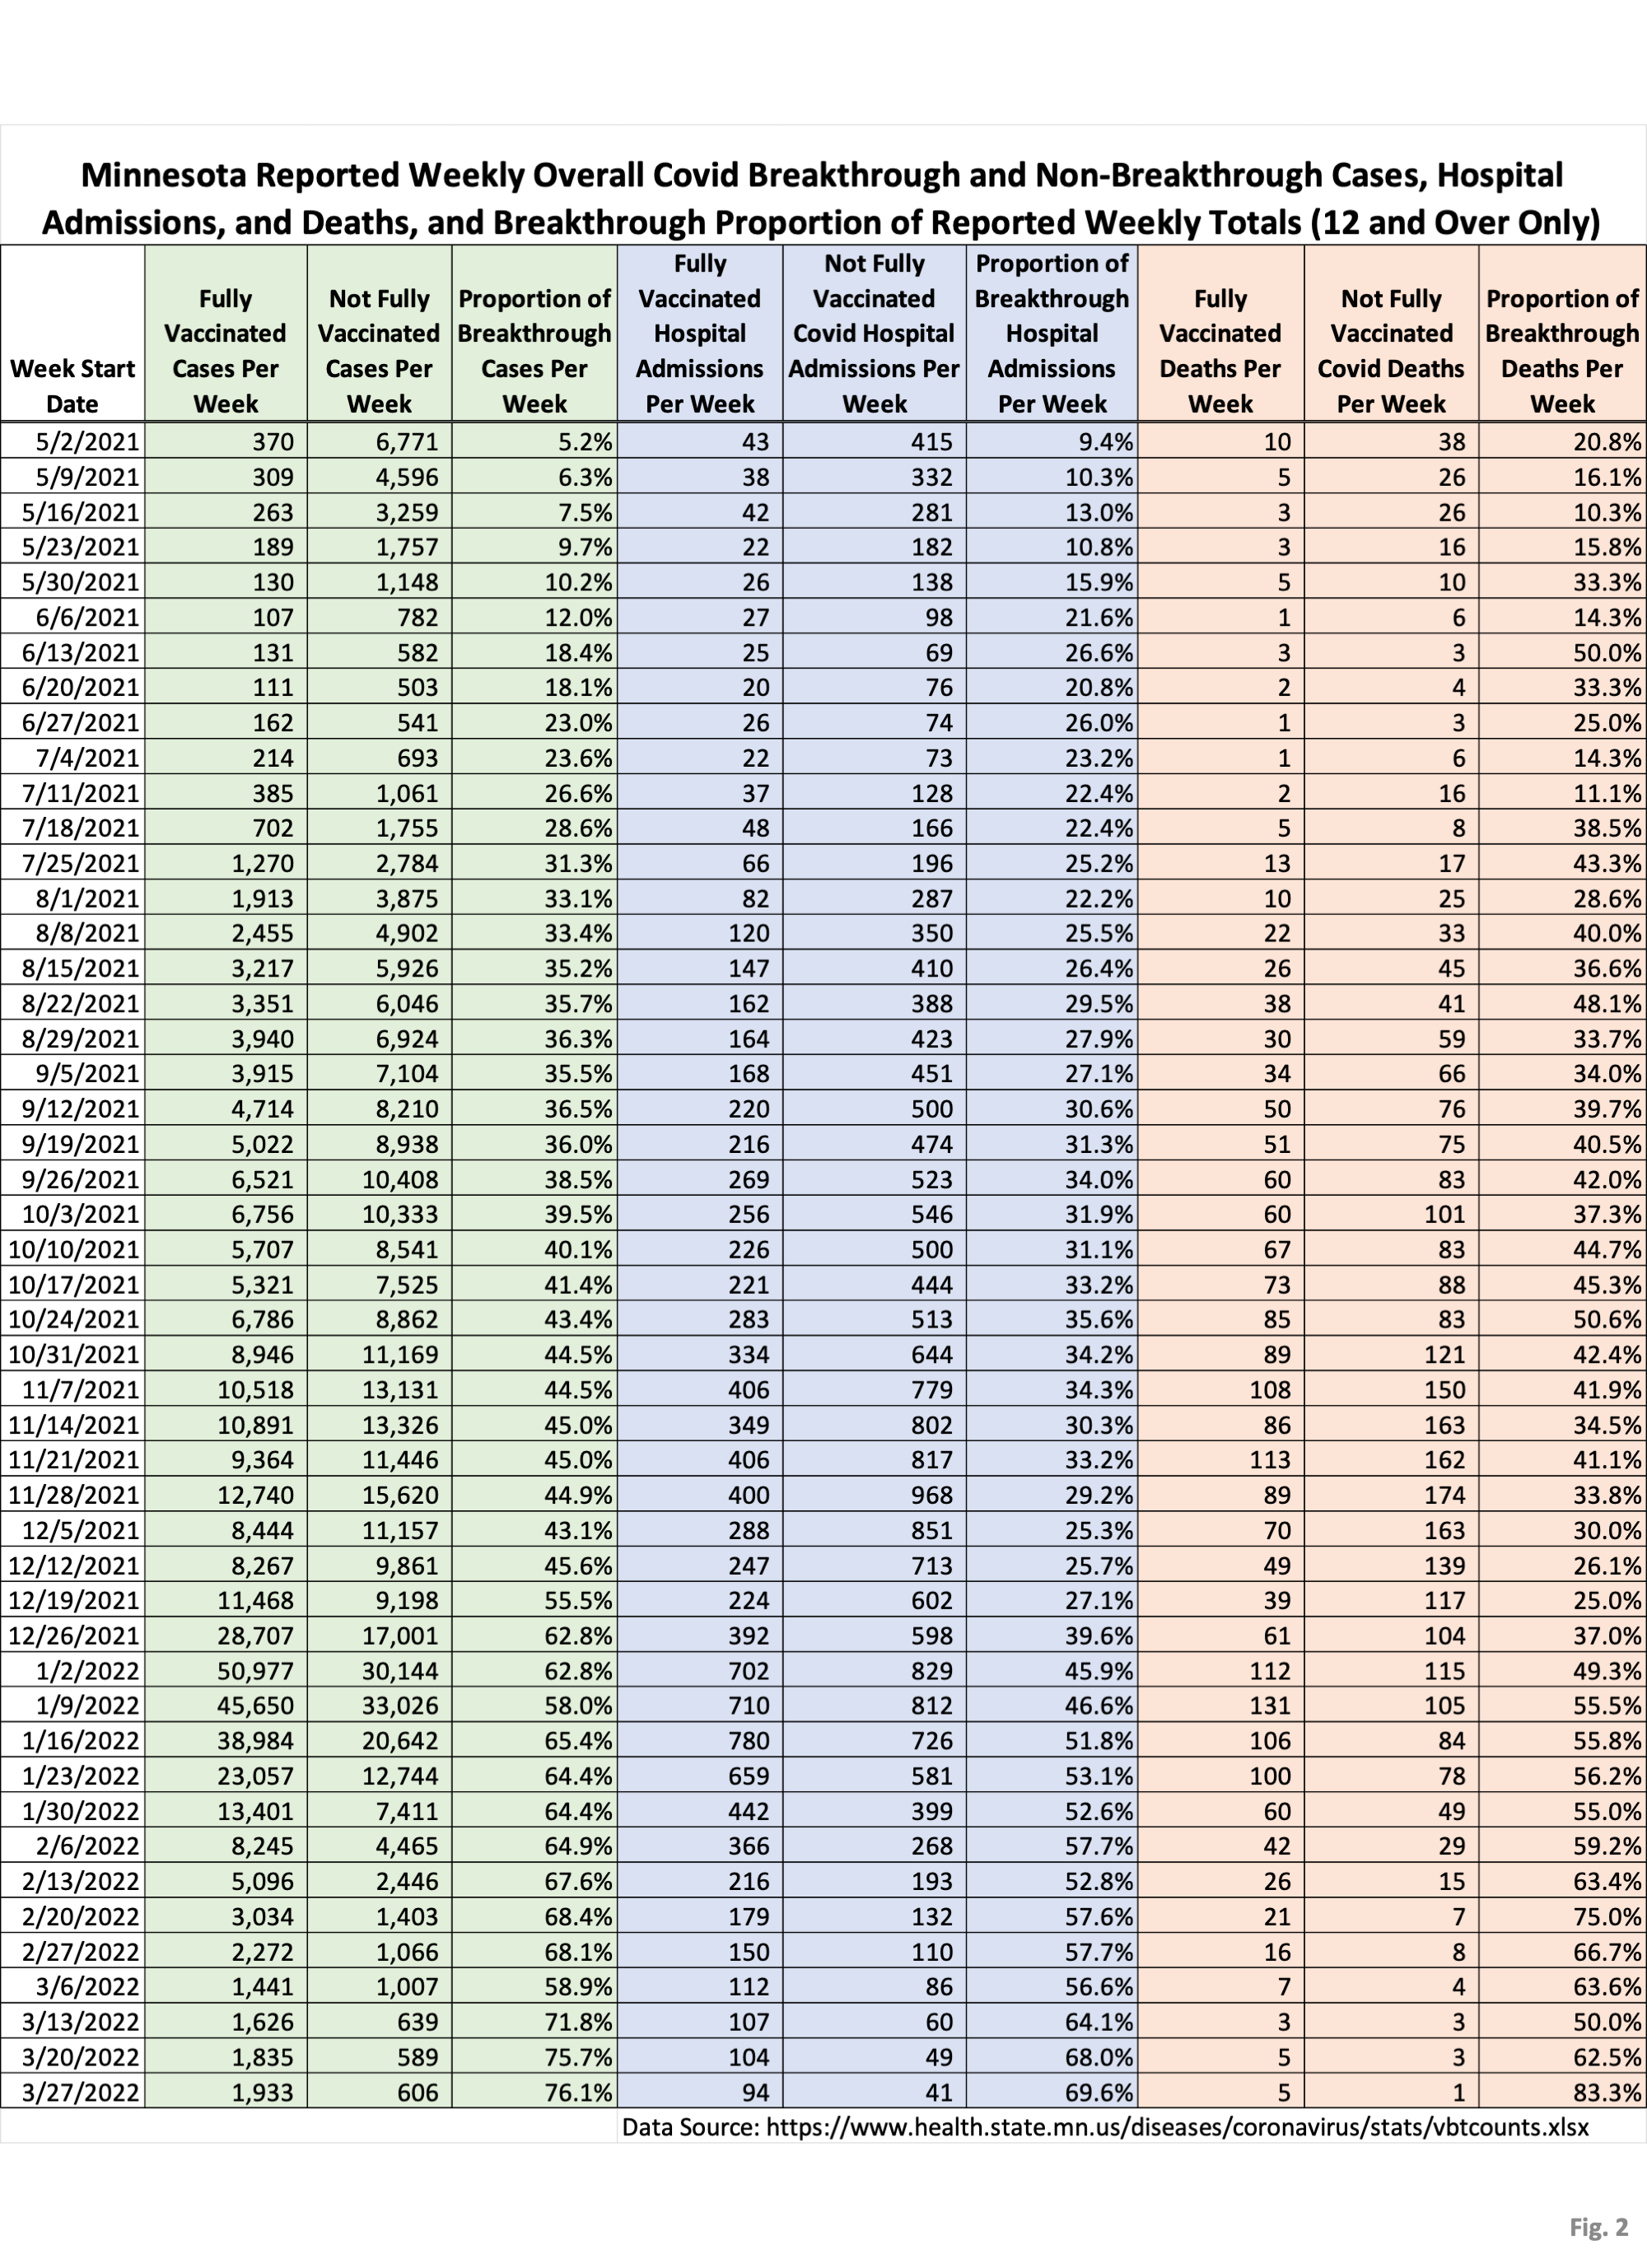
- Fig. 2: This table displays the total cases, hospital admissions, and deaths that occurred each week among the vaccinated and unvaccinated populations, with the latest week of 3/27/2022 added to the report. These numbers are taken from the vbtcounts.xlsx data file published by MDH on the Vaccine Breakthrough Update web page. We noted last week that we had found a discrepancy between the values listed in vbtcounts.xlsx and the breakthrough cases contained in a data file we received in response to a Government Data Practices Act submittal. After further investigation it is now apparent the data file vbtcounts.xlsx contains only those cases for those 12 years of age and above. With this correction made in the analysis the MSH data files are now reconciled.
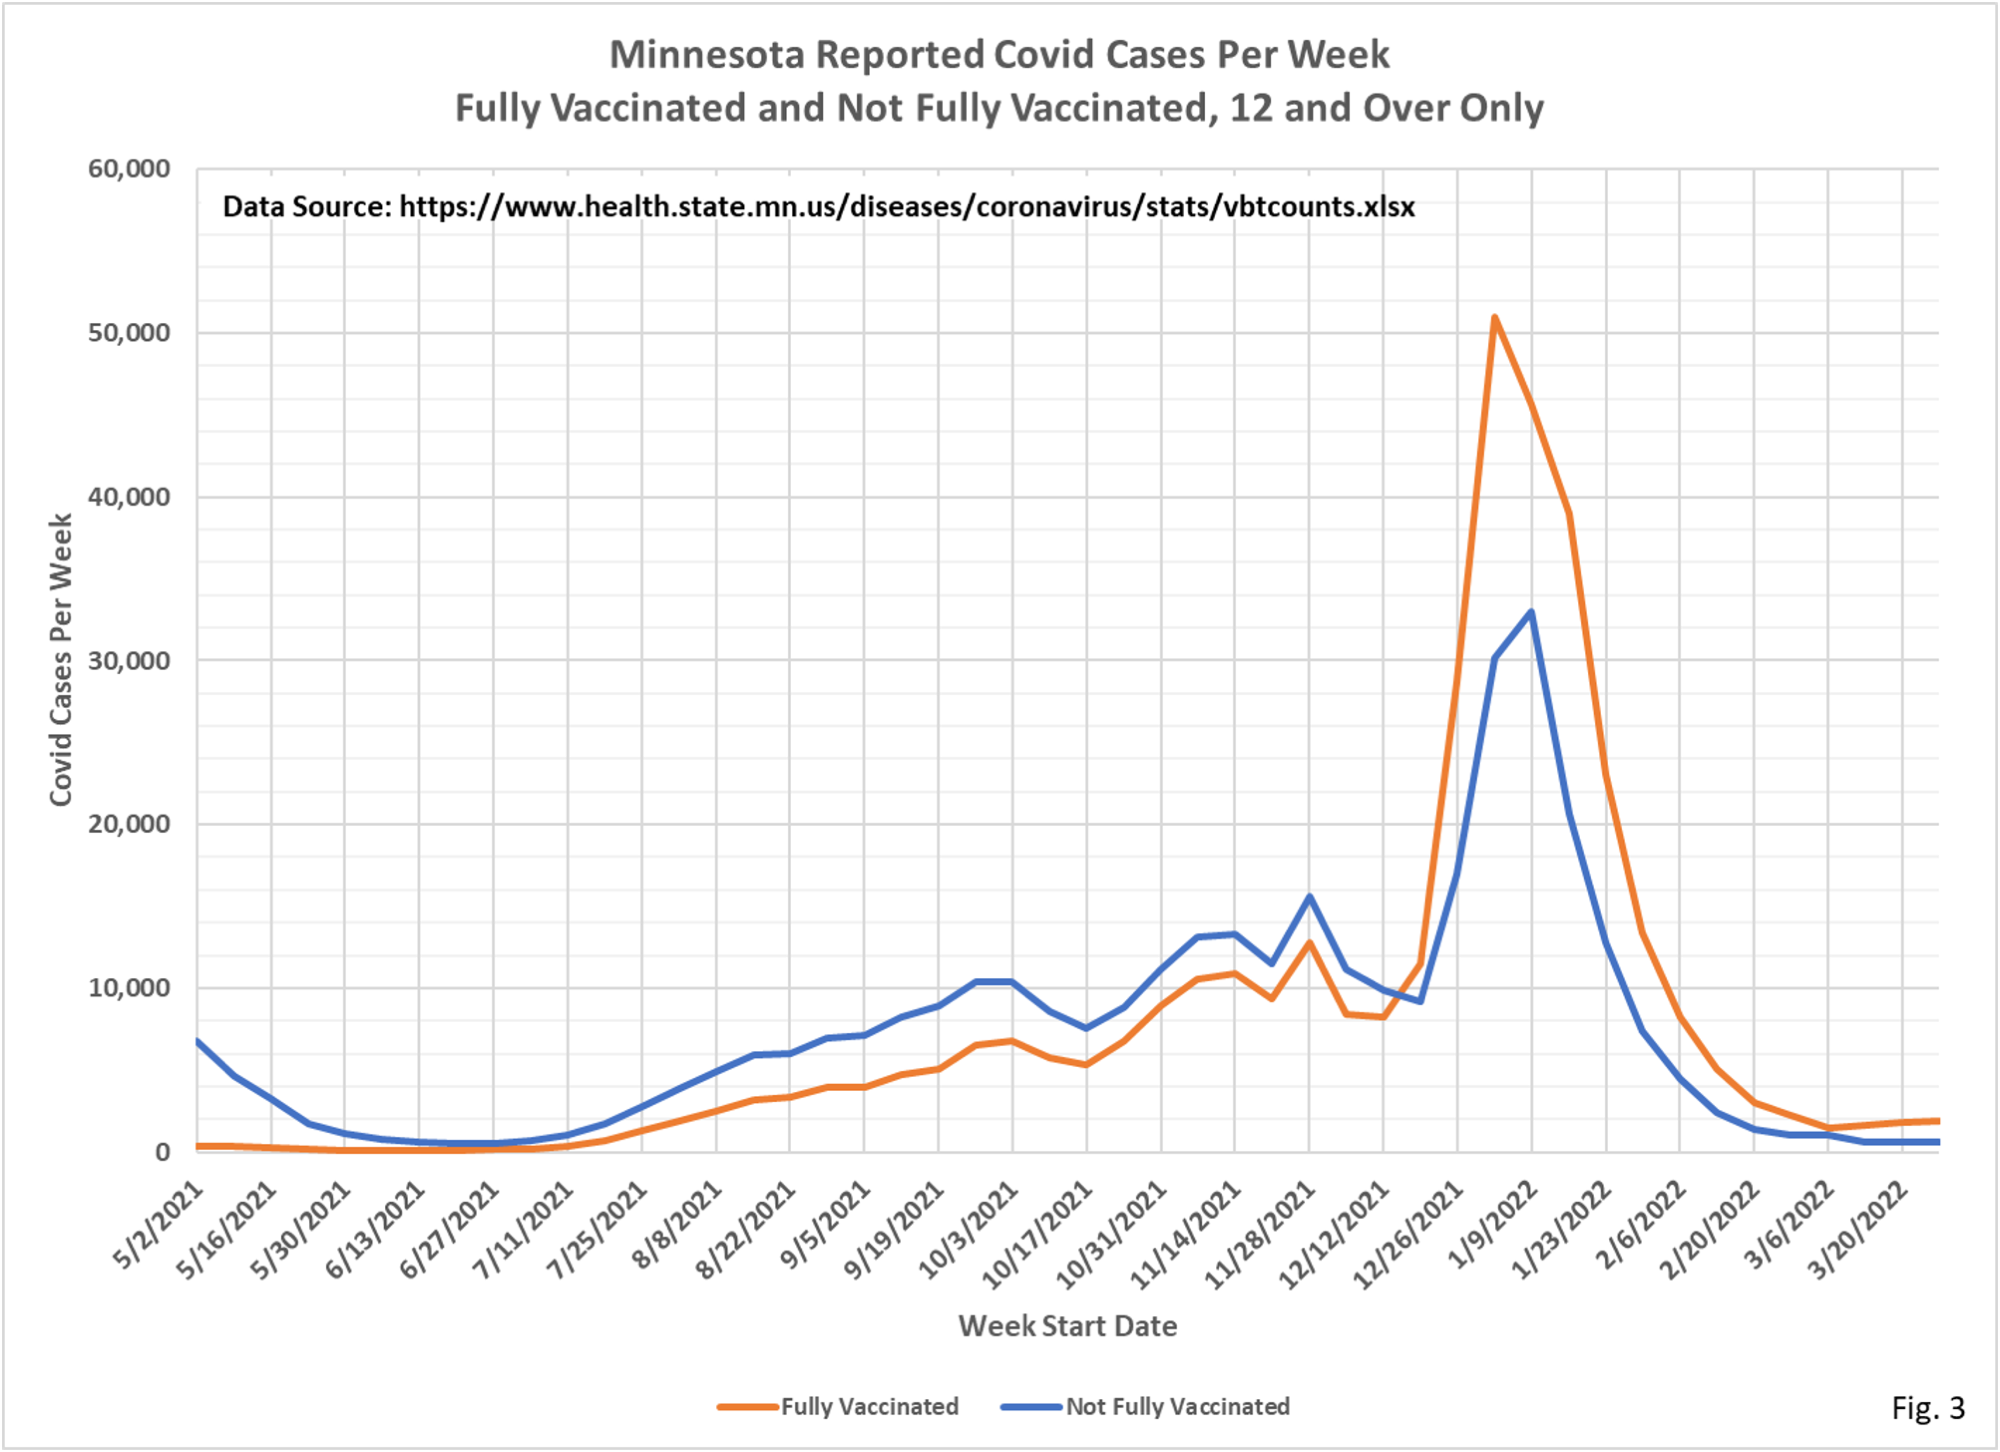
- Fig. 3: This chart simply plots the cases among the vaccinated and unvaccinated populations each week, as found in Fig. 2. Cases among the fully vaccinated continued to increase gradually for the week of 3/27/2022, while cases among the unvaccinated are essentially flat.
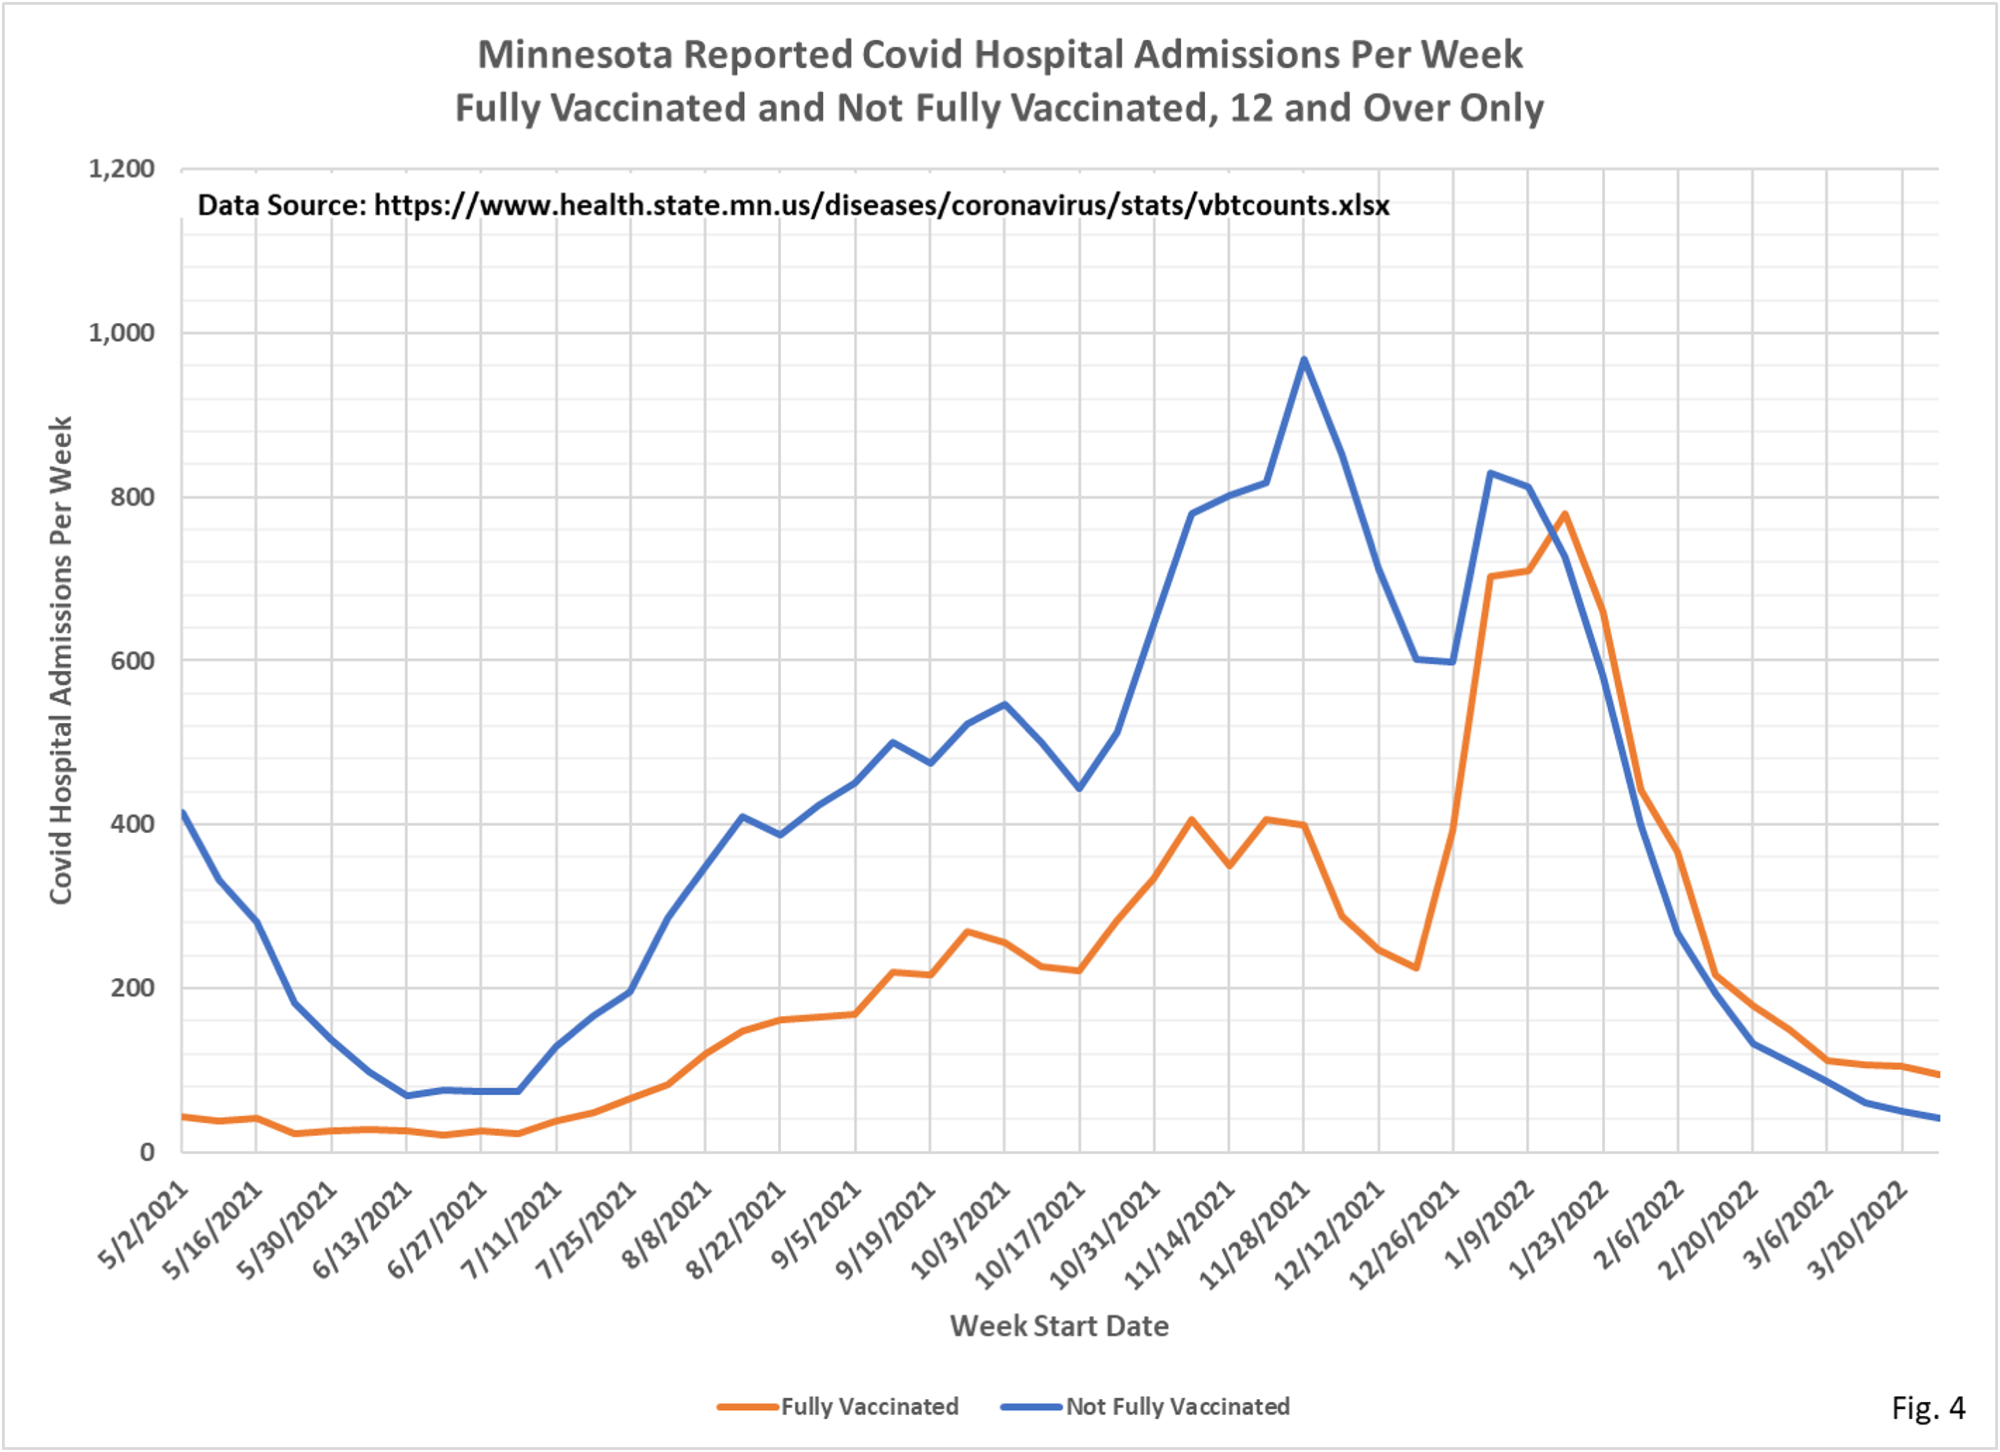
- Fig. 4: This chart displays the hospital admissions among the vaccinated and unvaccinated populations each week from the data in Fig. 2. Covid hospital admissions for both the vaccinated and unvaccinated continued to decline the week of 3/27/2022.
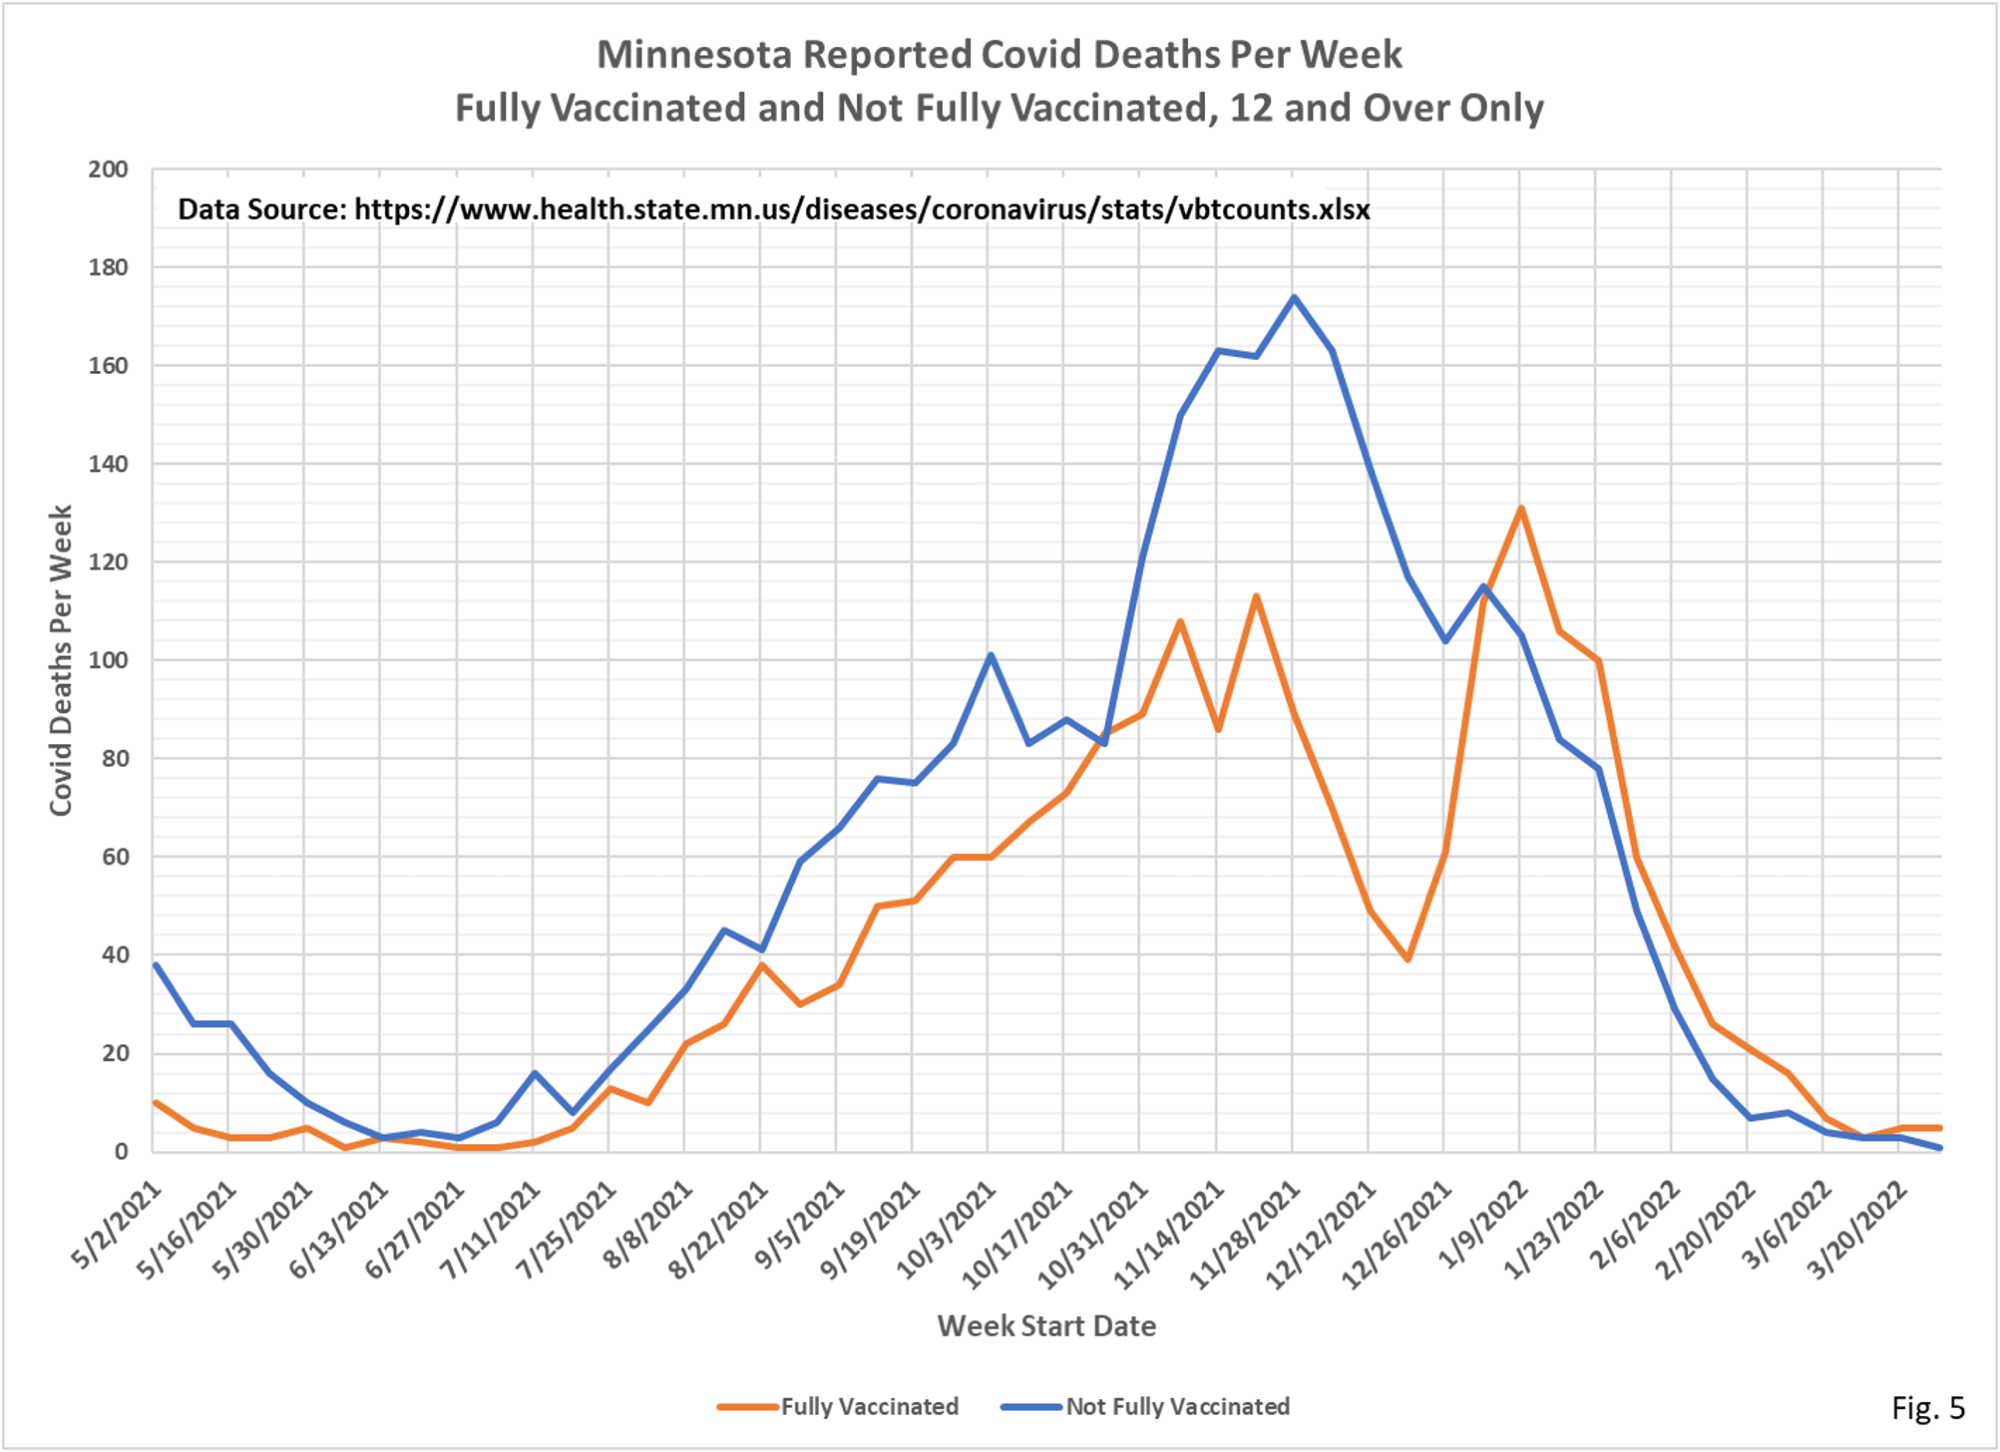
- Fig. 5: This chart displays the vaccinated and unvaccinated deaths each week from the data in Fig. 2. Death among vaccinated and unvaccinated remain at very low levels for the week of 3/27/2022.
- The tables and charts are updated for new data released by Minnesota Department of Health (MDH) on 5/02/2022, adding data for the week starting 3/27/2022 and ending 4/02/2022.
- The data source for the data on Fig. 1 is the cumulative breakthrough cases, hospitalizations, and deaths published on the MDH COVID-19 Vaccine Breakthrough Weekly Update https://www.health.state.mn.us/diseases/coronavirus/stats/vbt.html
- The data source for Fig. 2 is the data file https://www.health.state.mn.us/diseases/coronavirus/stats/vbtcounts.xlsx found on MDH web page https://www.health.state.mn.us/diseases/coronavirus/stats/vbt.html. The data provided in the data file vbtcounts.xlsx is used without modification, other than to sum the weekly events and compute the breakthrough proportion. Vbtcounts.xlsx provides breakthrough and non-breakthrough cases, hospital admissions, and deaths for each week listed.
- The charts in Fig. 3 through Fig. 6 are plots of the data in Fig. 2.
- MDH defines a breakthrough event as a Covid case, hospital admission, or death that occurs 14 or more days after completing the vaccination series (not including boosters.
