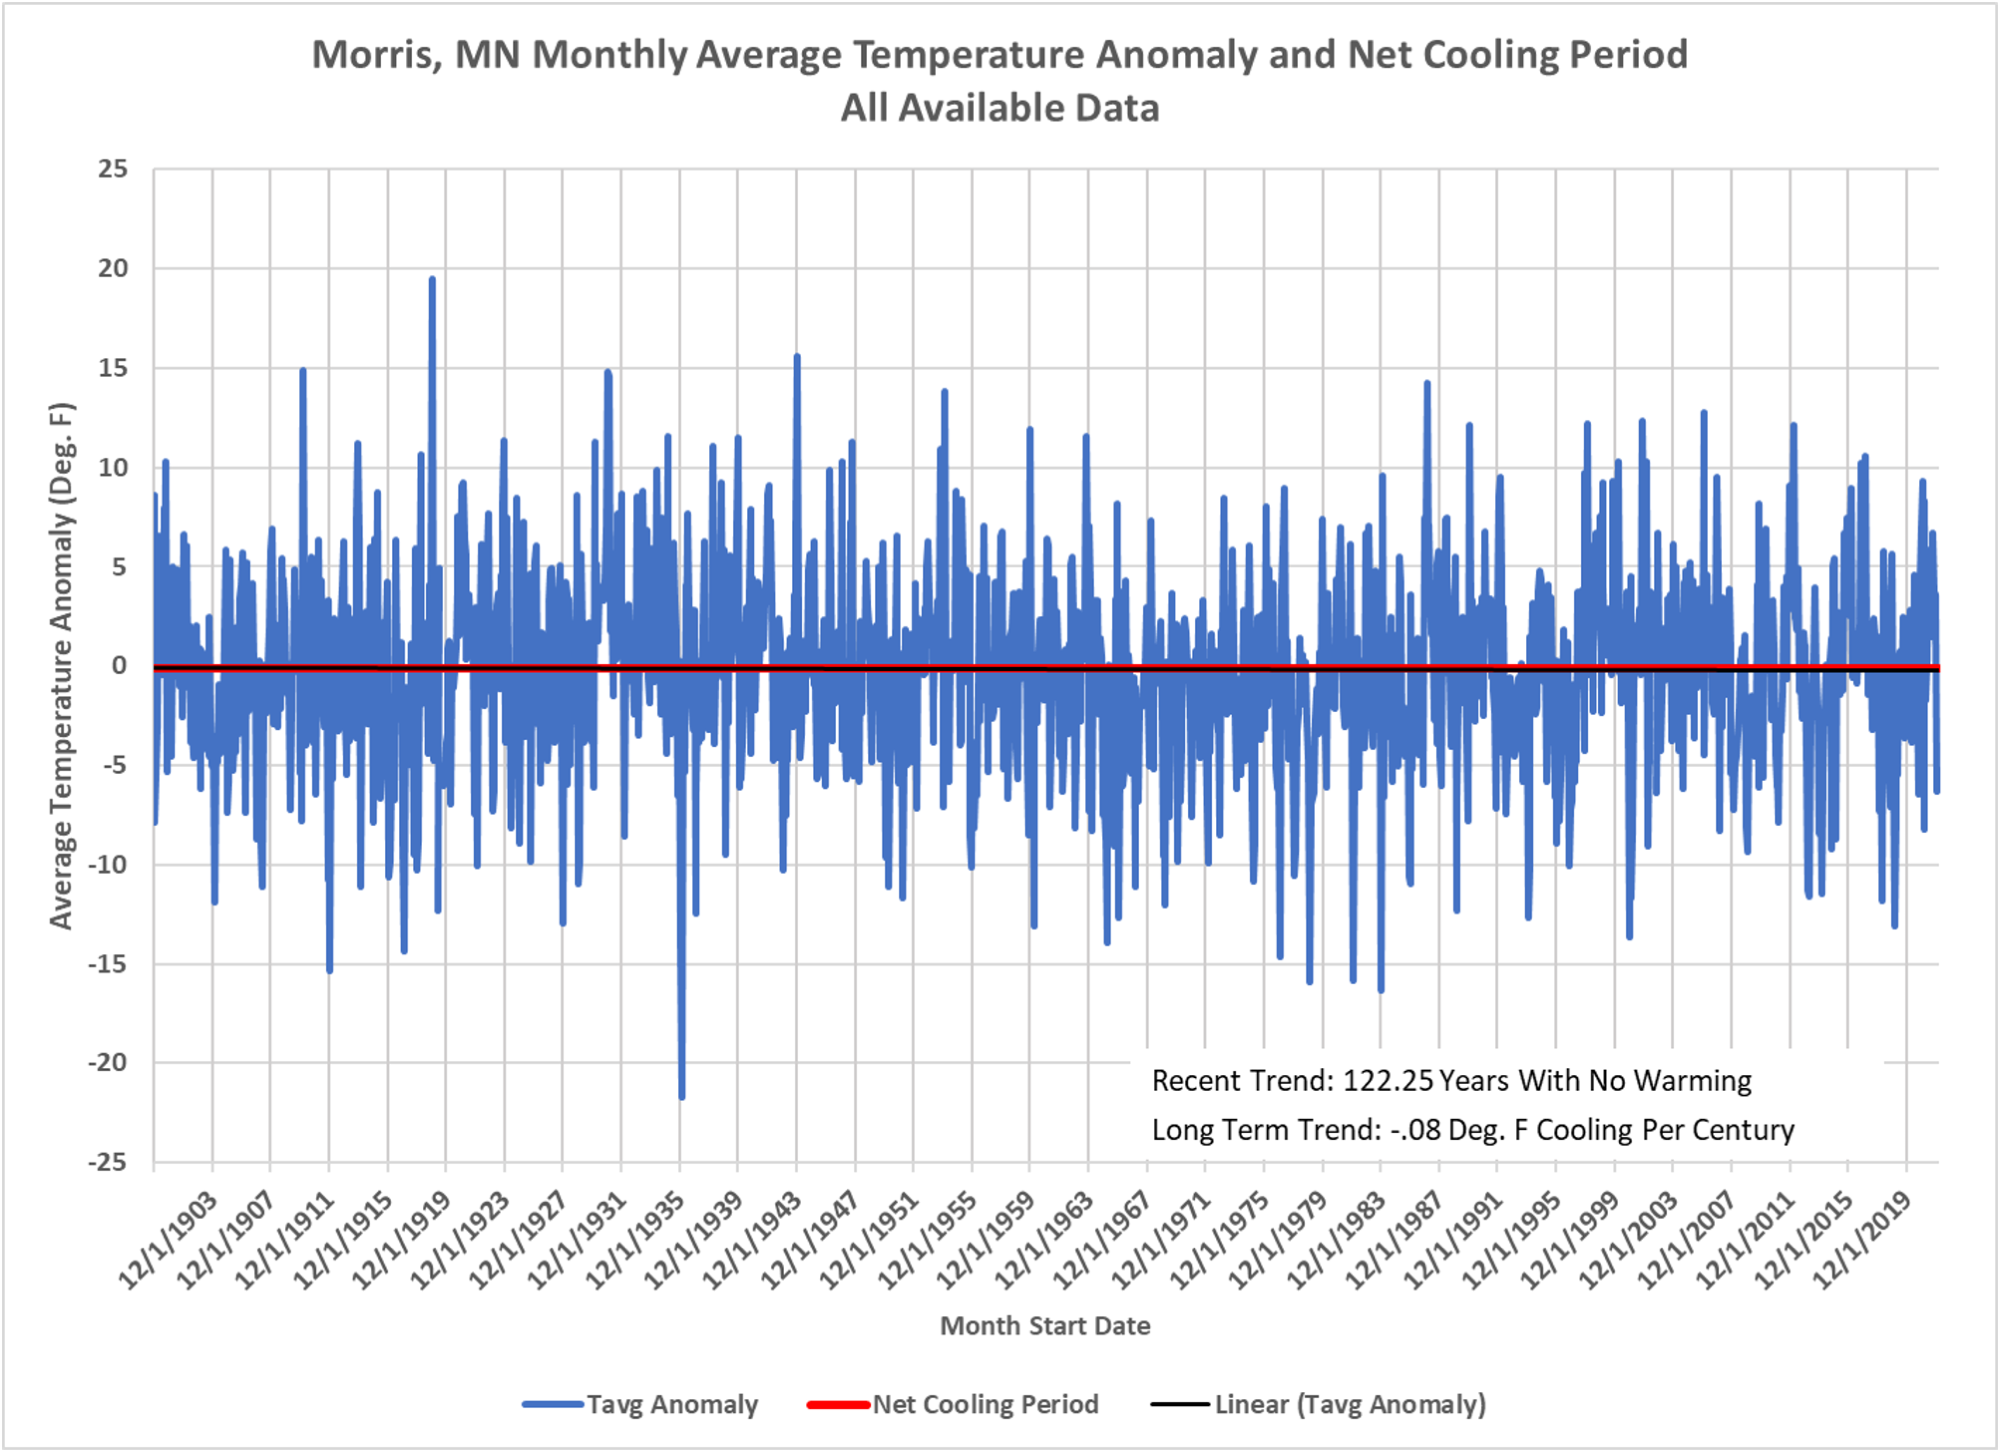
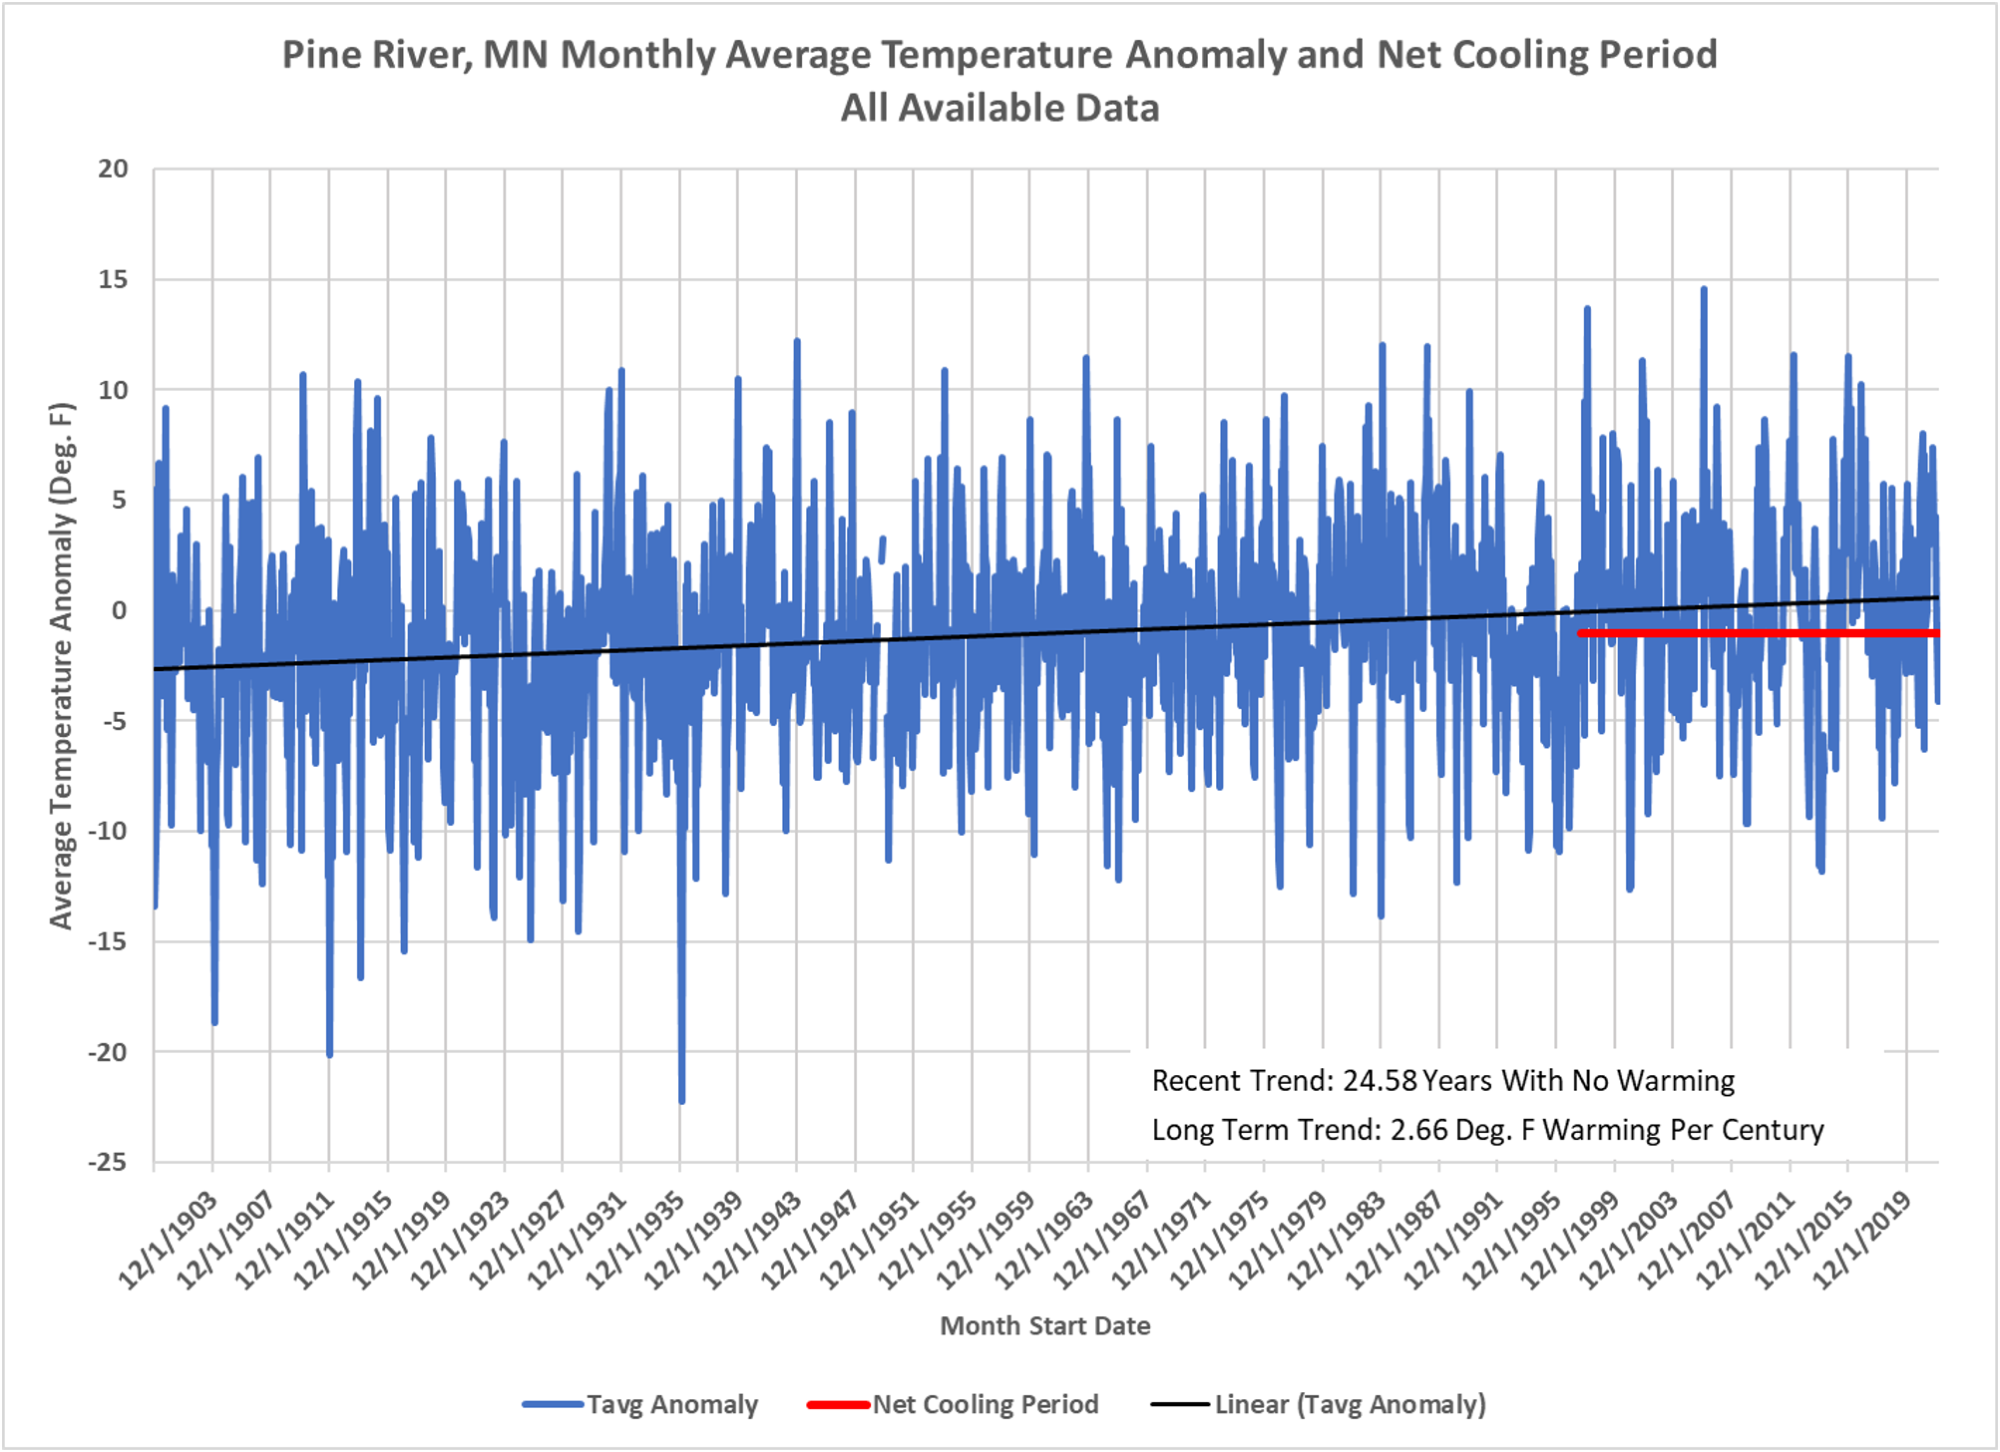
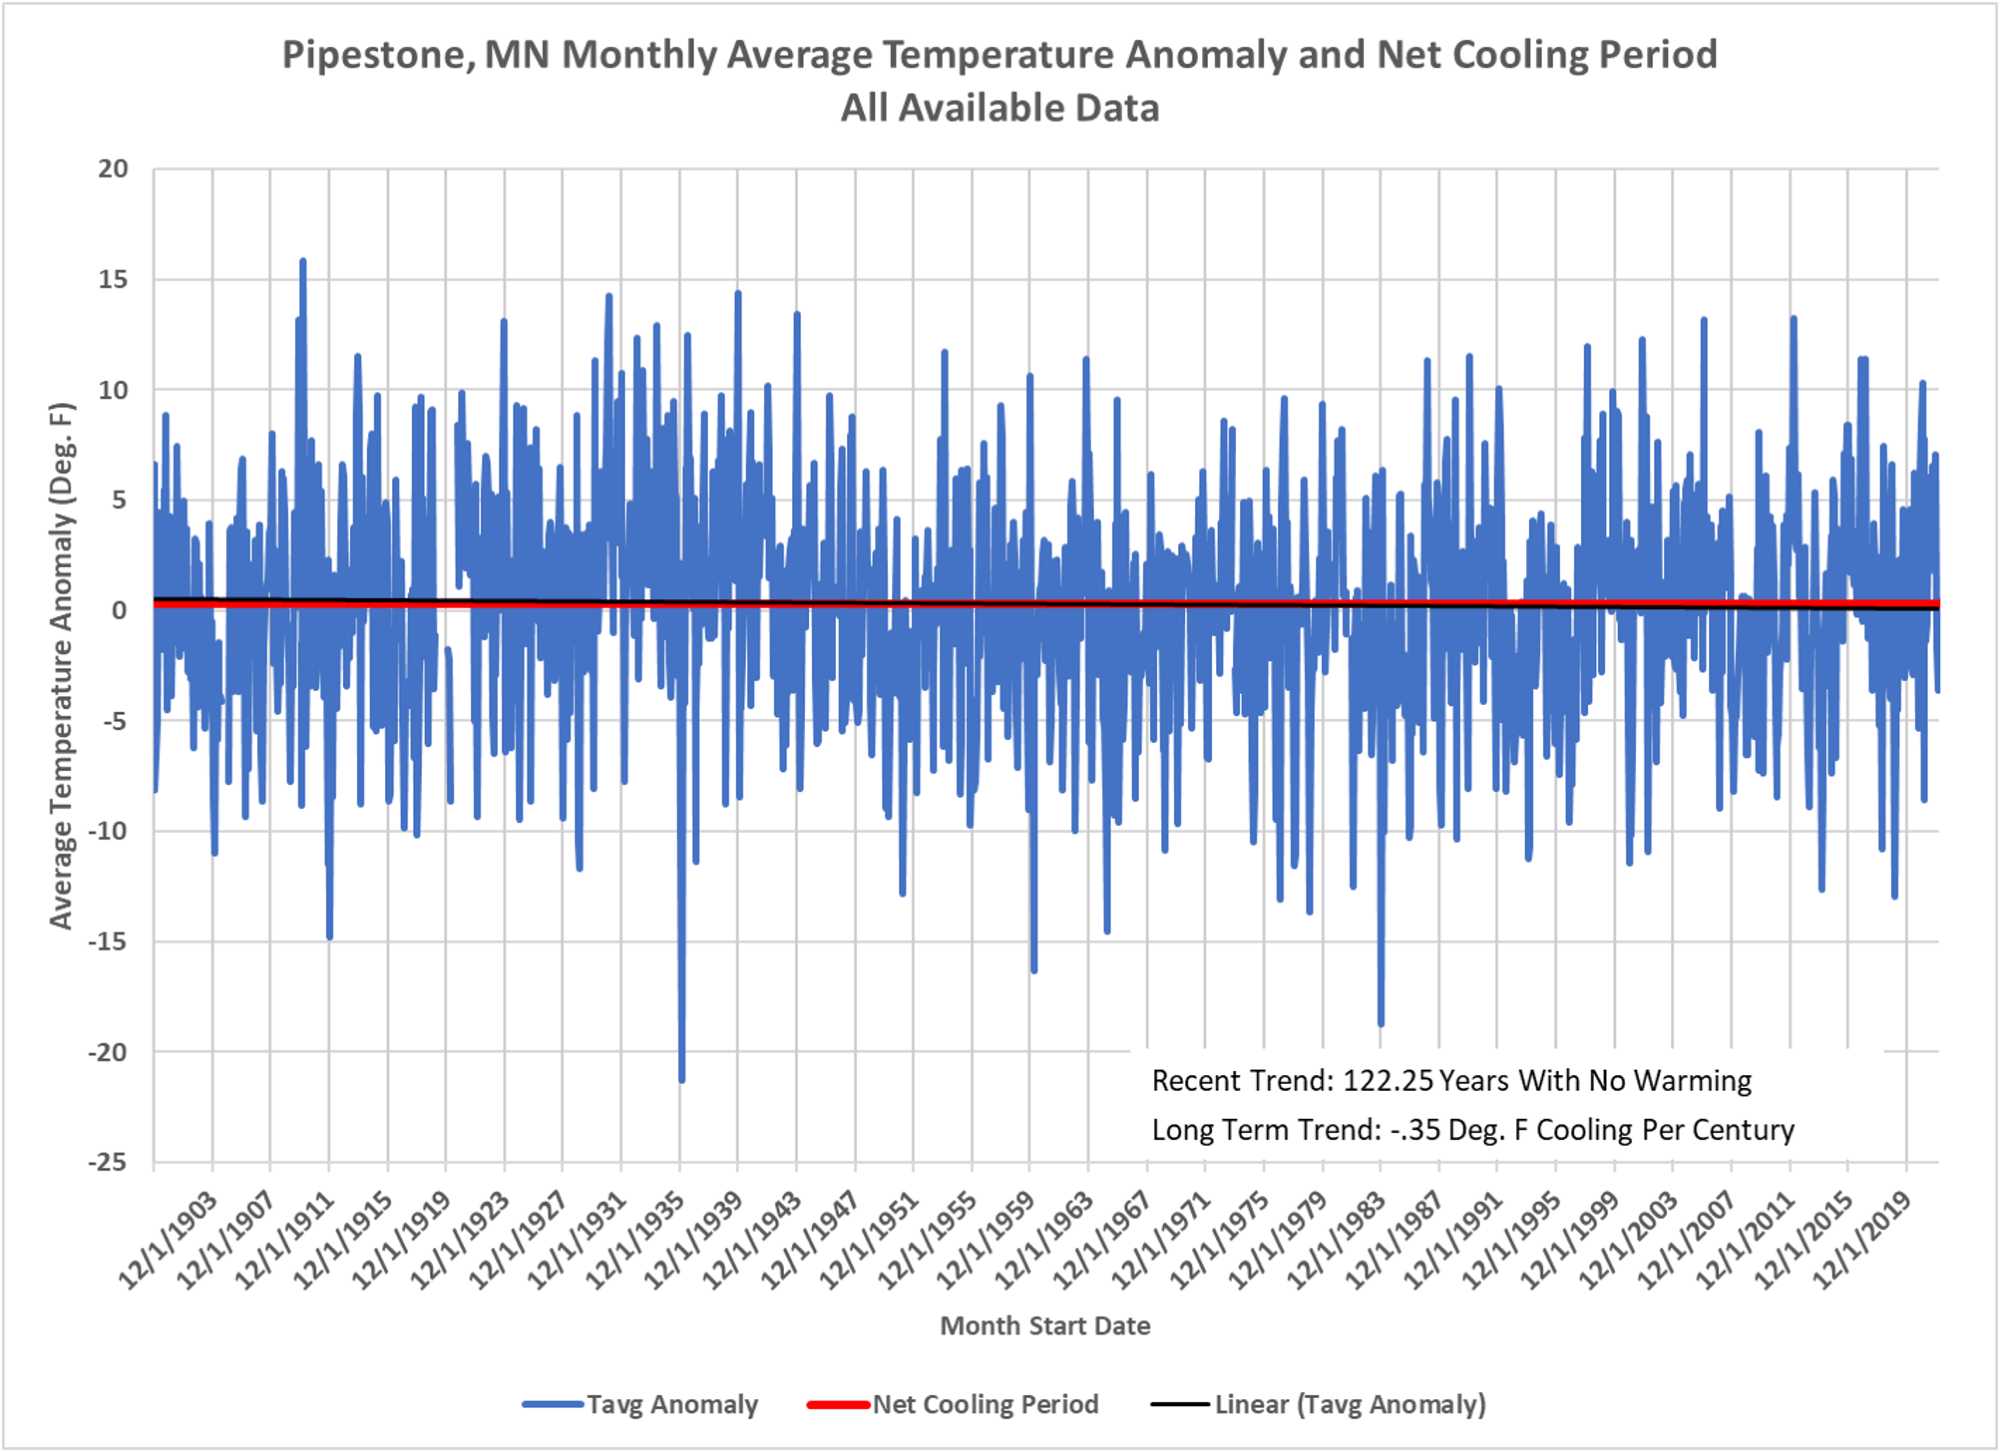
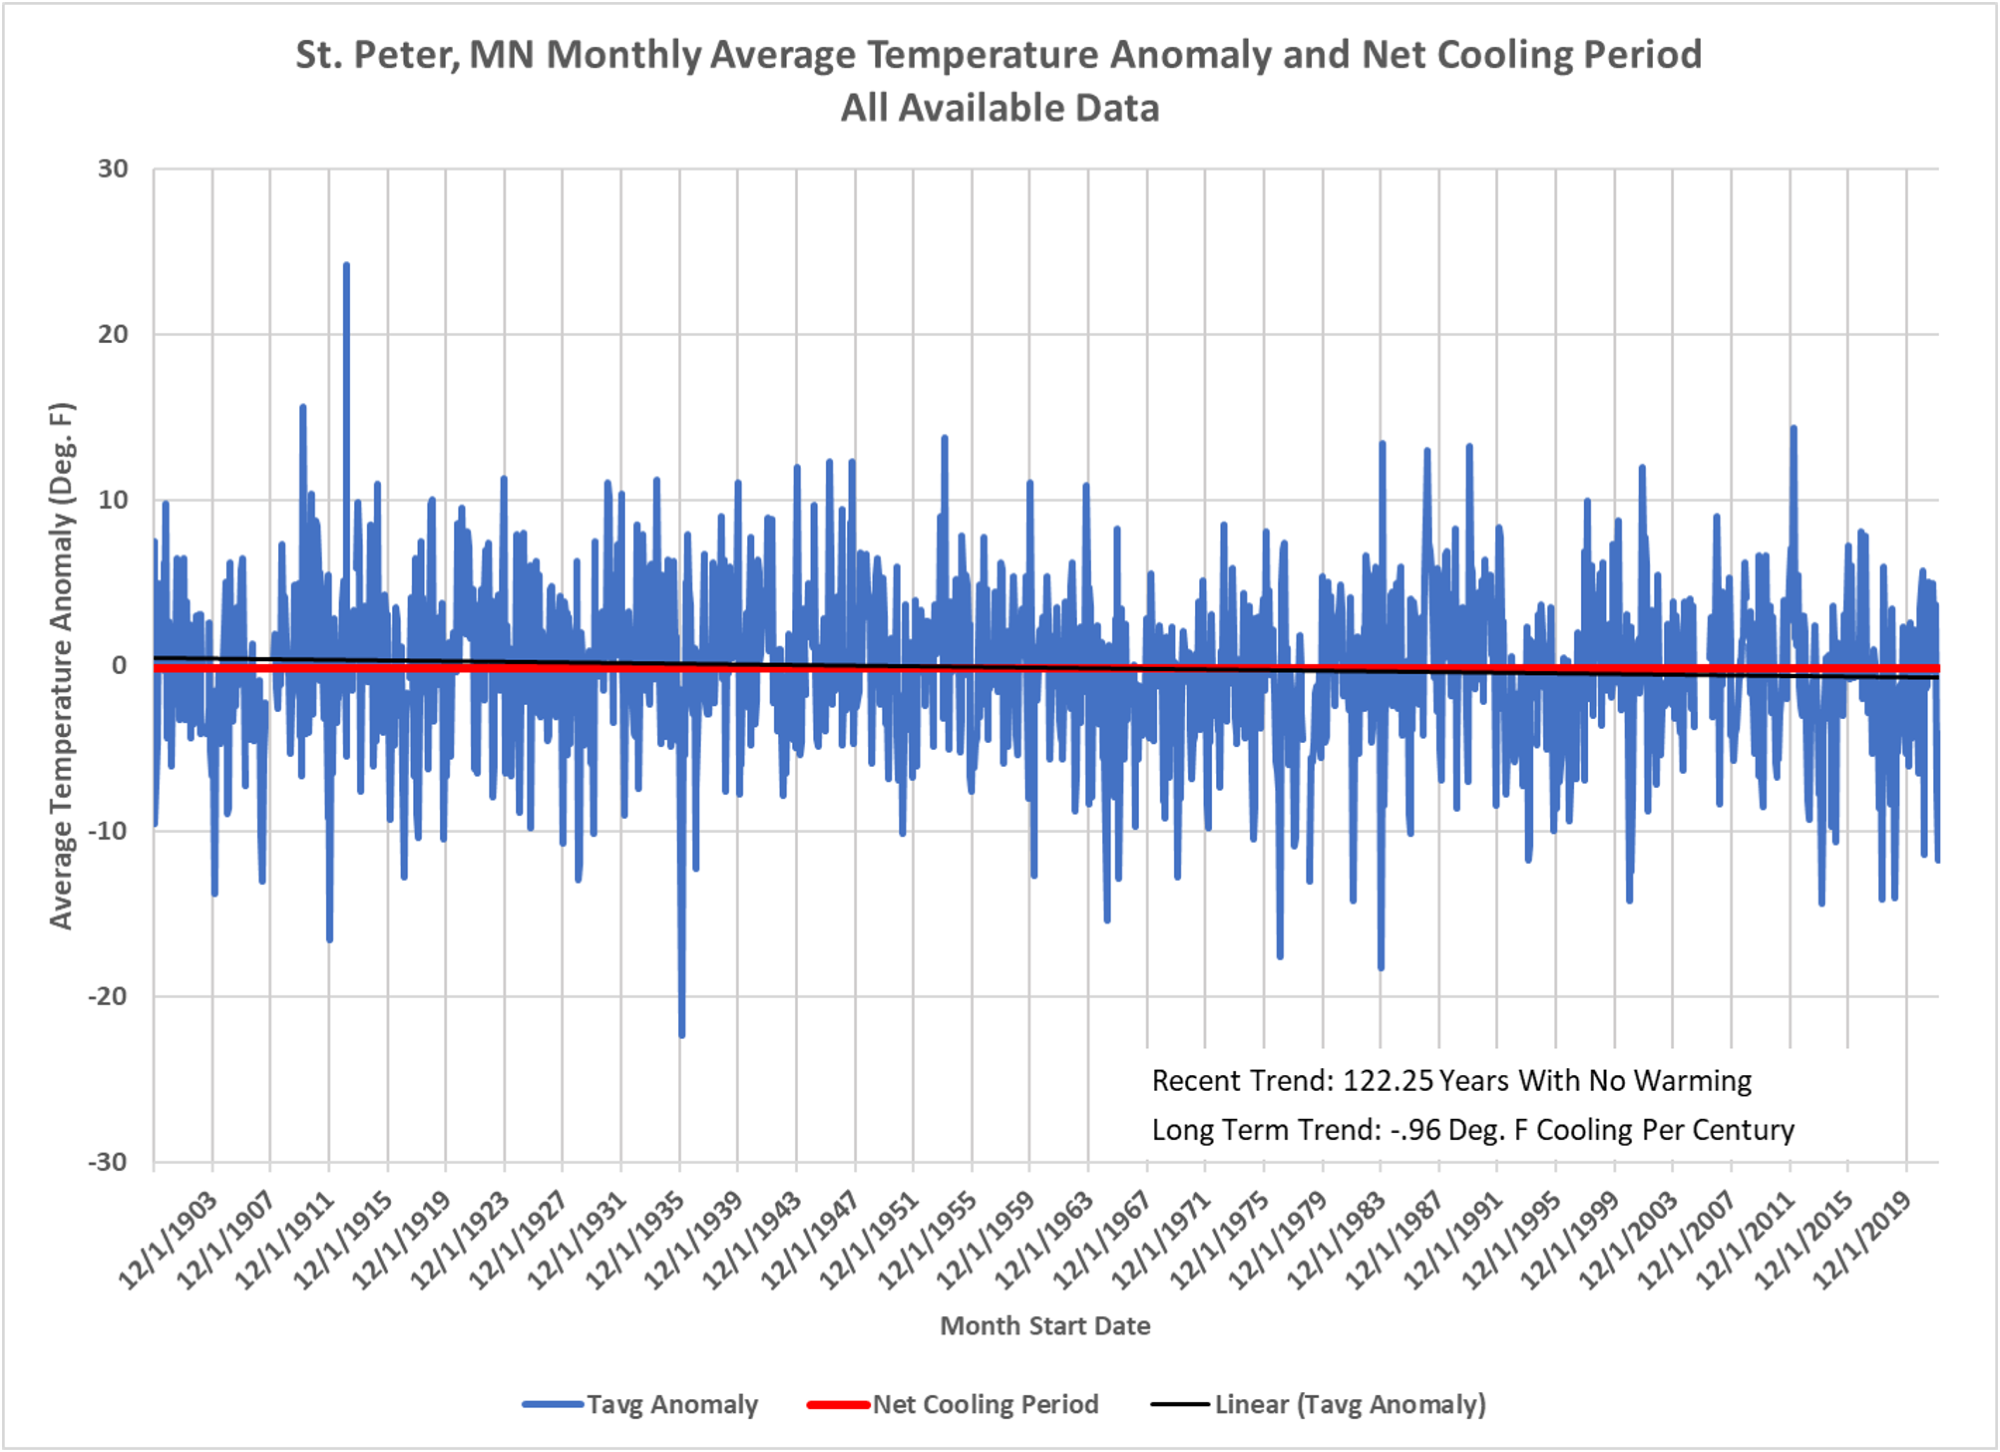
The premise of this series was that rural stations are more likely to reflect long-term real temperature trends, assuming no siting issues, than urban or suburban ones, where there is a known impact of dense population, building and infrastructure. Dave Dixon has done this work and I must say it yielded some interesting surprises. This is the remainder of the primary weather stations in rural Minnesota that have sufficient data and it appears quite clear that northern Minnesota has a warming trend over the entire period, although not in recent decades, while there is very little warming in the center of the state and there has been slight cooling in the southern and southwestern parts. It would be interesting to understand why.
 Dave’s notes:
- We are continuing our examination of Minnesota weather stations. On 4/24/2022, here https://healthy-skeptic.com/
2022/04/24/more-temperature- records-from-minnesota/, we published basic analysis on the first 6 sites in Minnesota that are part of the United States Historic Climatology Network (USHCN). In this post we have charts for 12 additional Minnesota sites. The USHCN is a subset of weather stations that were selected on the basis of “spatial coverage, record length, data completeness, and historical stability”, as described here: https://www.ncei.noaa.gov/ products/land-based-station/ us-historical-climatology- network. Note that accuracy of the temperature measurements isn’t necessarily a factor in selecting these sites. Proximity of buildings and pavement is suspected of influencing temperature measurements. In future installments on this project we will evaluate the impact of siting quality on the temperature trends in Minnesota. - With this post we have now completed an initial review of 18 of the 33 Minnesota USHCN sites. For the remaining sites we are unable to obtain daily raw temperature data, as described in No. 3 below, so we face a quandary in how to handle these 15 sites. USHCN monthly averages, both raw and adjusted, are available for all 33 sites. It is probably not wise to mix and match data sources so in order to fully analyze all 33 Minnesota USHCN sites we will probably need to switch to USHCN monthly data for the next phase of this project.
- The National Oceanic and Atmospheric Administration (NOAA) publishes monthly high, low, and average temperatures for each USHCN site, on both a raw and an adjusted basis. For our effort here we are not using this published data, but instead are using the raw daily temperature data downloaded from NOAA here: https://www.ncdc.noaa.gov/cdo-
web/ and calculating our own monthly averages. We are avoiding use of the official USHCN data sets for now based on some reports that the adjusted versions of the USHCN data tended to increase long term warming trends. For example, here is an analysis at Climate Audit: https://climateaudit.org/2007/ 02/16/adjusting-ushcn-history/ which displays how the USHCN in the overall US had an increased warming trend from one adjustment version to another. Here is another analysis of USHCN adjustments at Watts Up With That: https://wattsupwiththat.com/ 2012/04/13/warming-in-the- ushcn-is-mainly-an-artifact- of-adjustments/. It would be logical for us to eventually compare the raw and adjusted versions of the USHCN data site for each site. - After downloading the daily data the only changes made are to remove days with no data. When the data is downloaded days with missing data appear as zero, and if left in the data set would be treated as zero degrees in the analysis. Fortunately days with missing temperature data are also missing the time of observation notation, giving us a way to remove the days which are missing versus the days that are actually at zero degrees.
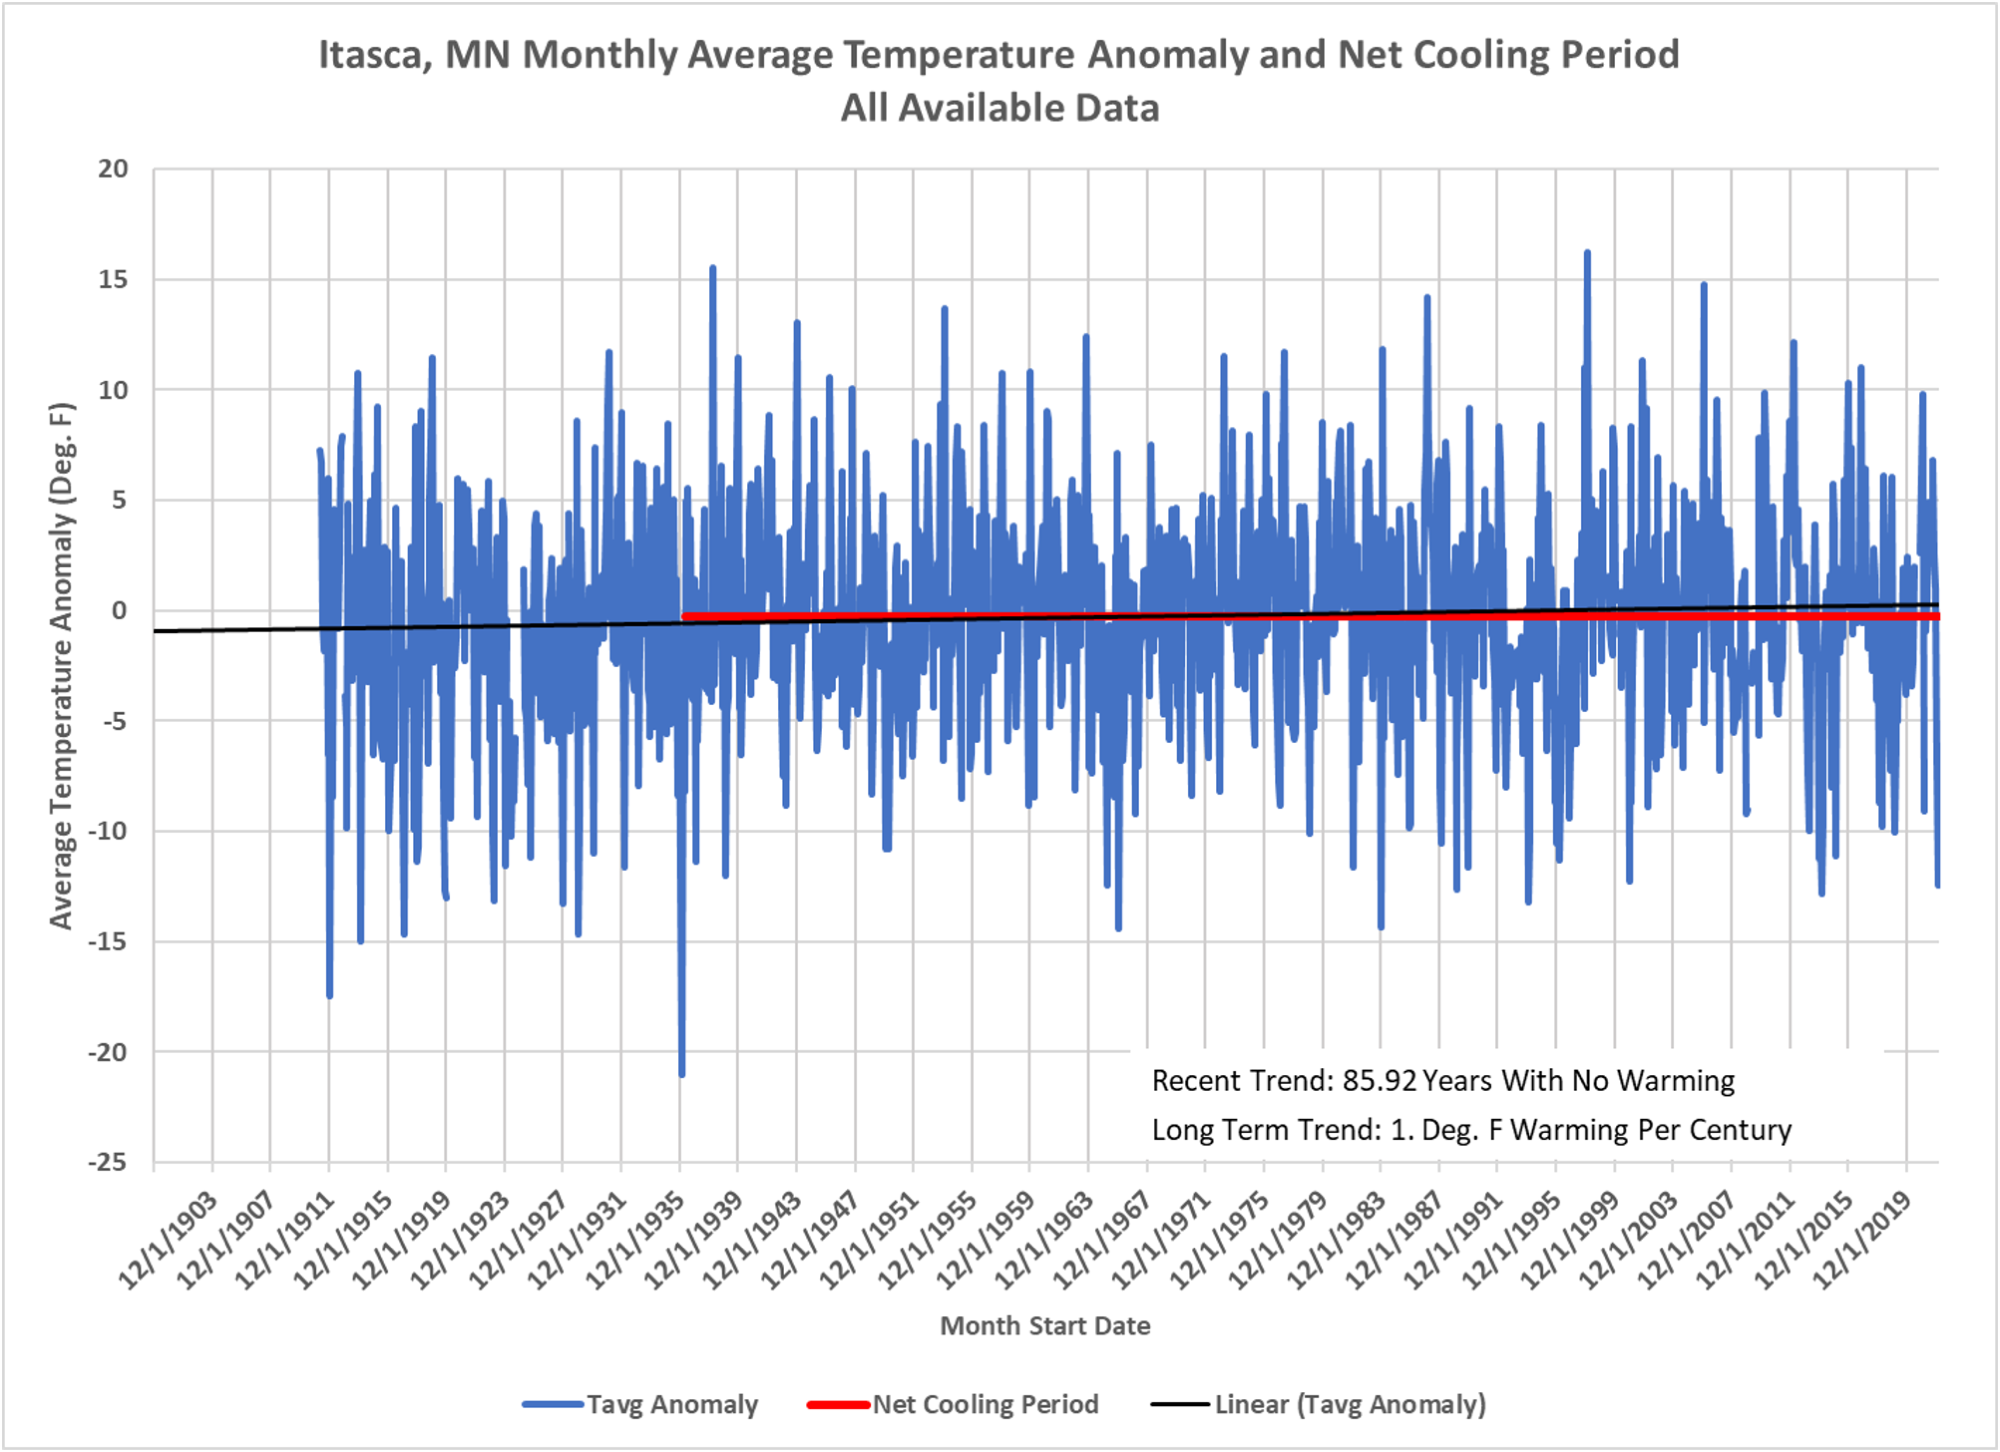
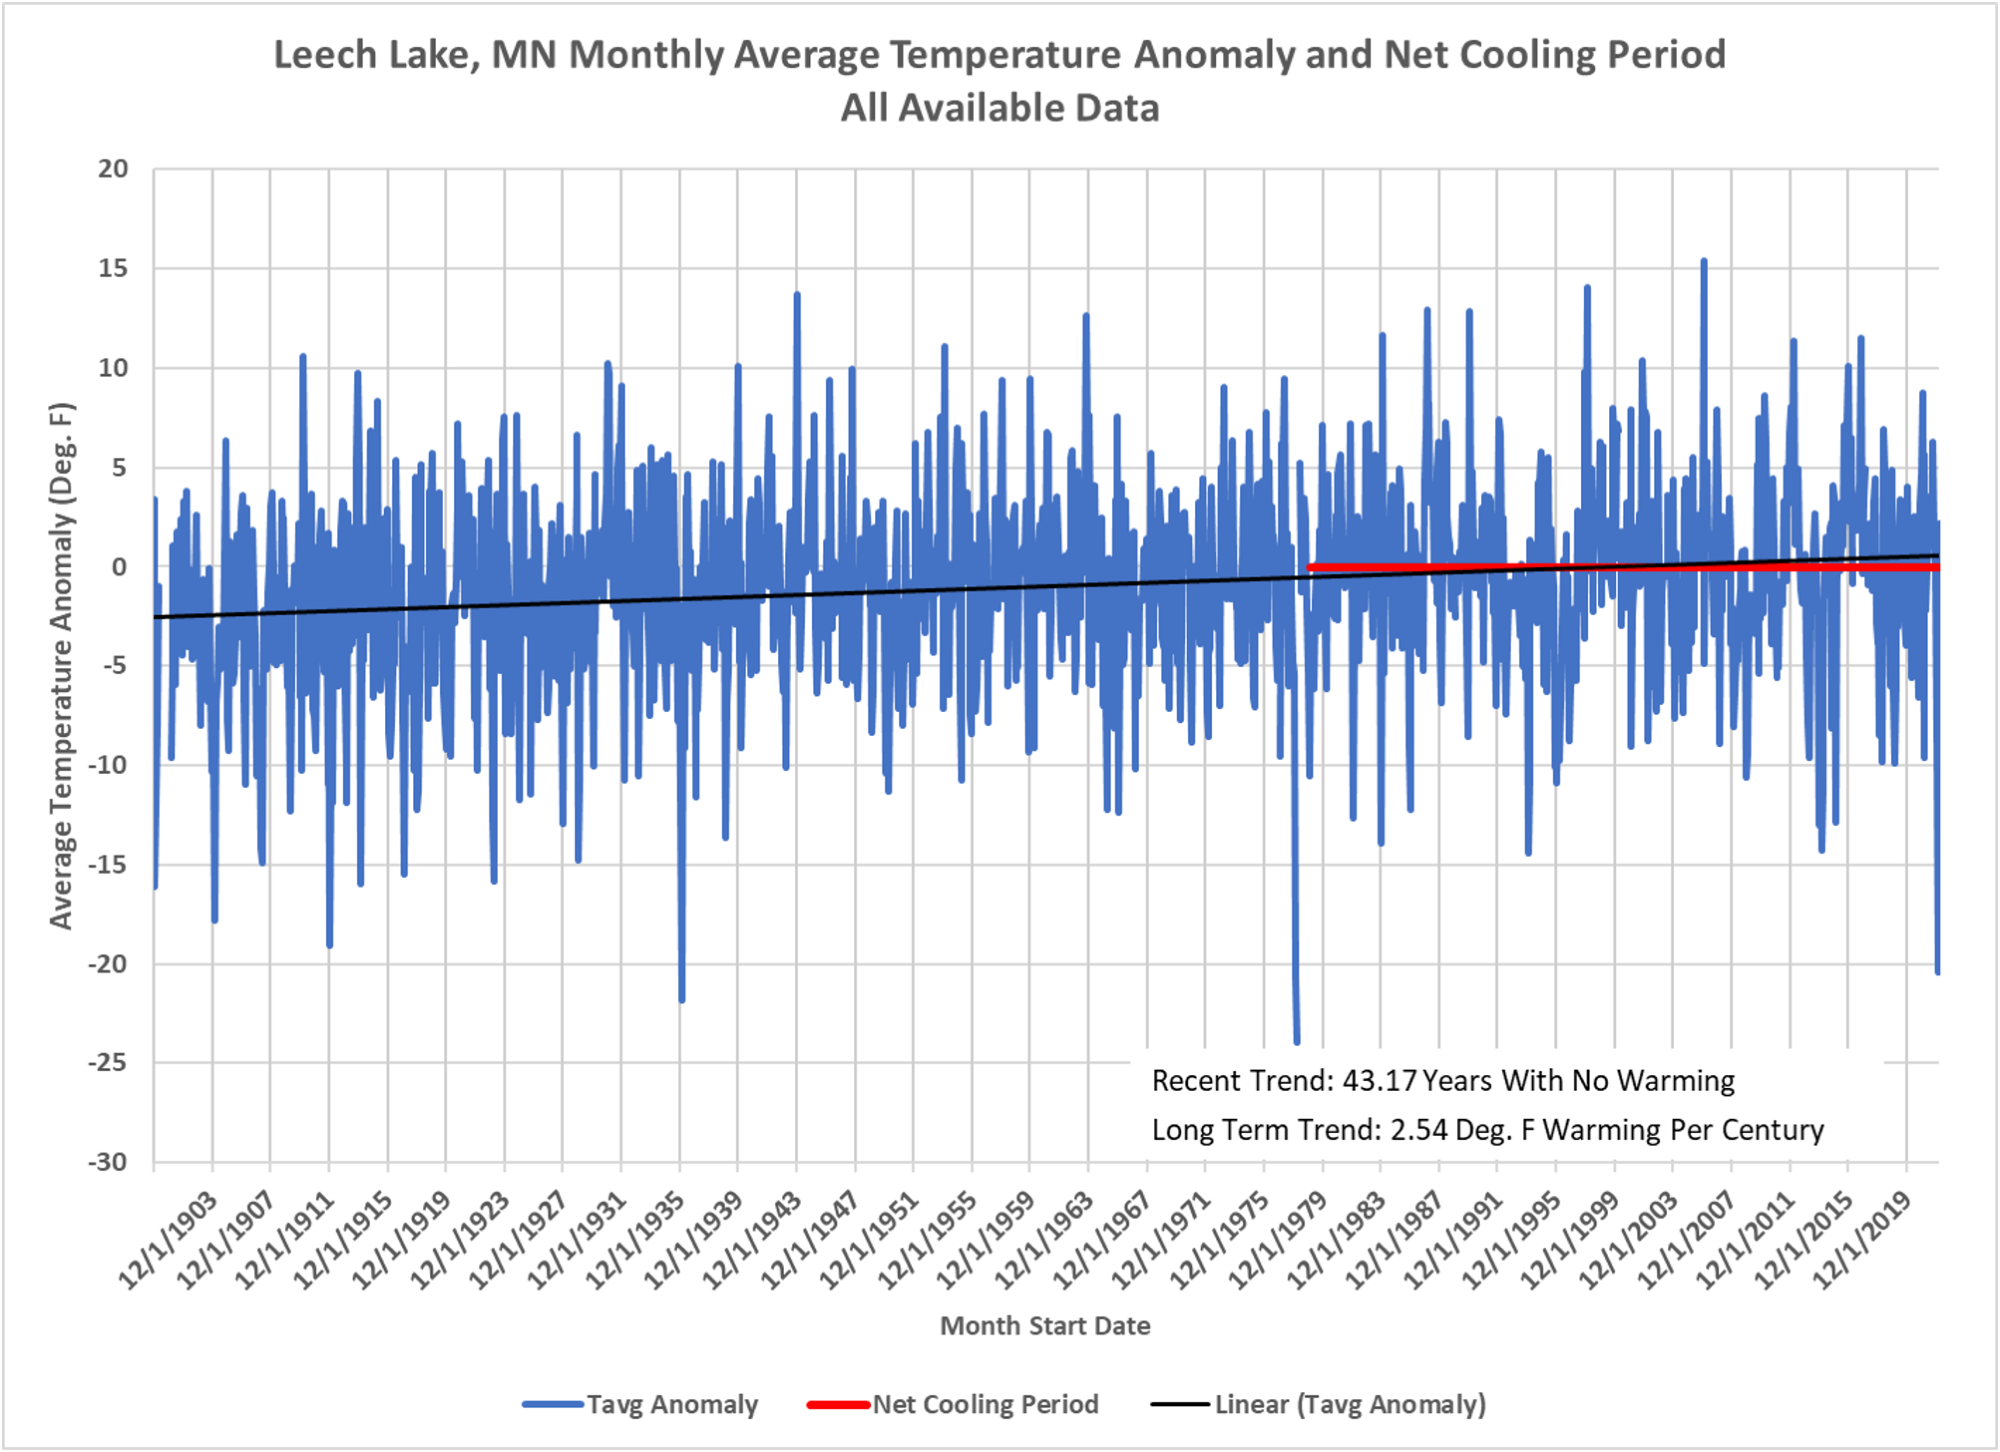
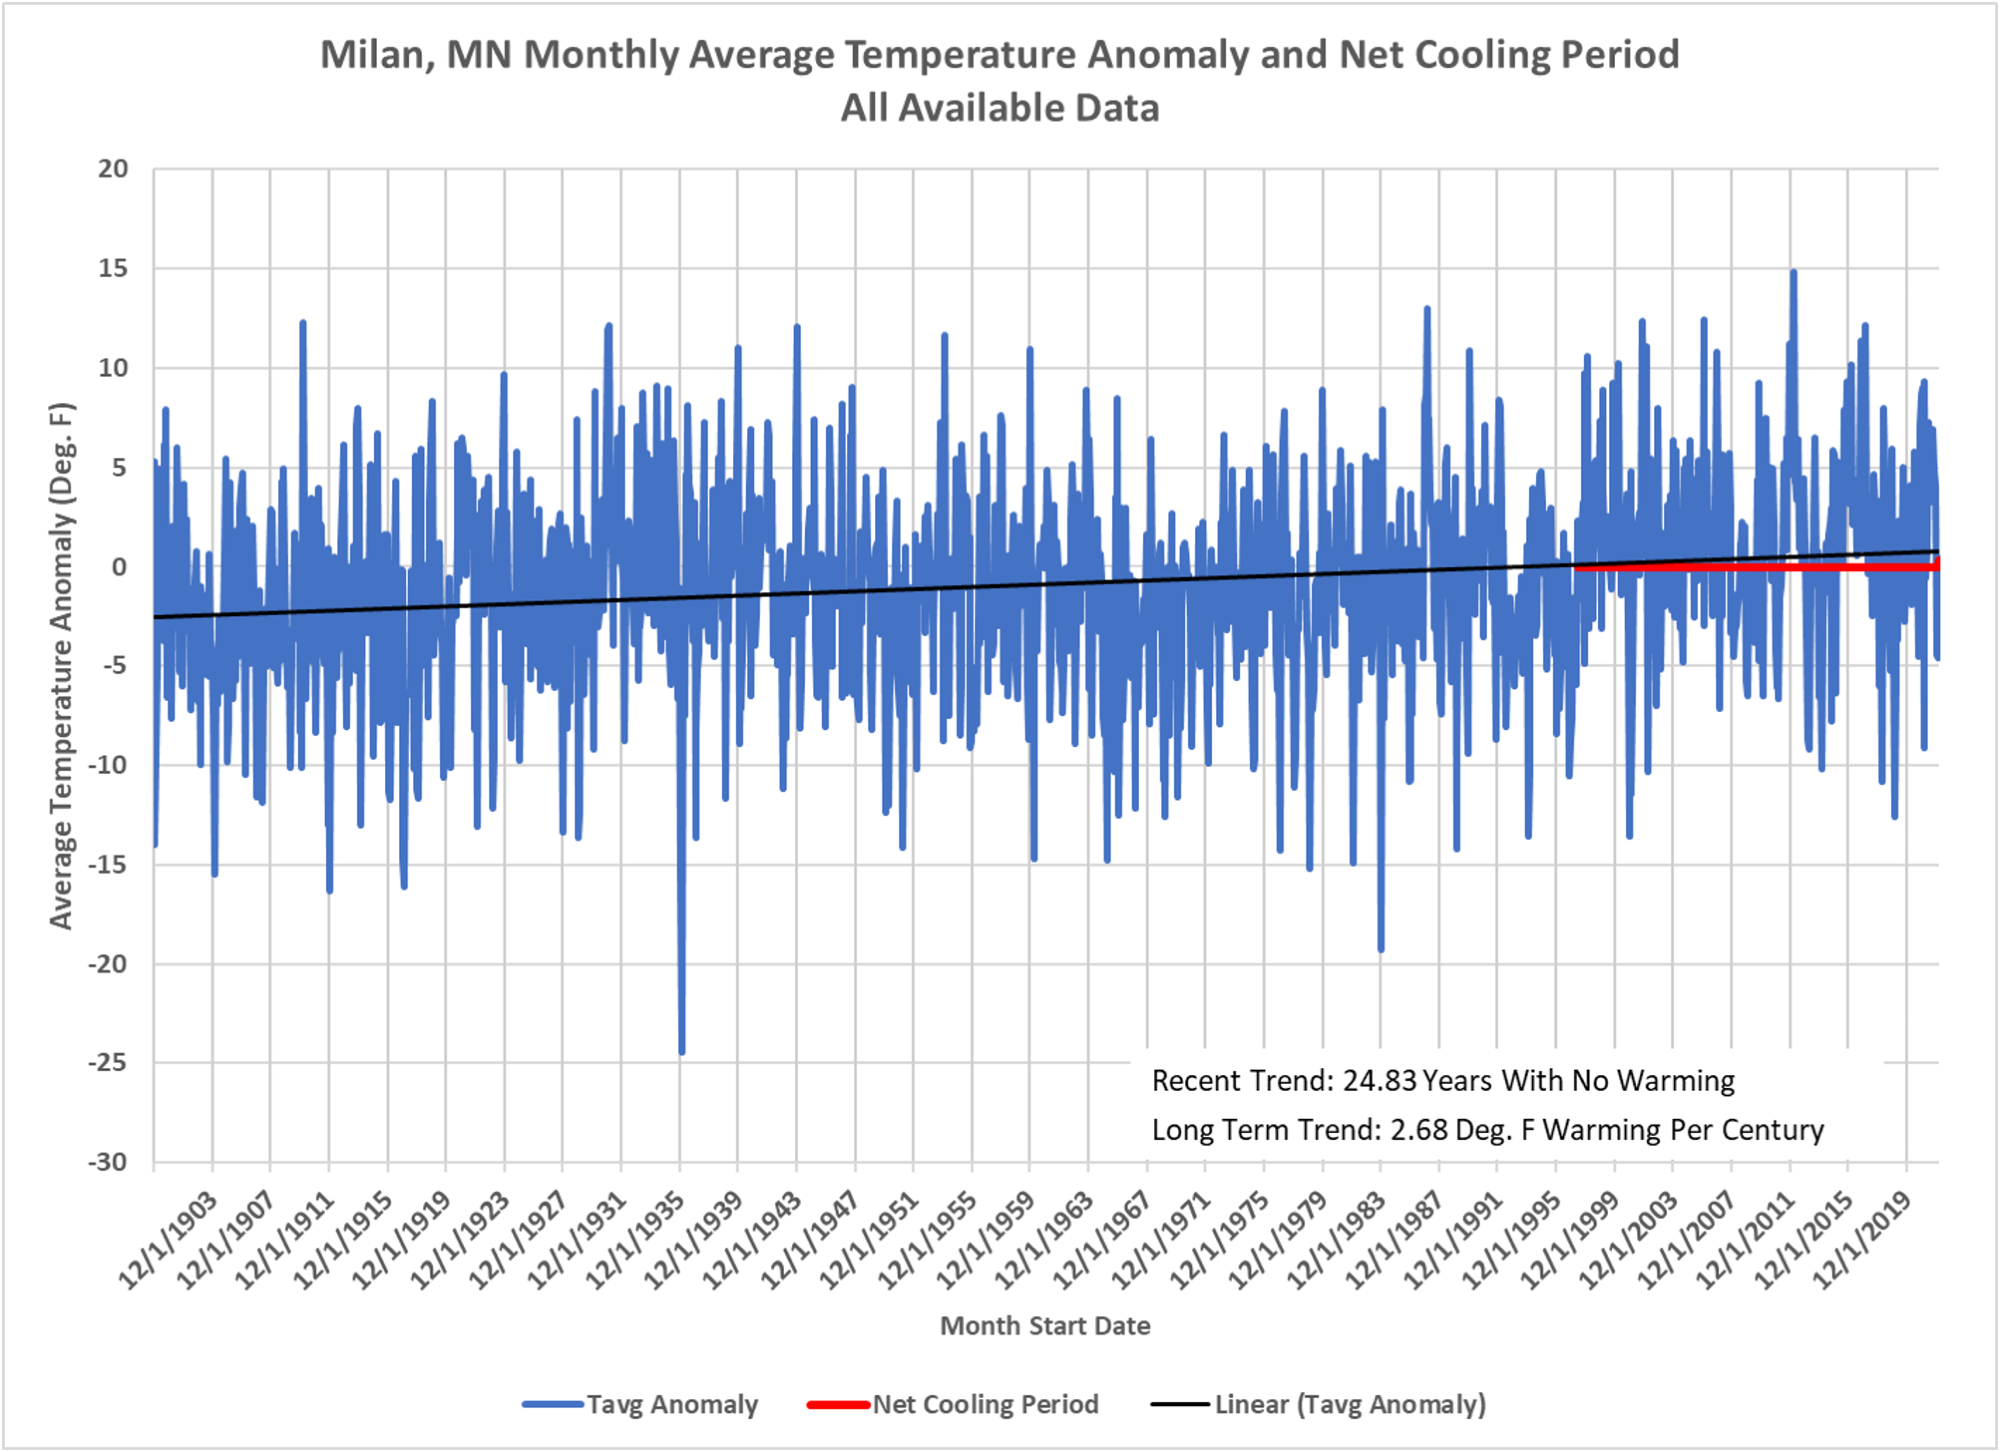
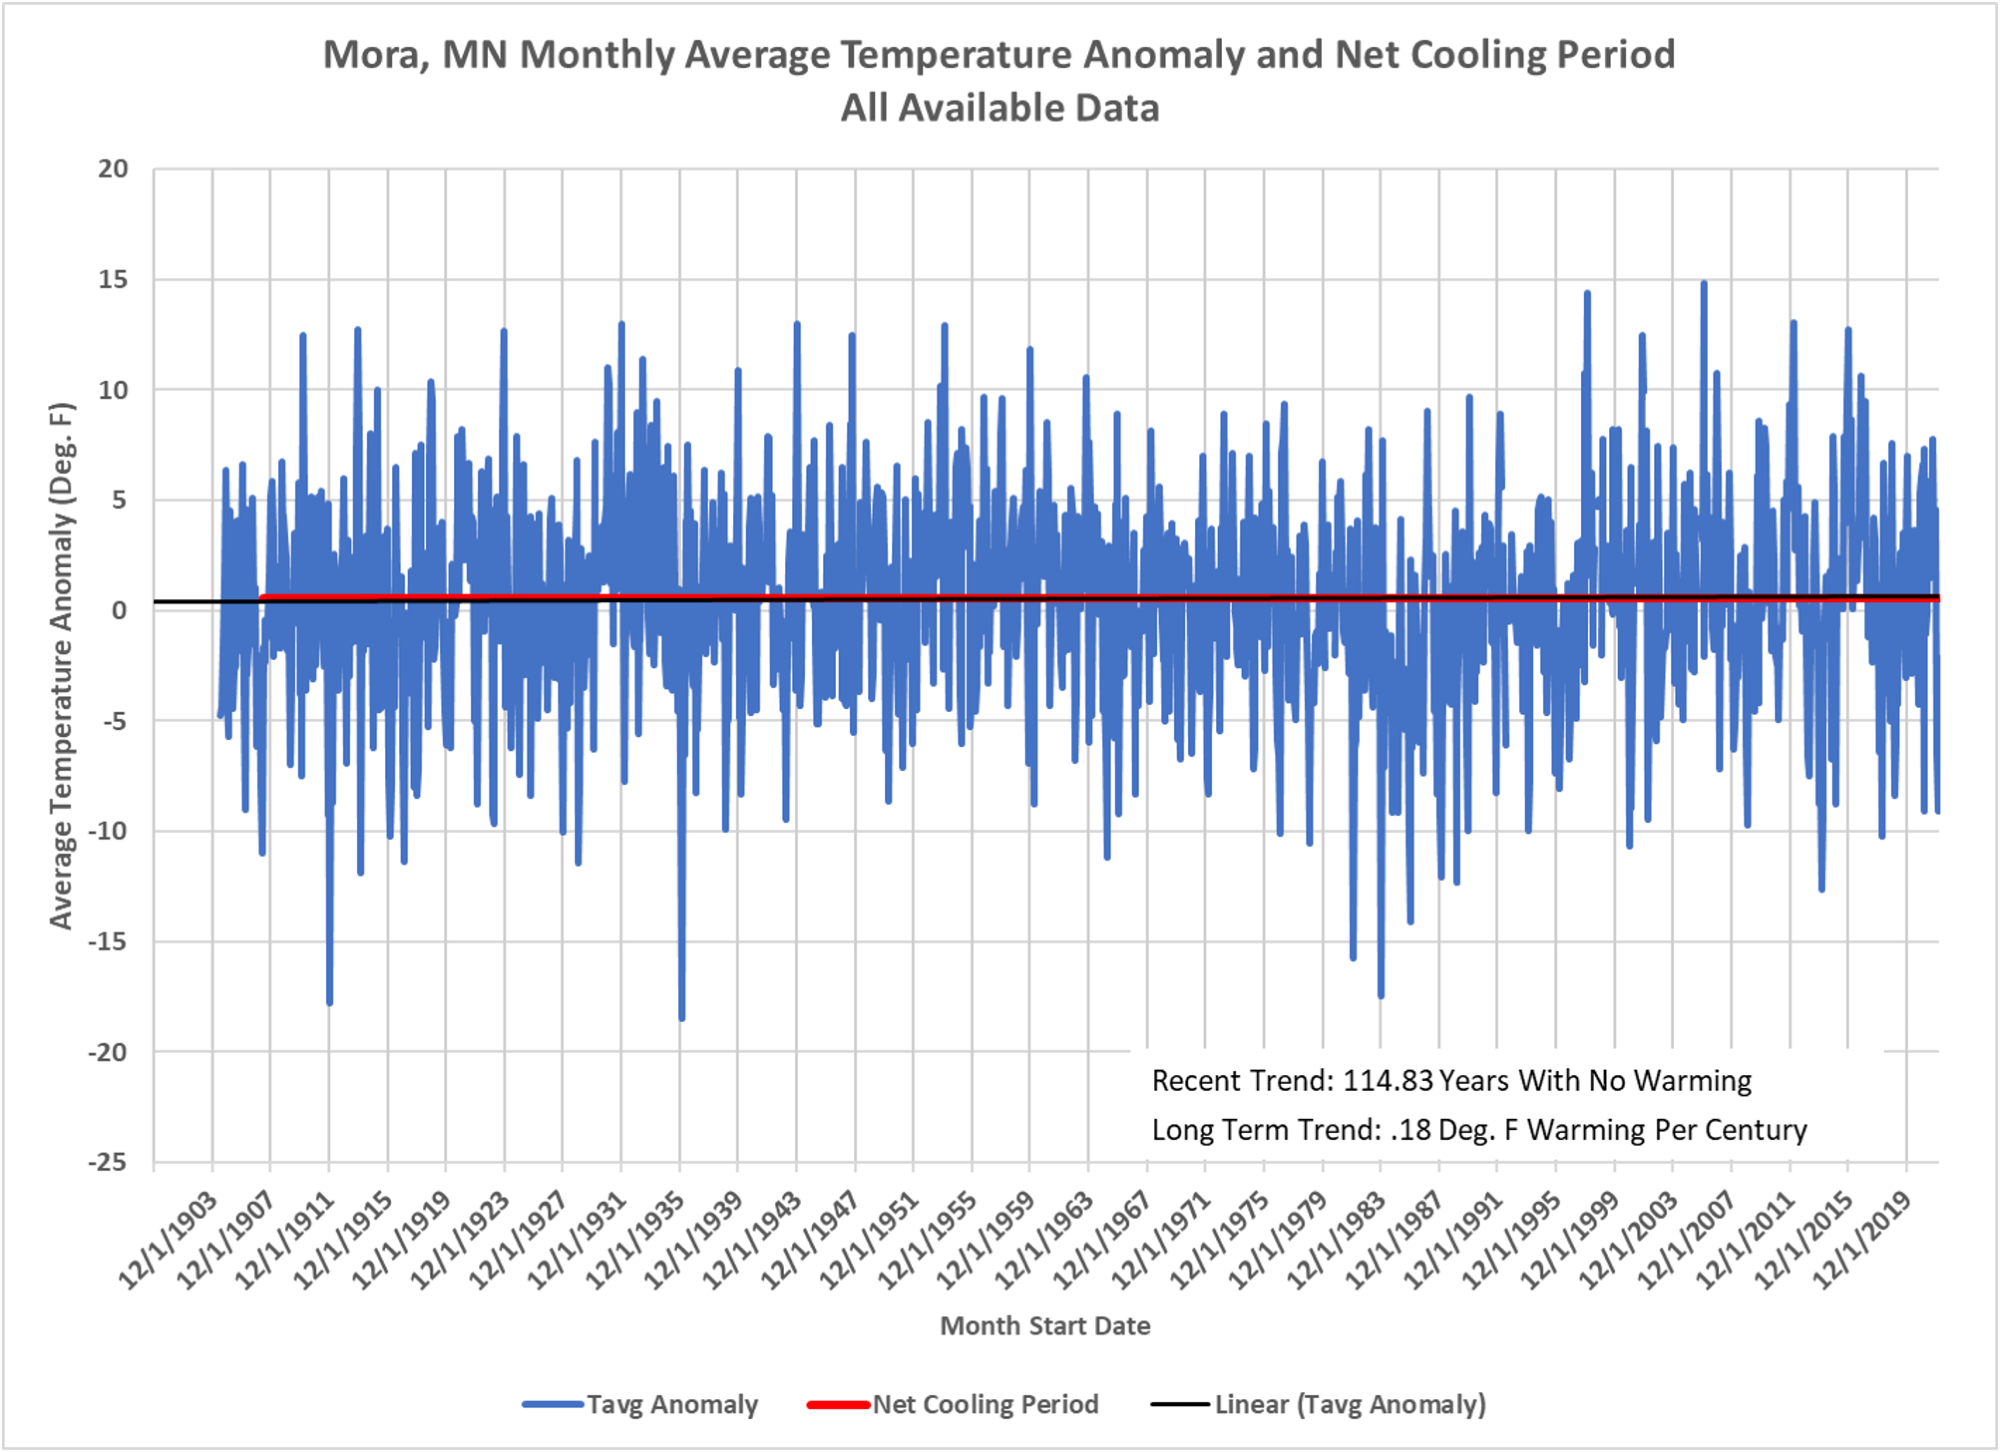
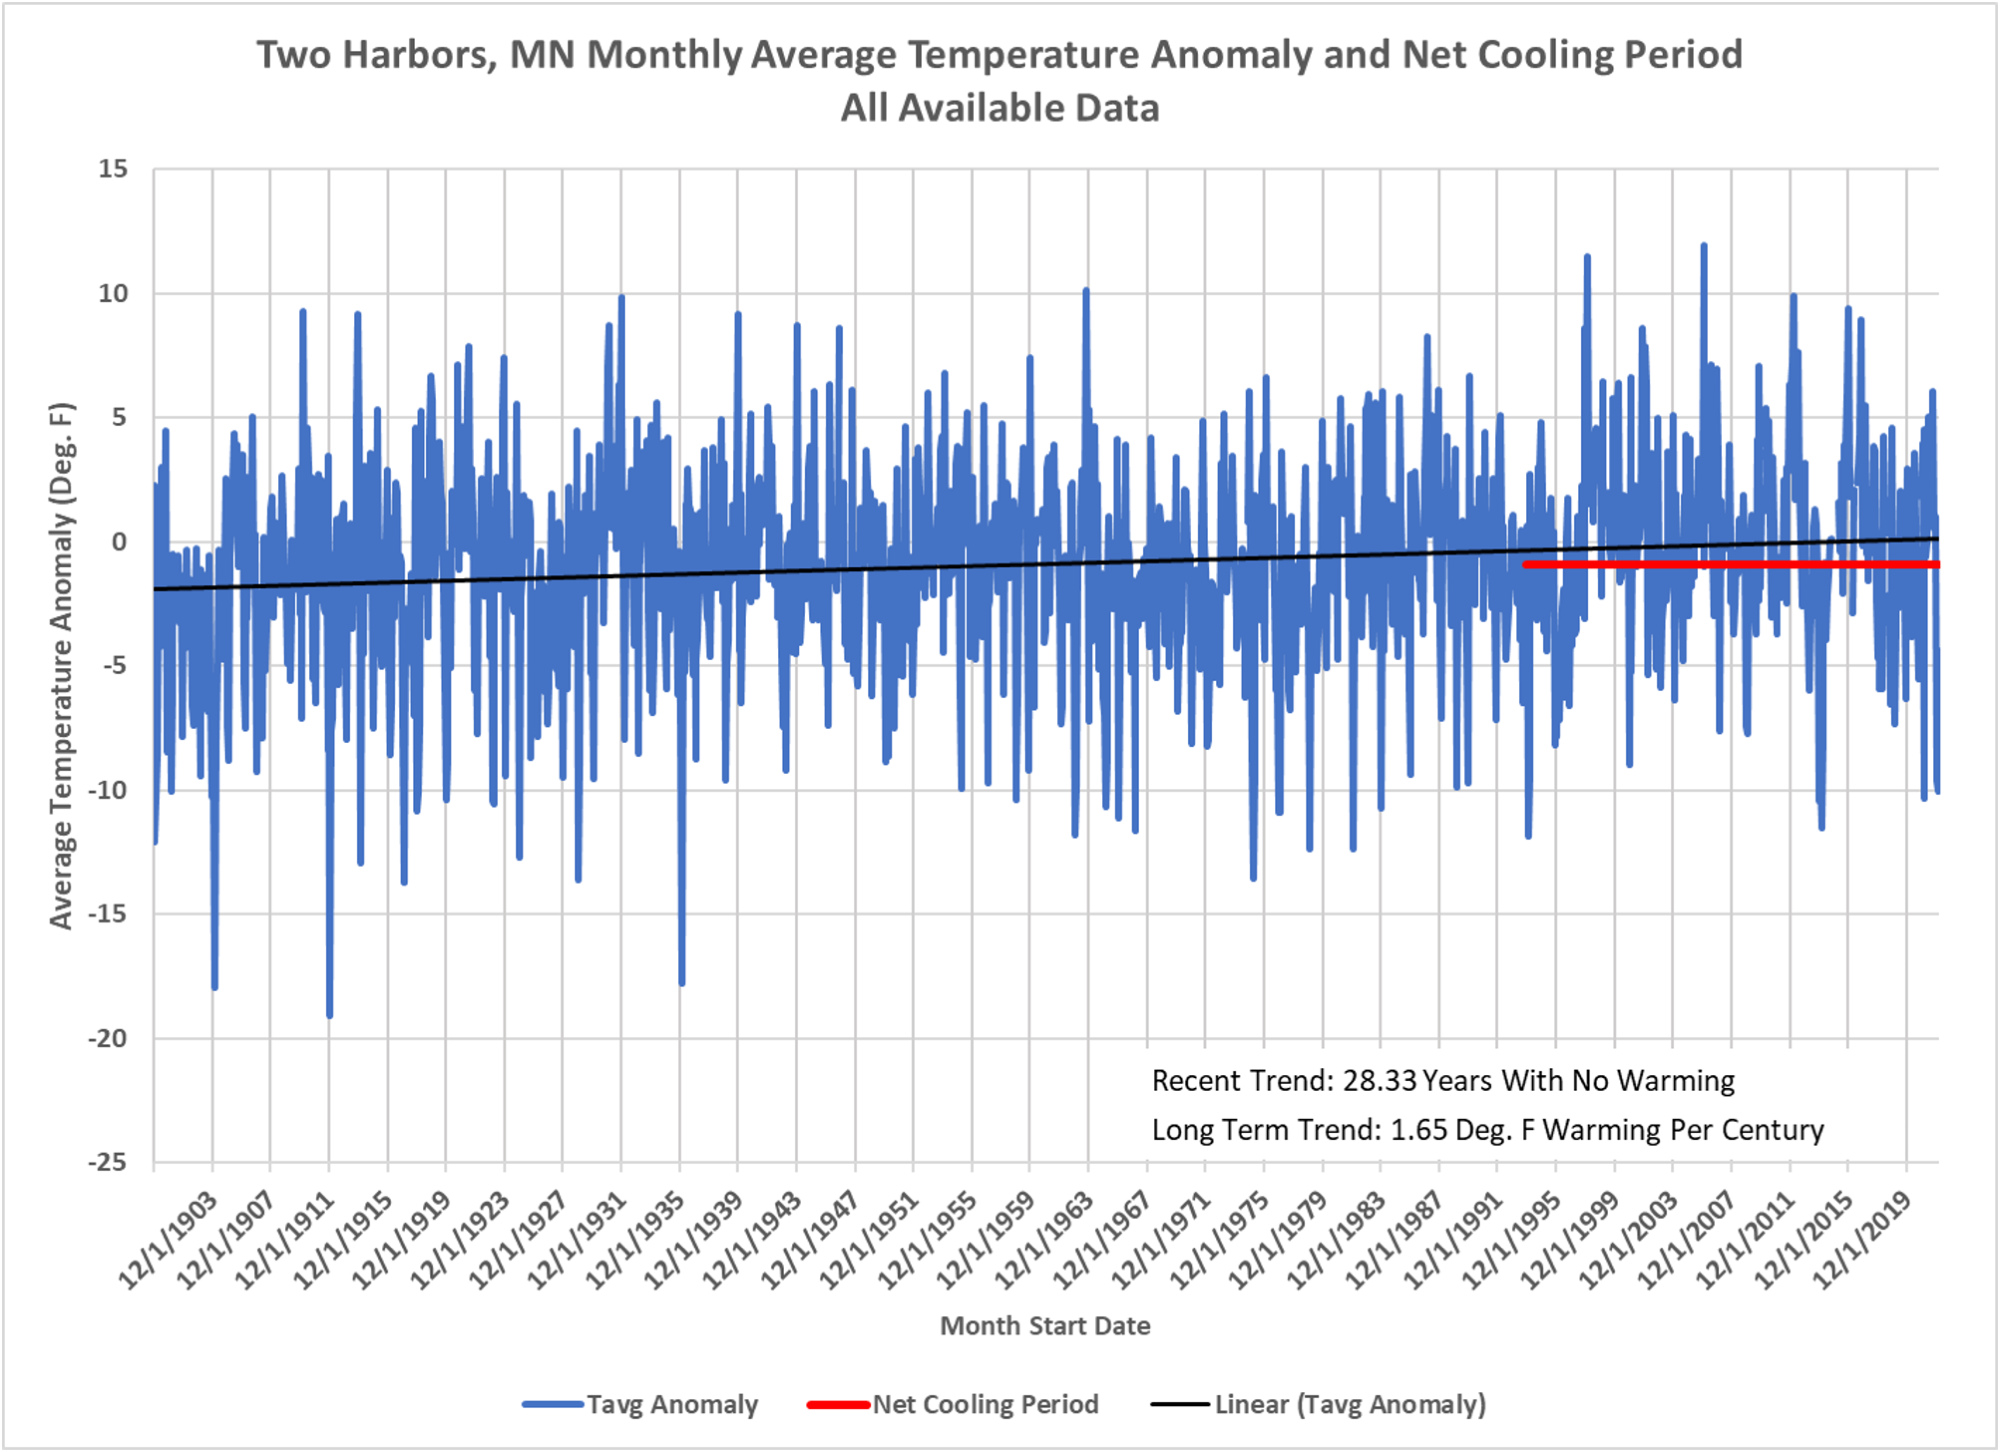
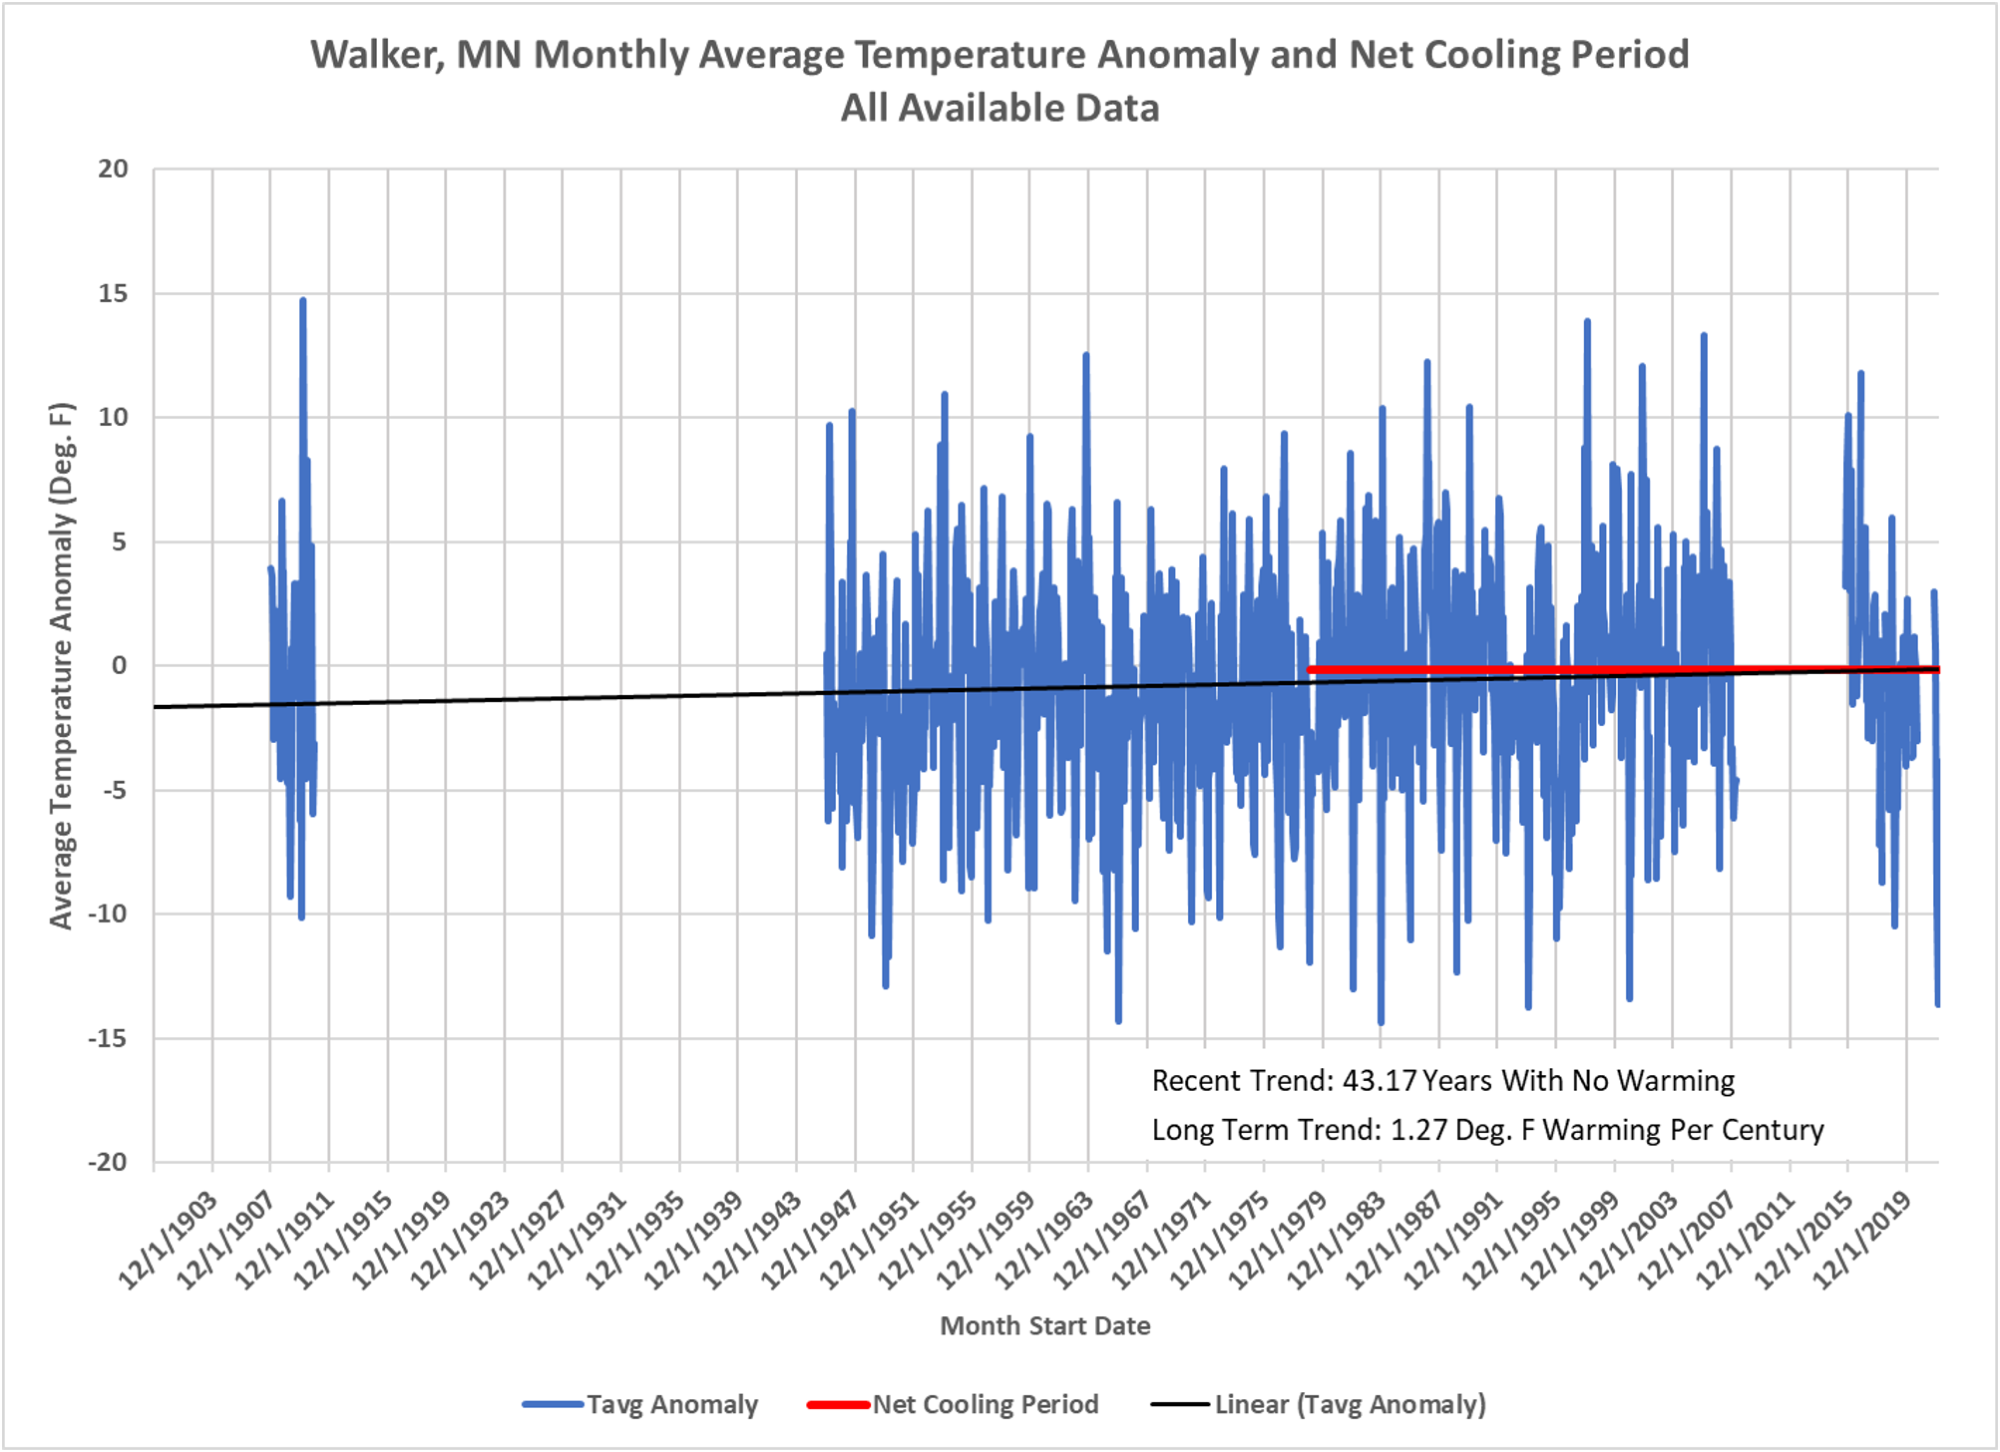
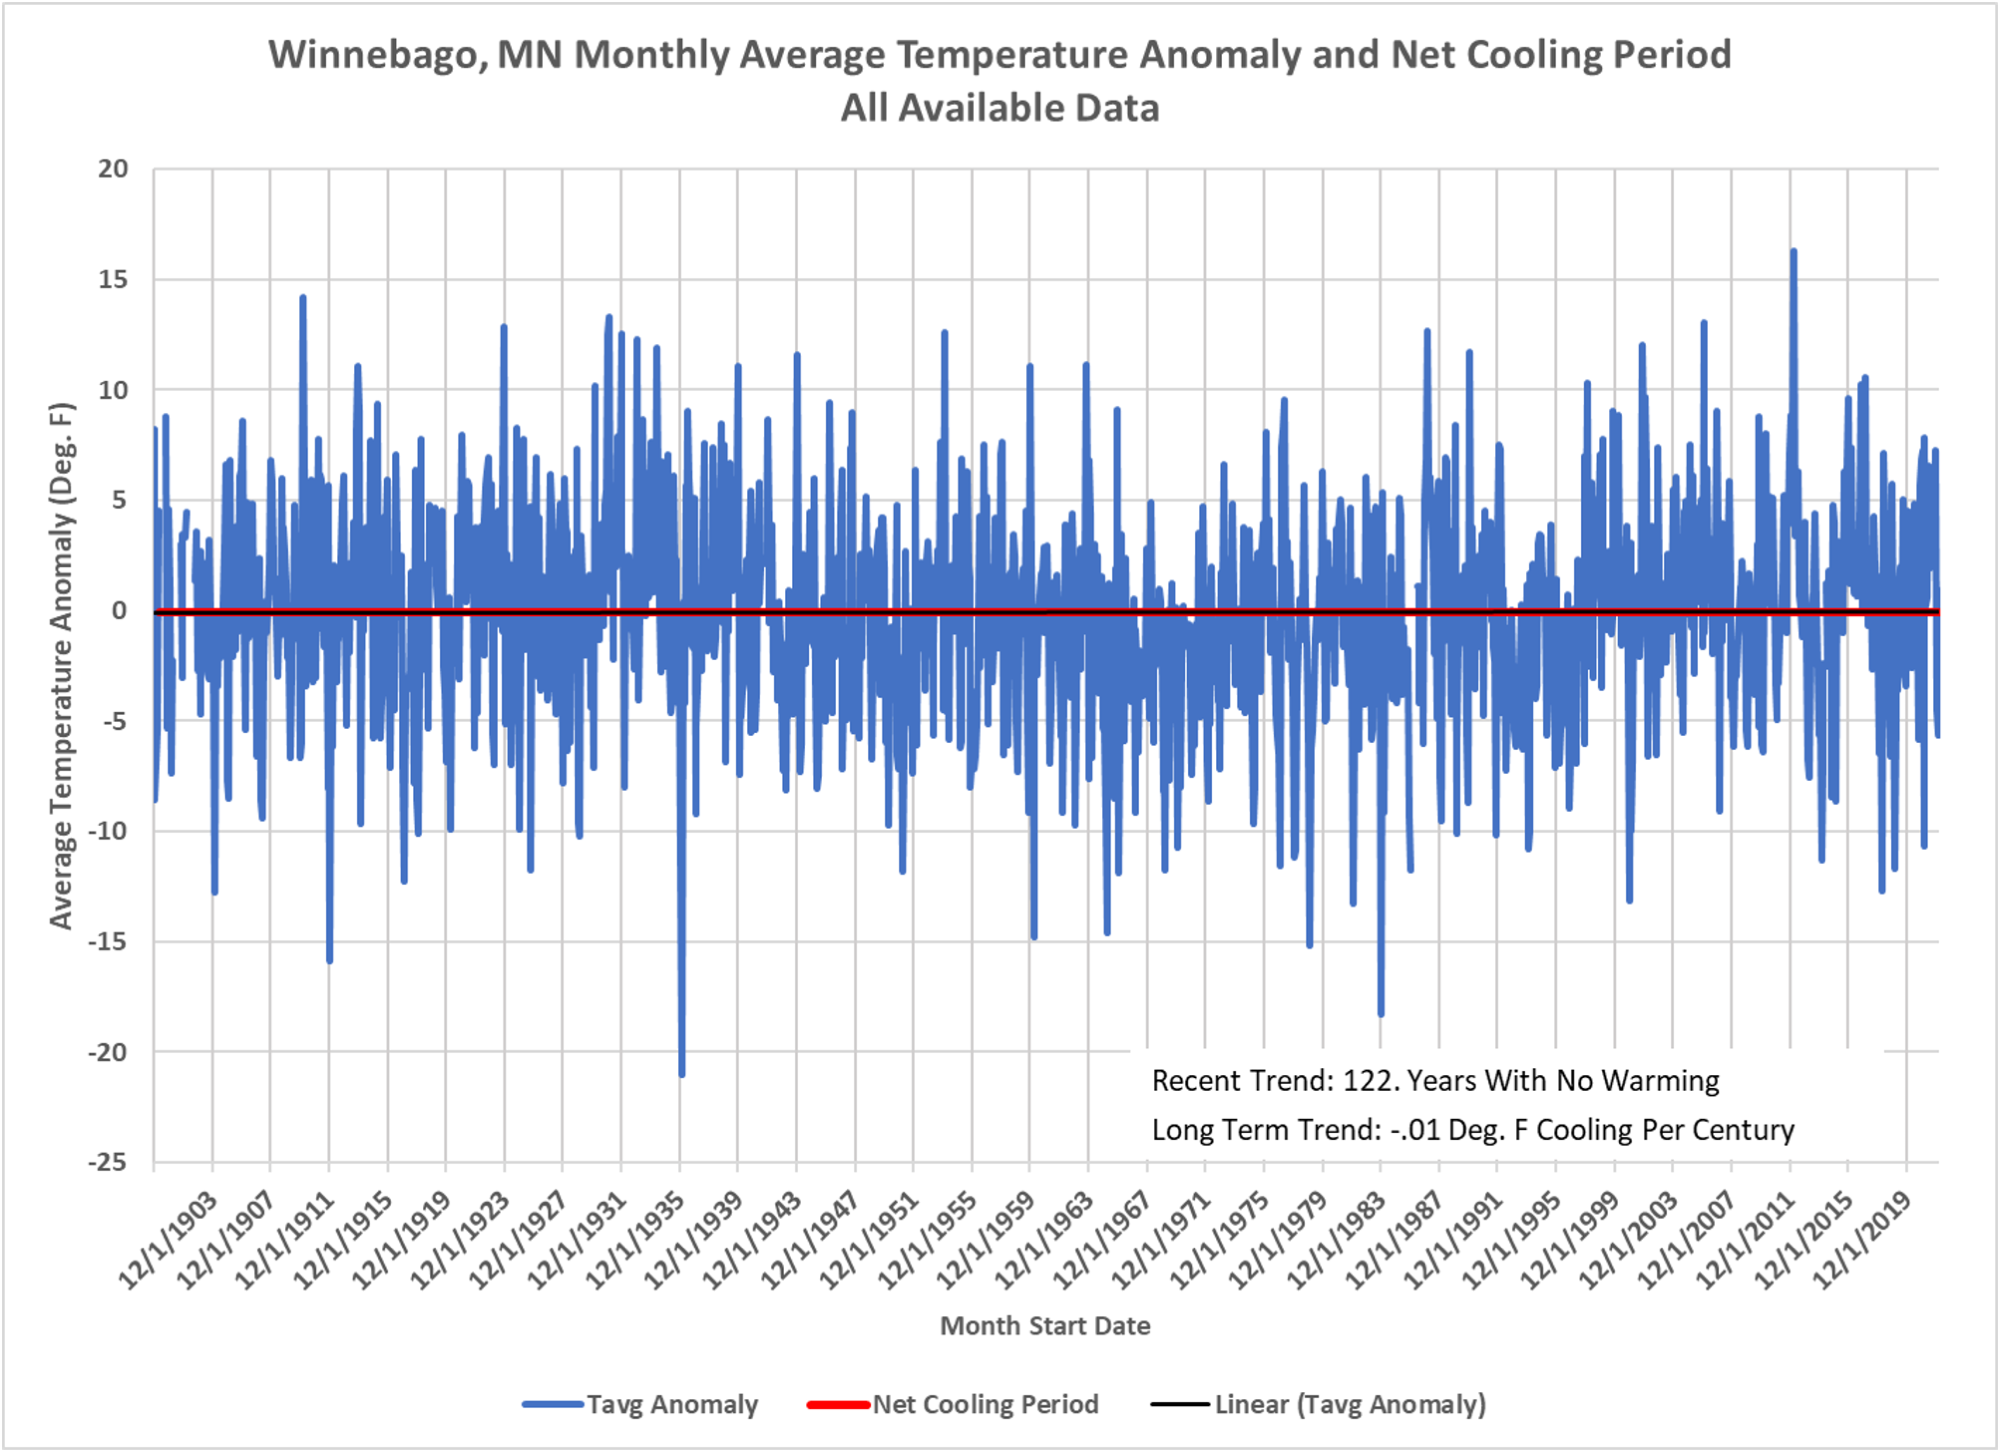
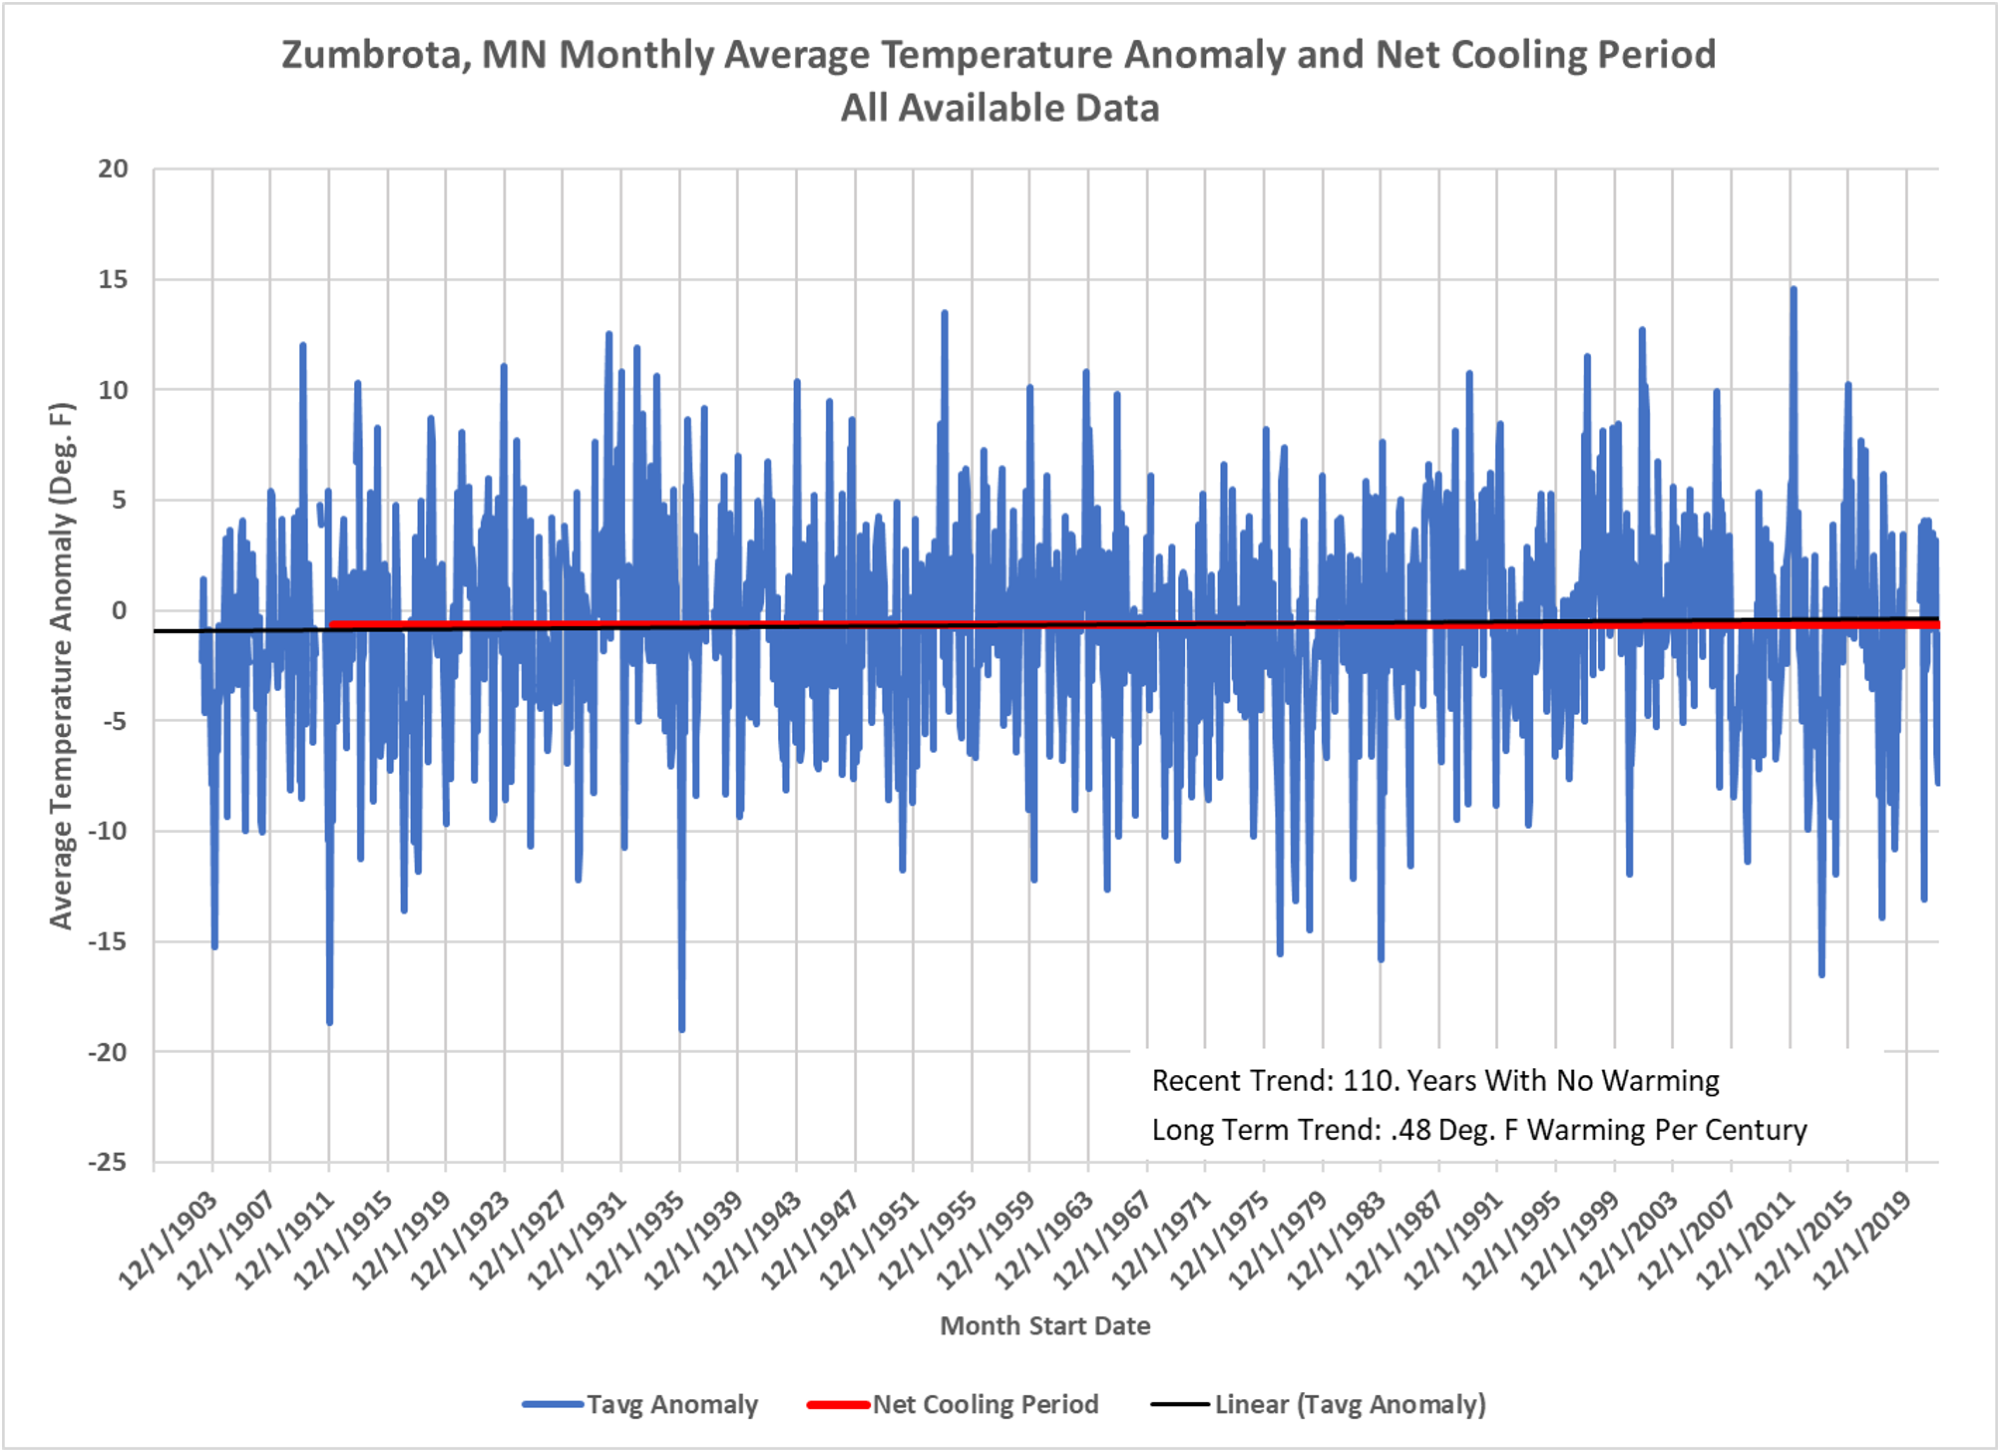
- After calculating the average temperatures for each month, a baseline for each month if determined by averaging each month from January, 1981 through December, 2010. The anomaly for each month is computed by subtracting the baseline monthly temperature from each month’s average temperature.
- The Net Cooling Period is calculated by evaluating how far back from the most recent month that a linear regression has a negative slope, indicating a cooling temperature trend. This is illustrated as the red line on the chart. The overall temperature trend is shown in black, using the built-in Excel linear trend function.
- Of the 18 sites evaluated so far, out of a total of 33 Minnesota USHCN sites, 9 have shown a long term warming trend of at least 1 Deg. F per century , and the remainder are warming at less than 1 Deg. F per century or are cooling.
