Another look at the trends year-over-year mostly shows what a low level of nothing is going on. But it is also interesting to note that the timing this year if there is a case bump is quite similar to 2020. Not sure if the weather this year has been more like 2020 than 2021, and how much that may explain the offset in spring bumps.
Dave’s notes:
- Previous versions of this set of charts displayed average number of Covid tests per day as Fig. 1. Since MDH stopped reporting the number of Covid tests recently we have deleted the testing chart.
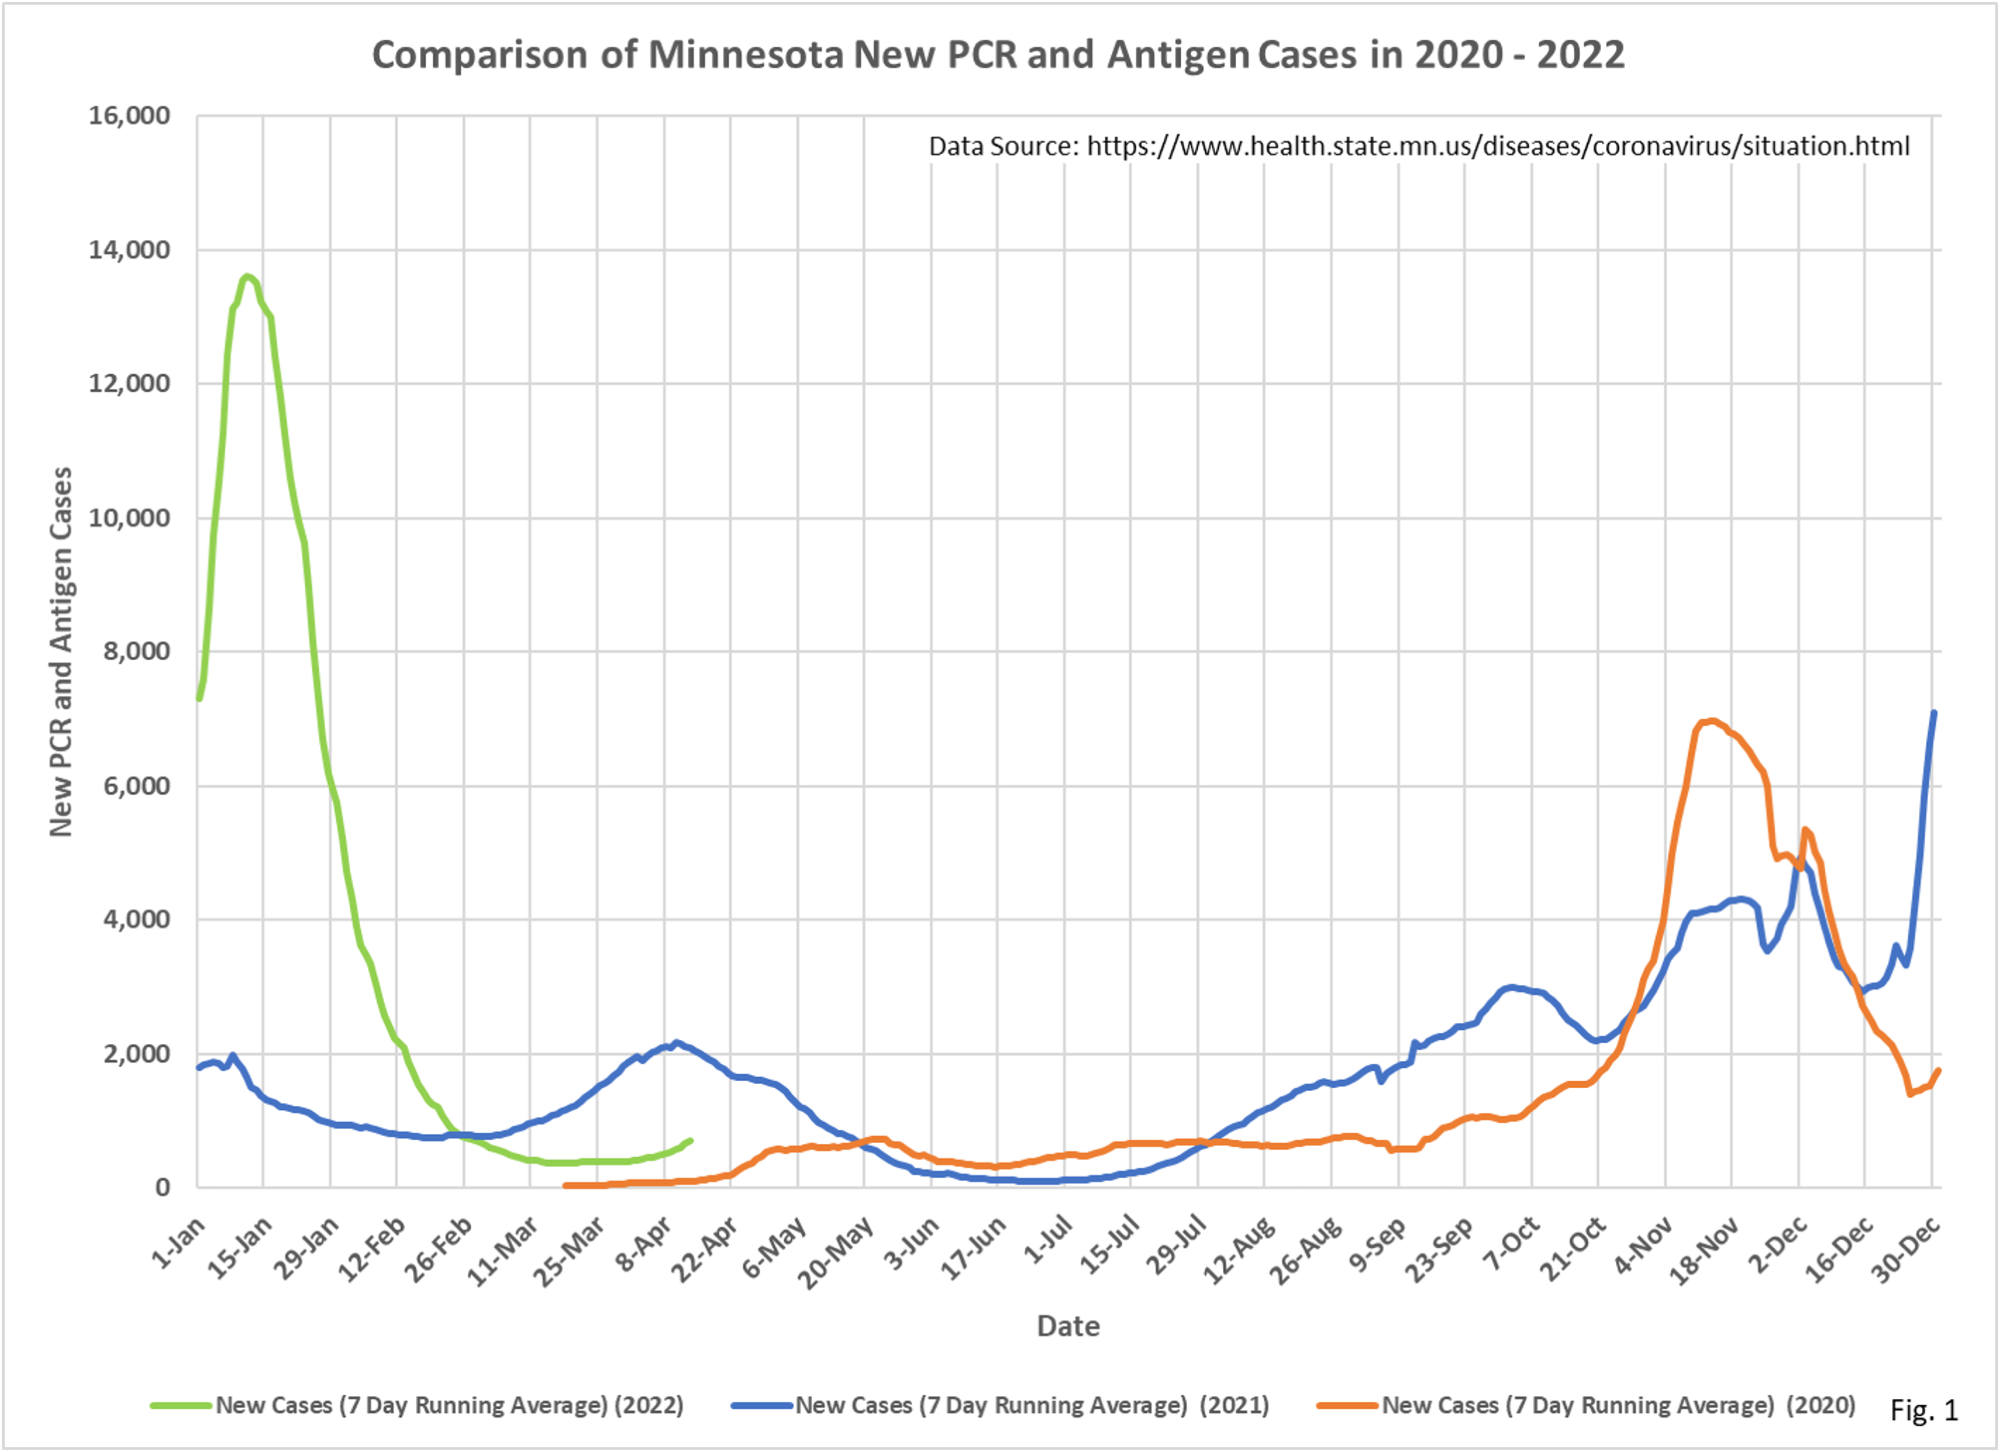
- Fig. 1: New daily cases per day bottomed out at 373 average cases per day on 3/20/2022. Daily cases have now risen to 710 cases on 4/14/2022 on the most recent date displayed (continuing our policy of not displaying the most recent 7 days due to incomplete reporting by MDH).
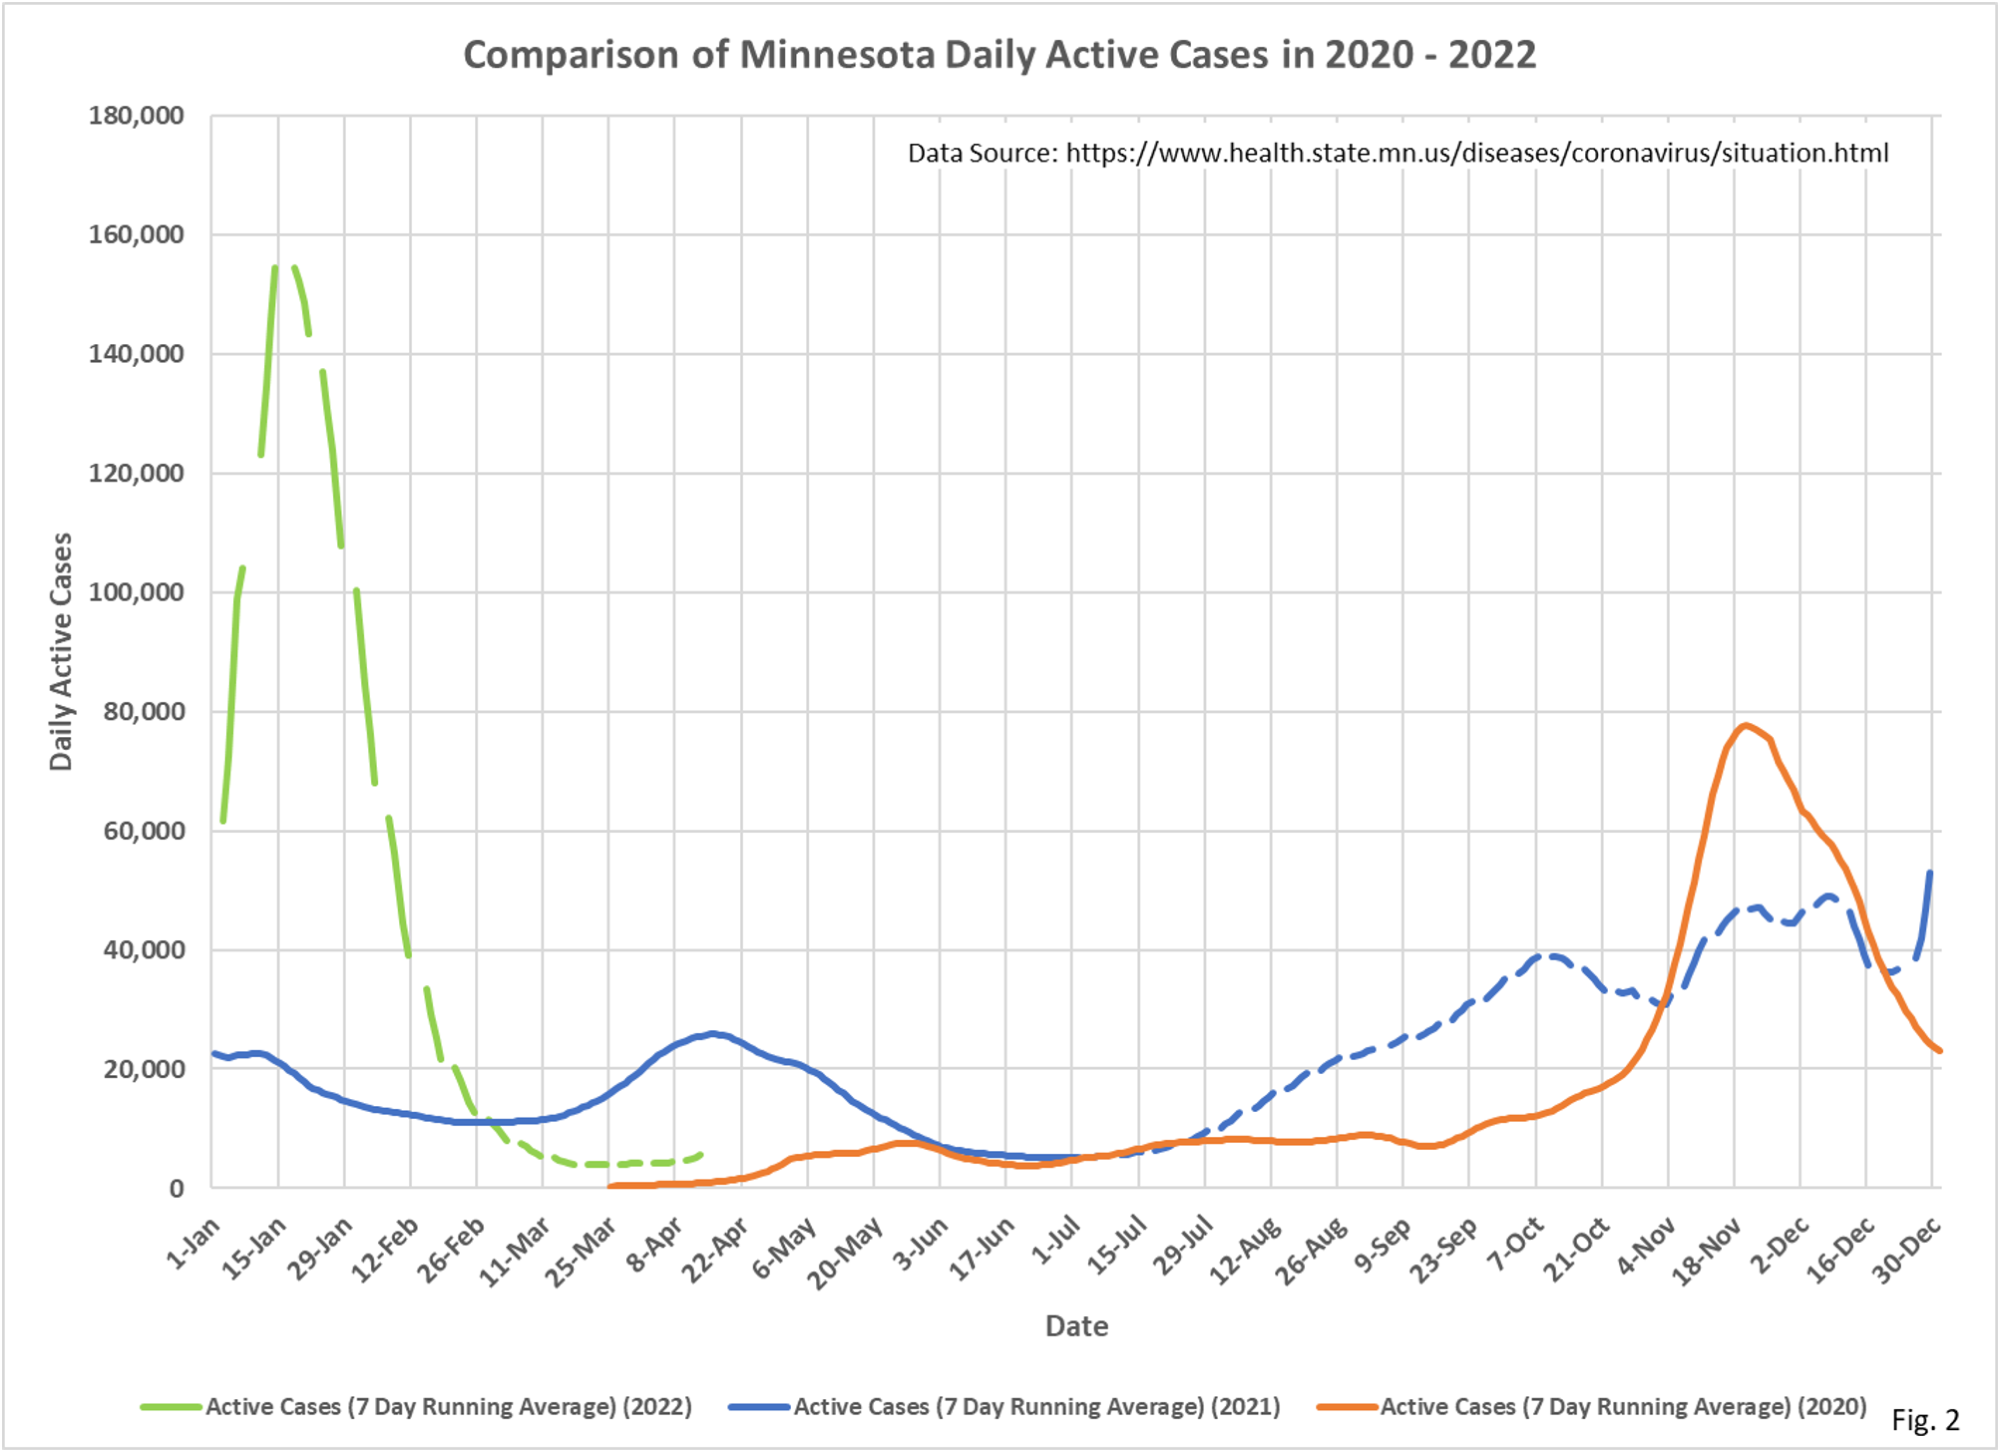
- Fig. 2: Active cases bottomed out at 3,919 cases on 3/24/2022, and have since risen to 5,655 cases on 4/14/2022.
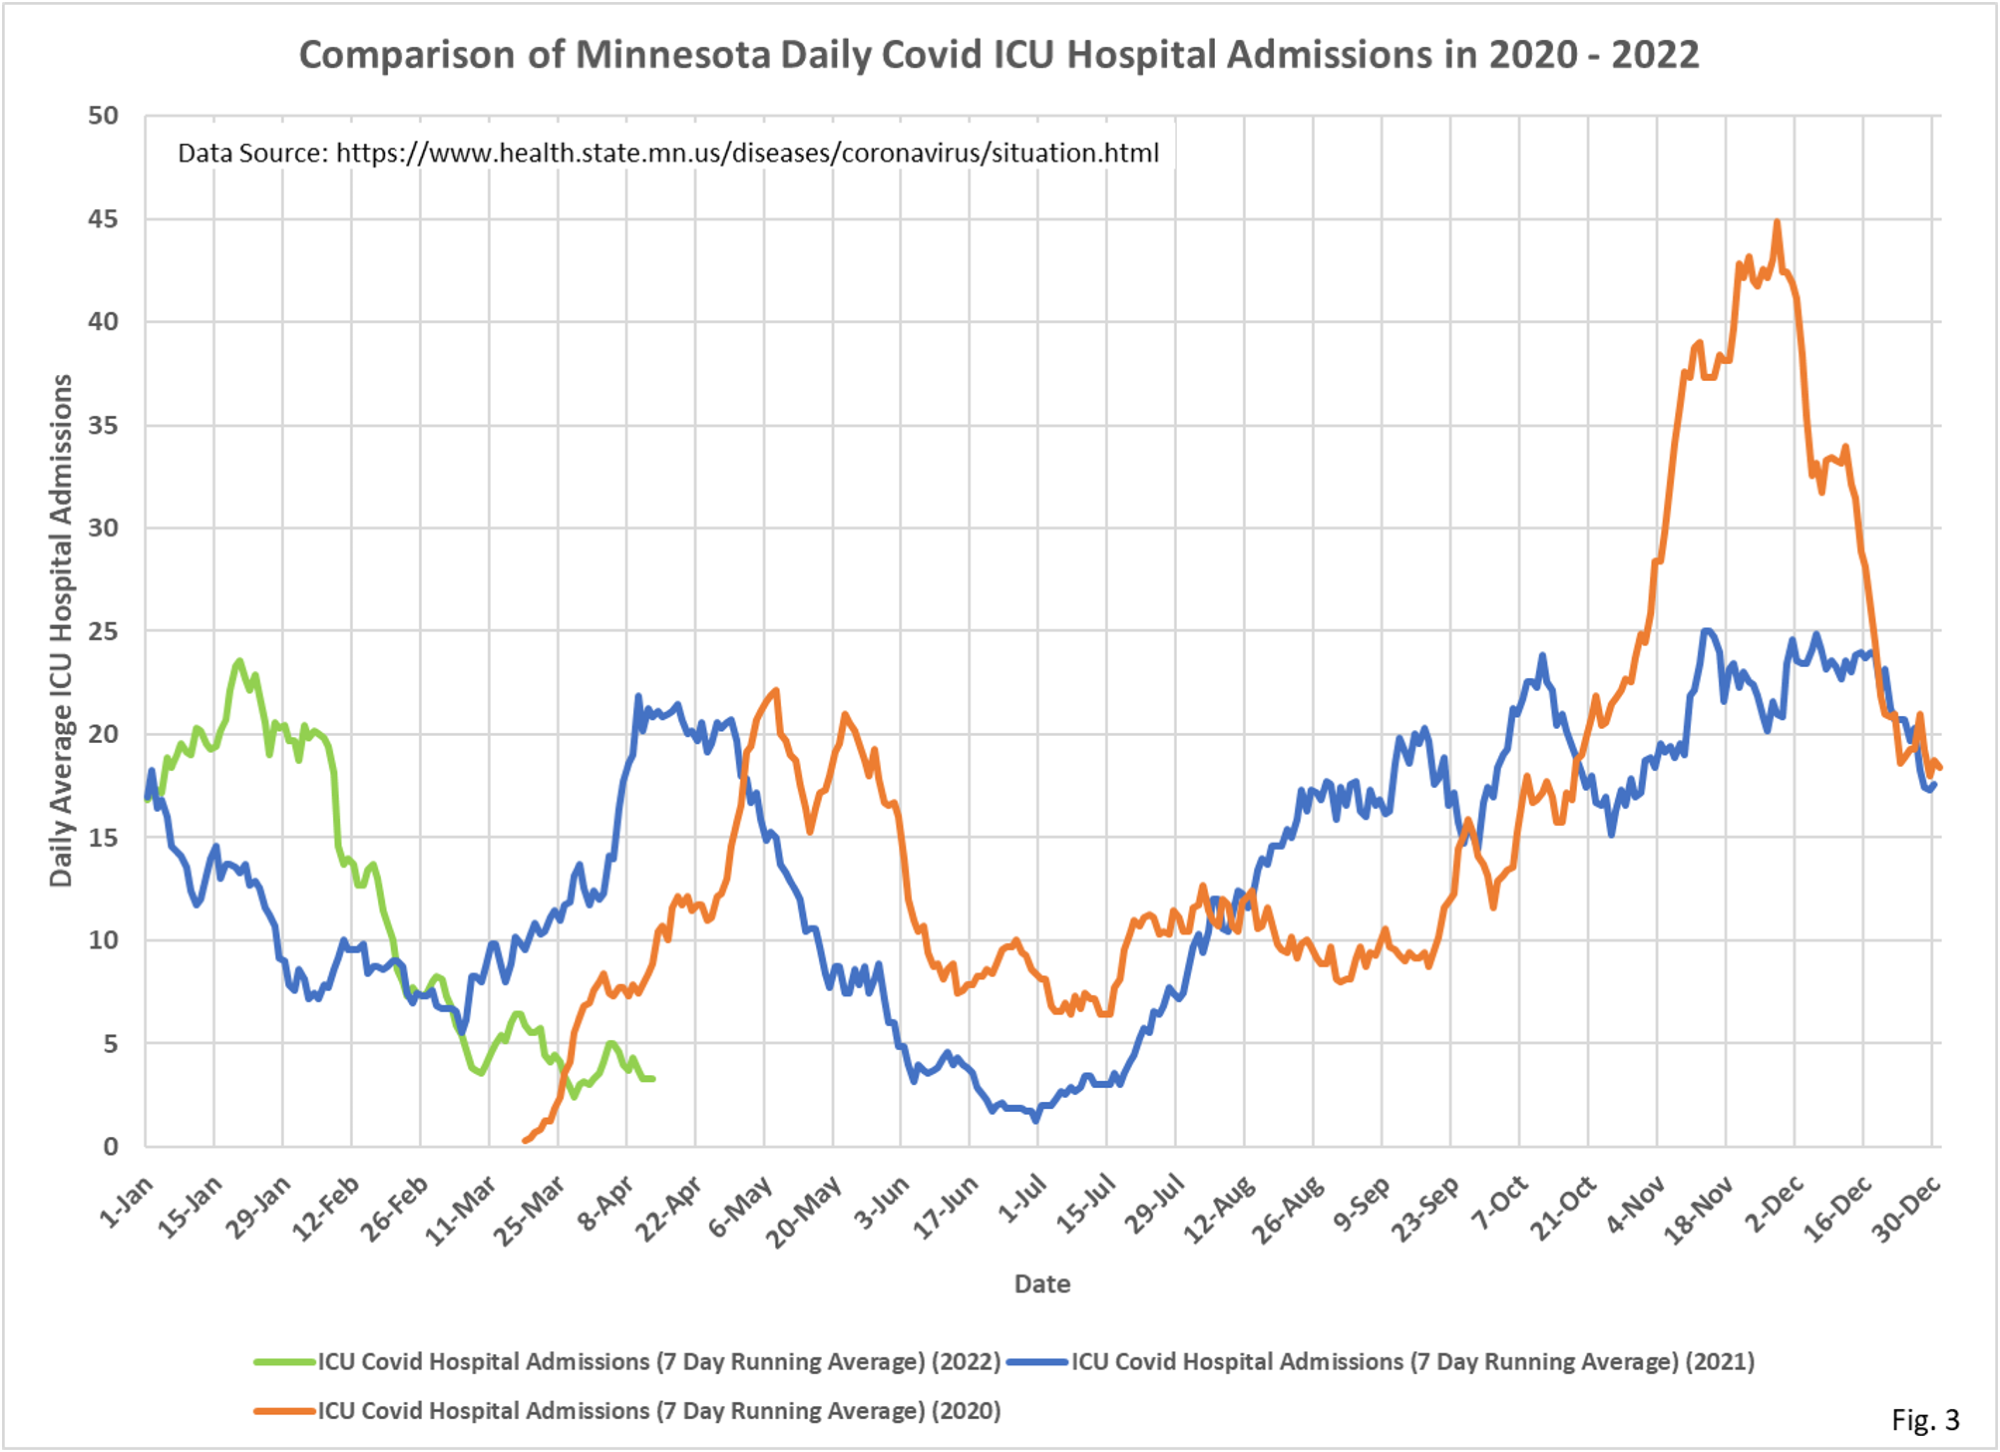
- Fig. 3: Covid ICU admissions reached a low of 2.4 average admissions per day on 3/29/2022, and have been higher since then, although more variable than new daily cases.
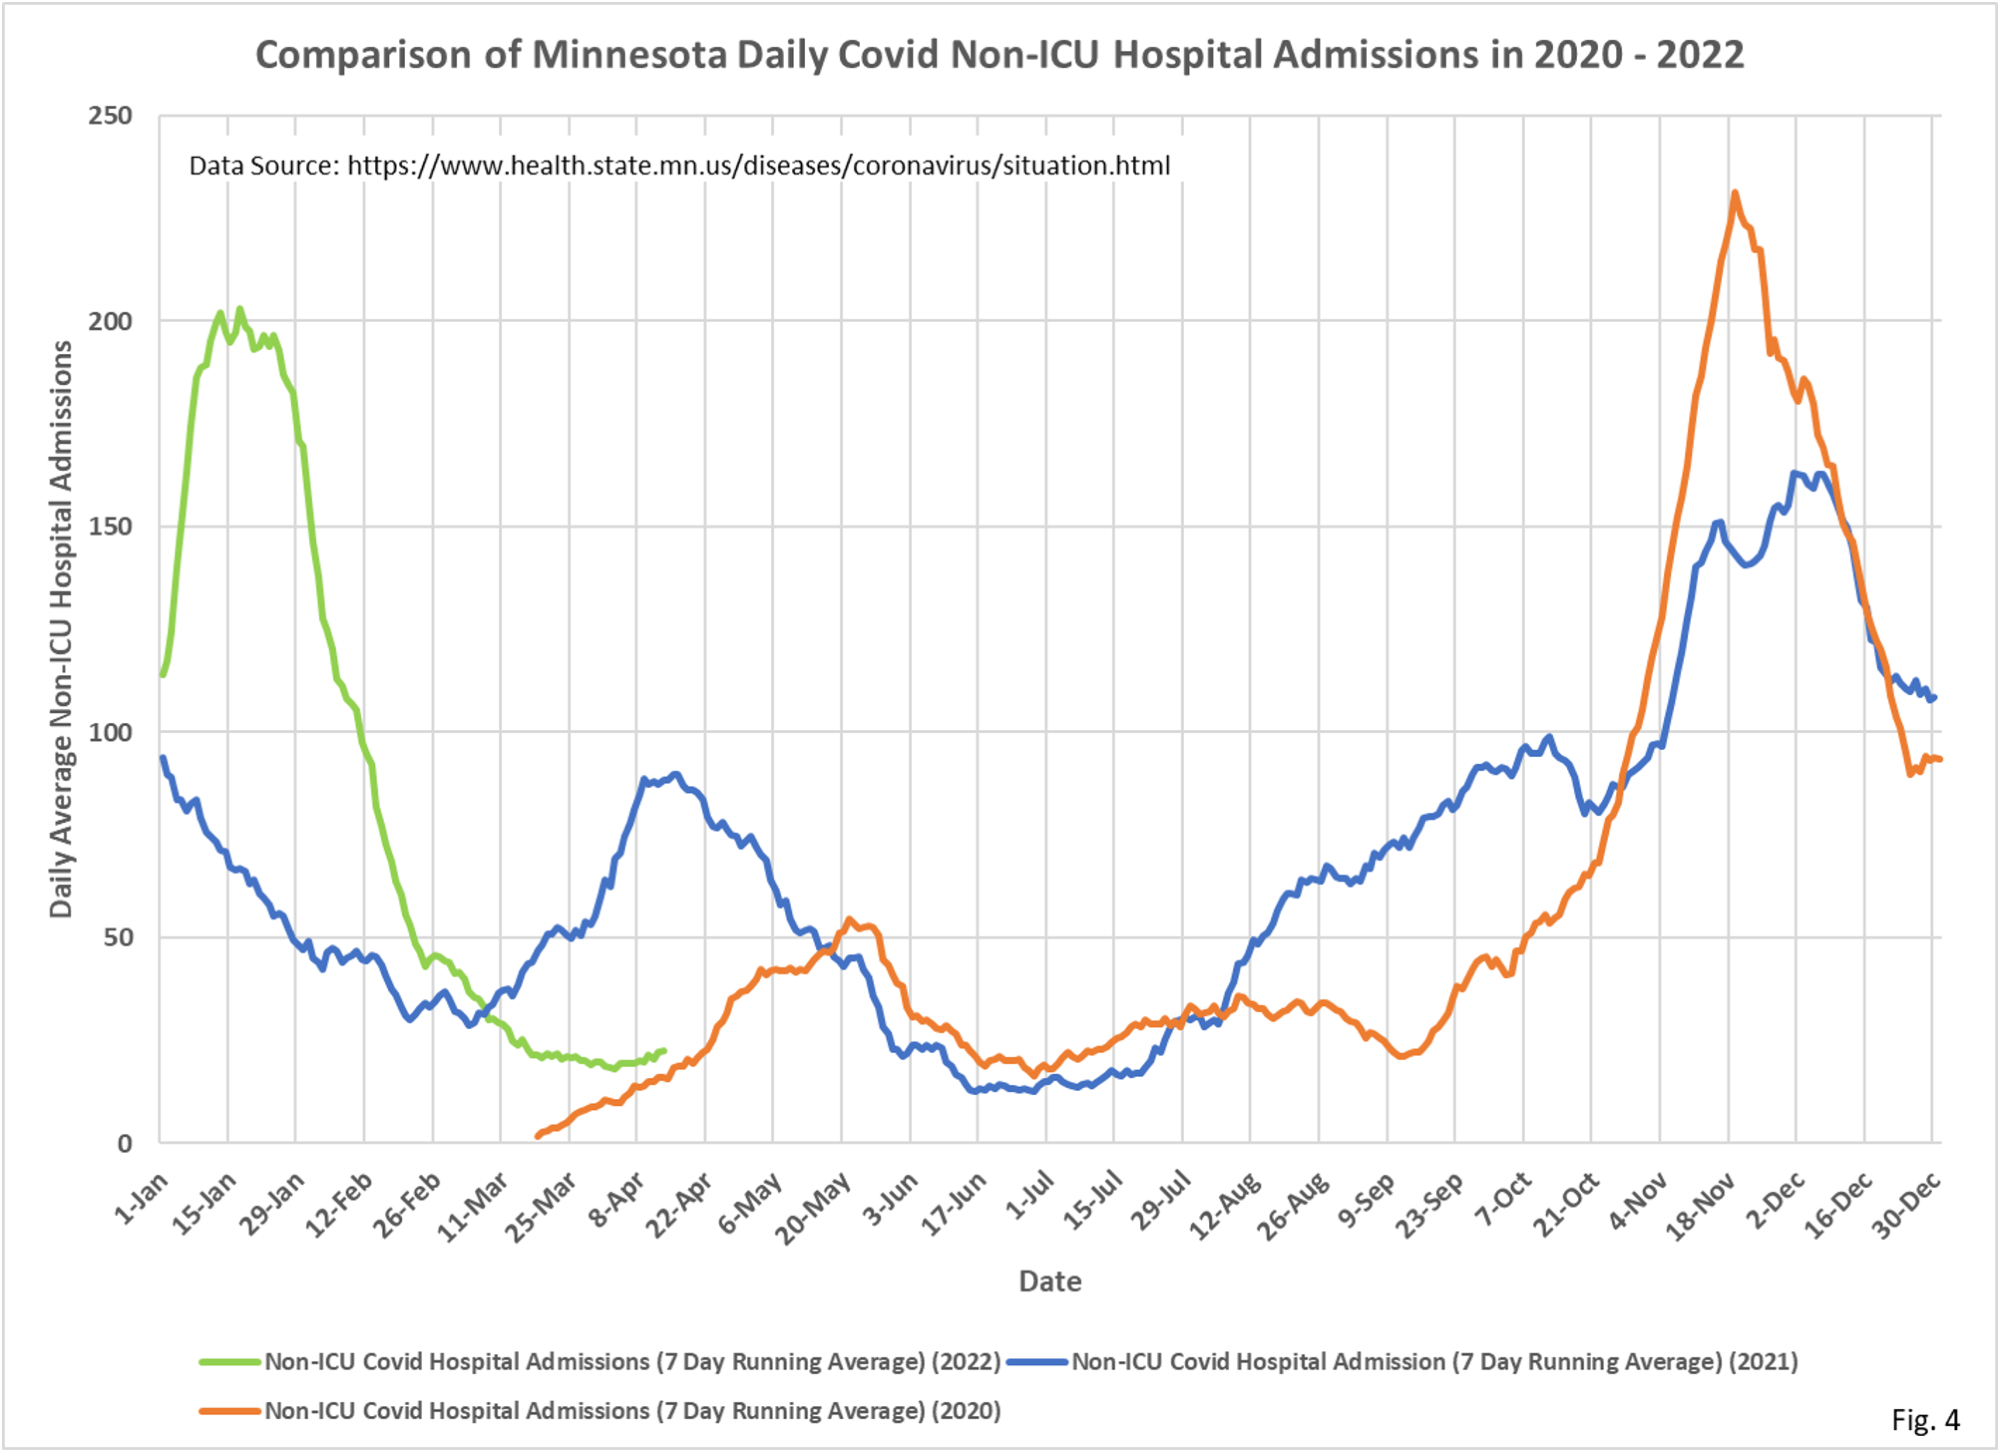
- Fig. 4: Covid Non-ICU admissions were at a minimum of 18.0 admissions per day on 4/4/2022, and most recently are at 22.4 admissions per day on 4/21/2022.
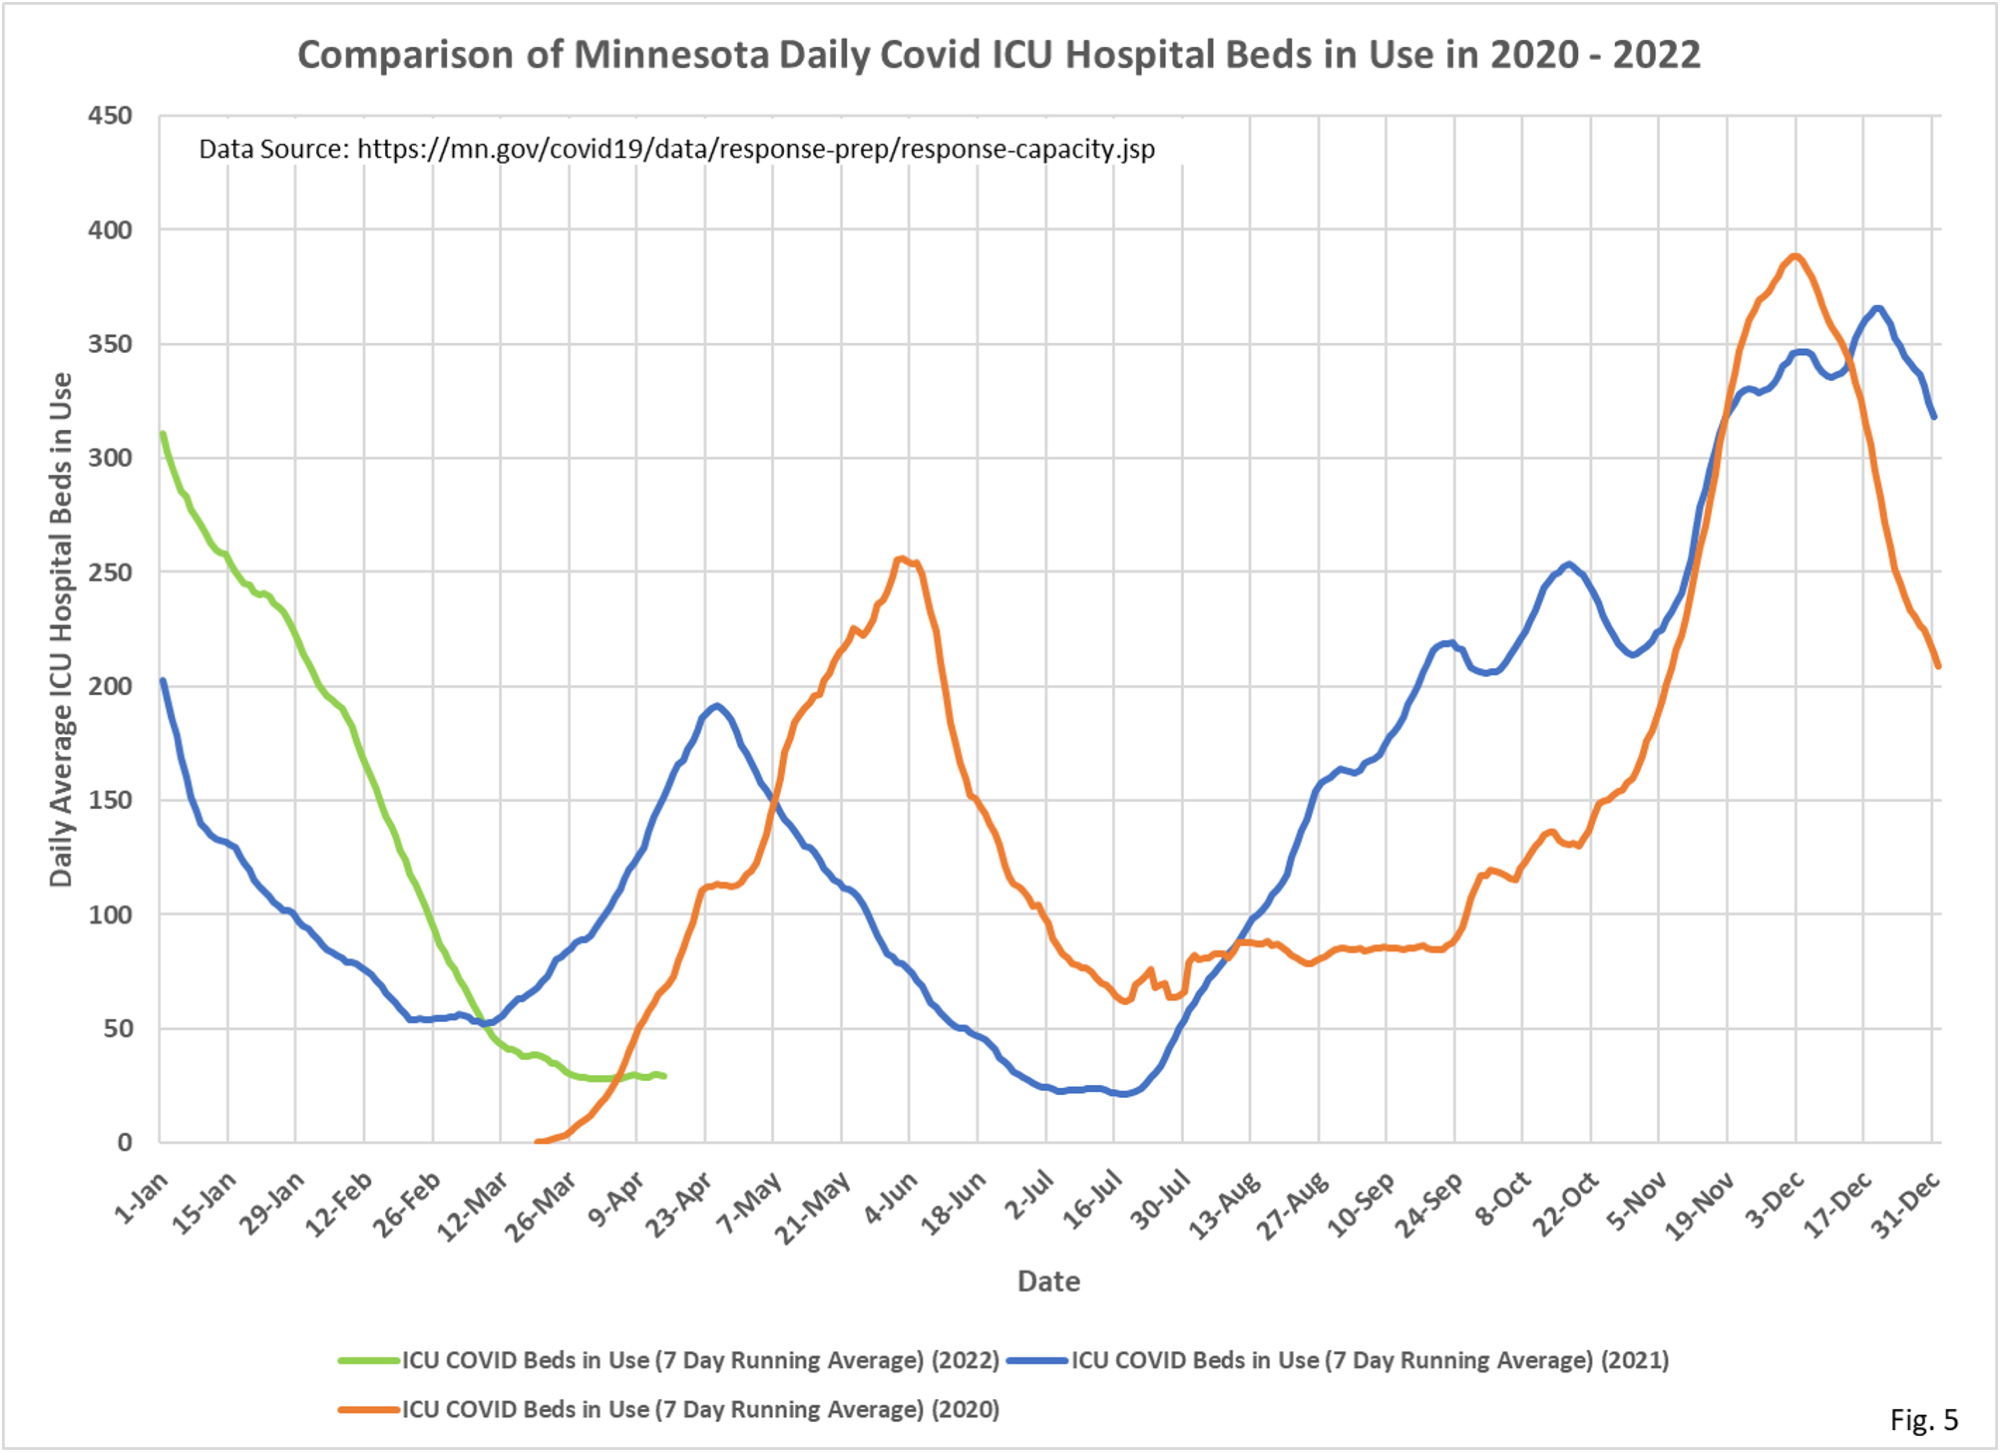
- Fig. 5: ICU Covid hospital bed in use are much more stable, compared to ICU admissions per day in Fig. 4. There have been between 28 and 30 ICU beds in use every day since 3/27/2022.
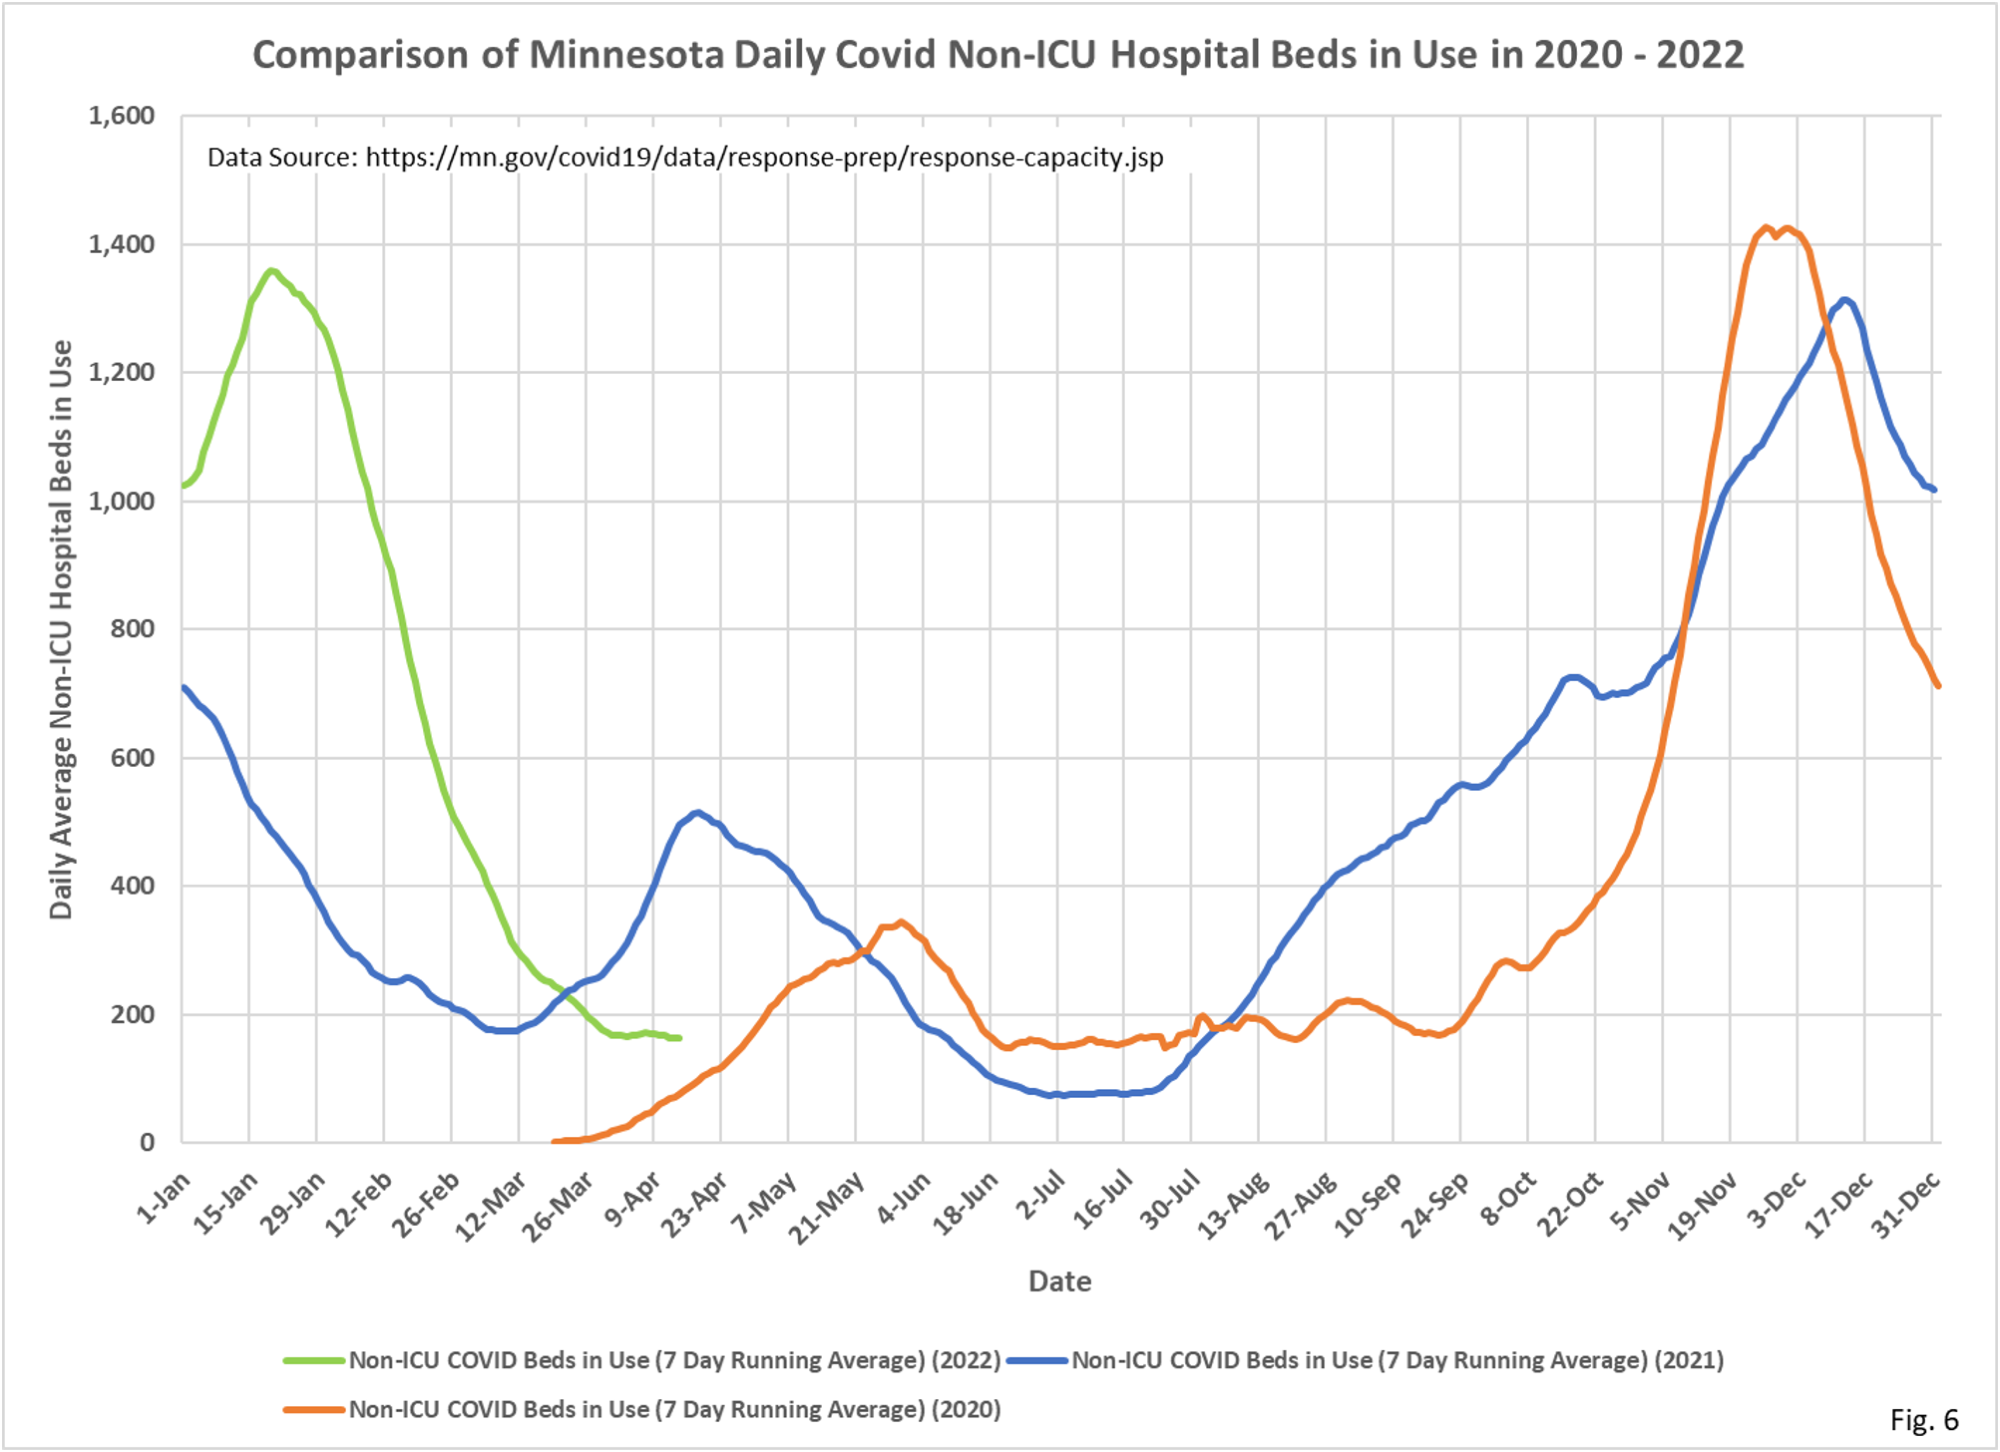
- Fig. 6: Non-ICU Covid hospital beds in use continue to fall, despite the minor uptick in daily average admissions in Fig. 4.
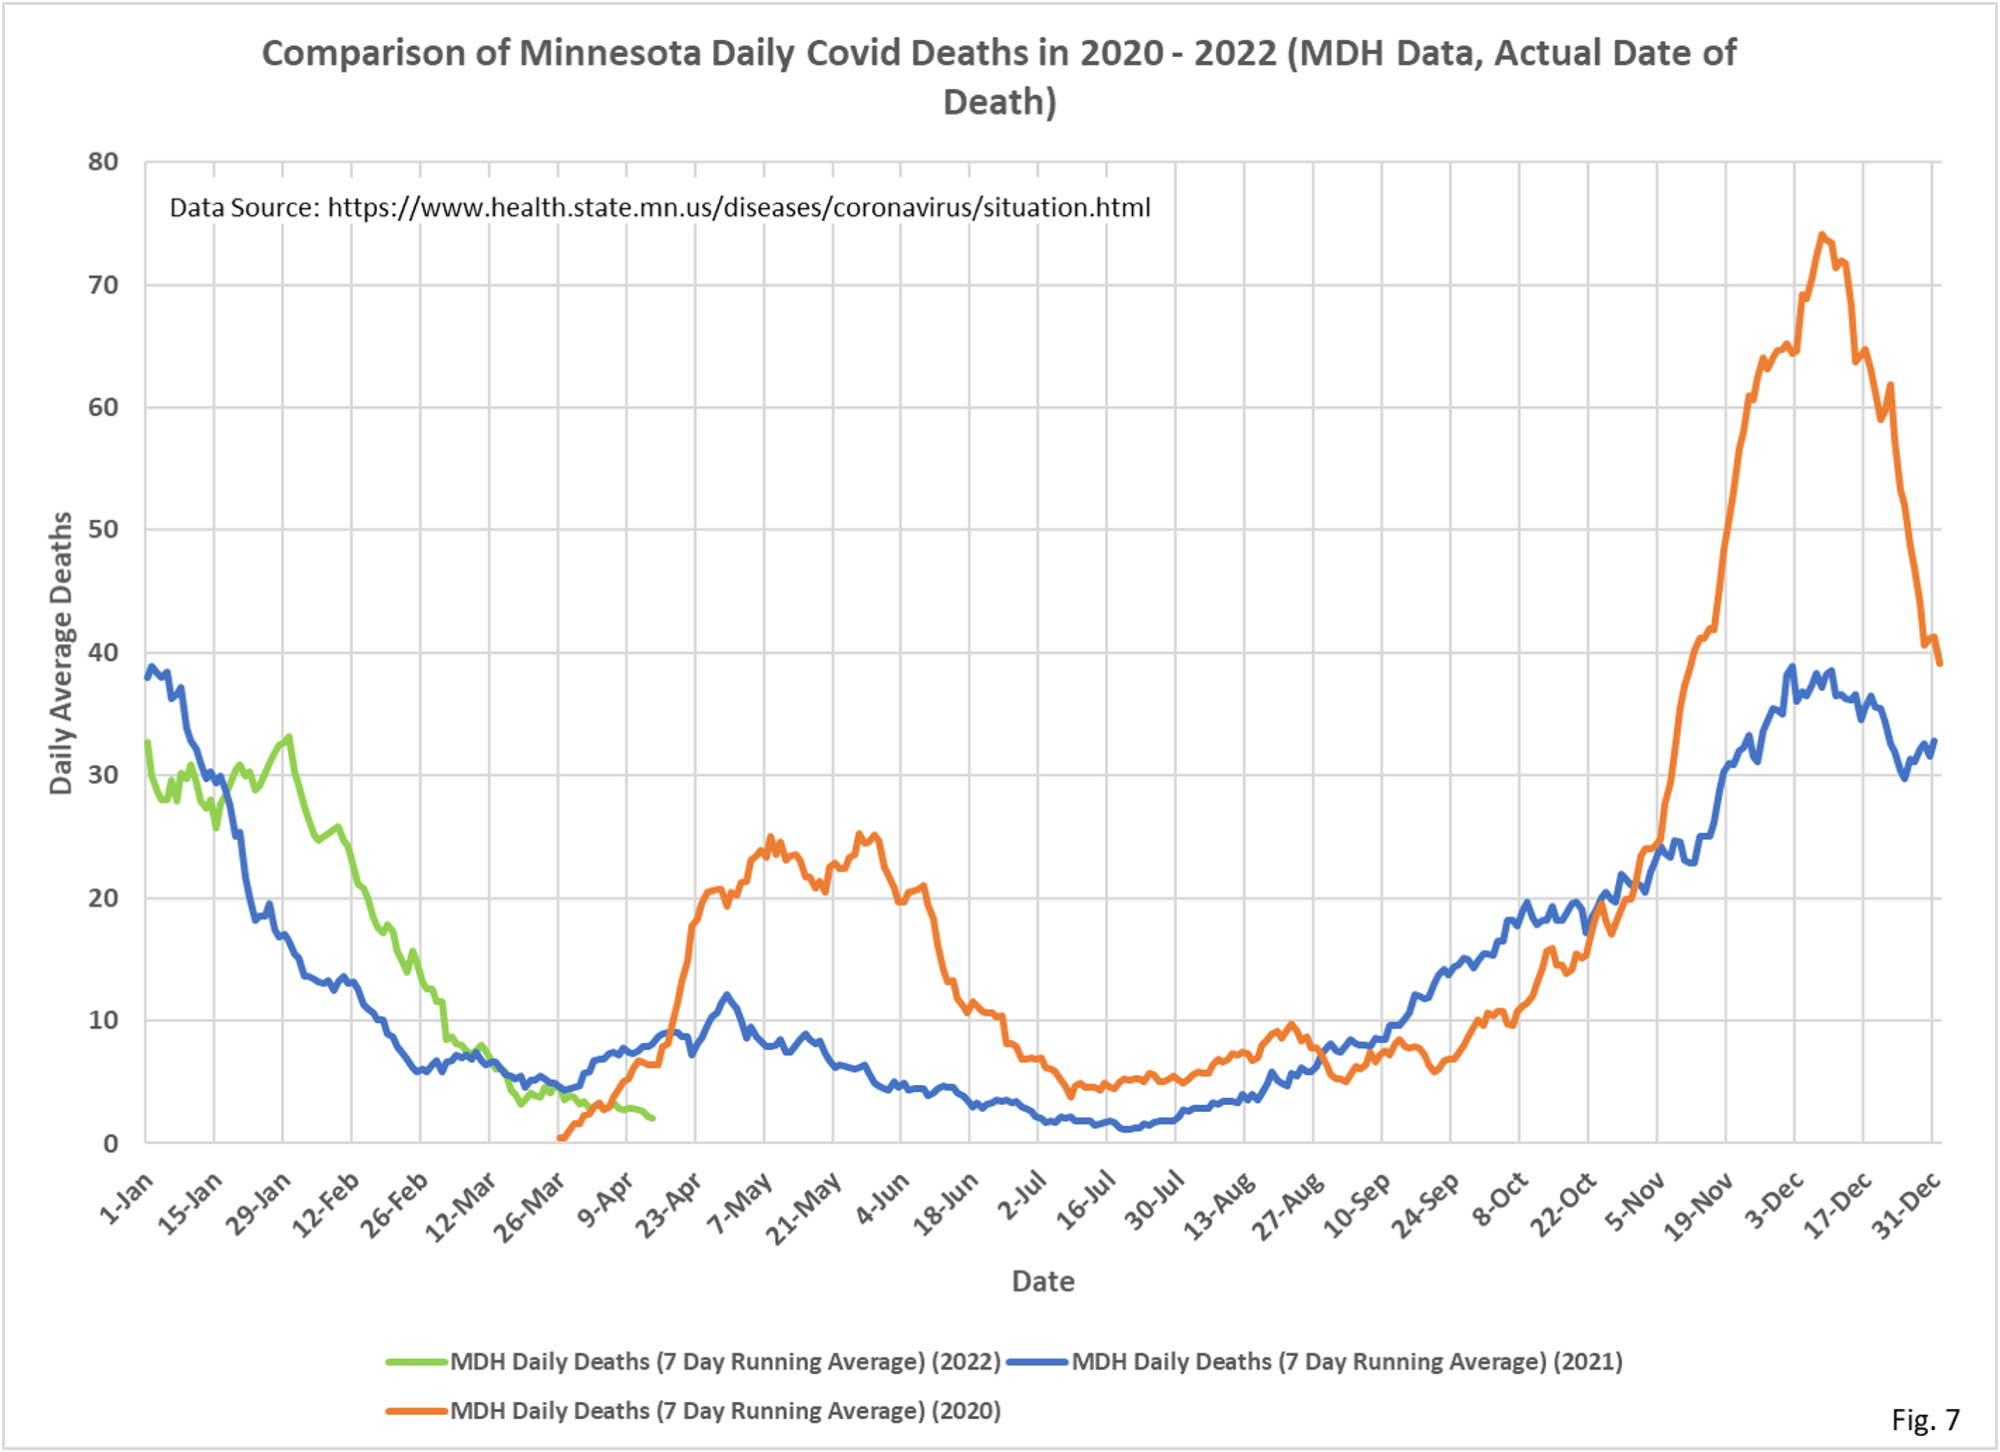
- Fig. 7: Deaths attributed to Covid continue to fall, despite the recent increase in cases. The chart omits the last 14 days of data due to incomplete reporting, but it is likely there are deaths more than 14 days ago that have yet to be reported. There were an average of 2.9 Covid deaths er day on 4/7/2022, the most recent date displayed.
- For all charts the last 7 days of data is excluded to avoid charting incomplete data. For the deaths chart data from the last 14 days is excluded.
- All data is taken from the Minnesota Department of Health Situation Update for OCVID-19 web page https://www.health.state.mn.
us/diseases/coronavirus/ situation.html and from the Response and Preparation web page https://mn.gov/covid19/data/ response-prep/response- capacity.jsp. - All data is shown as 7 day running averages.
