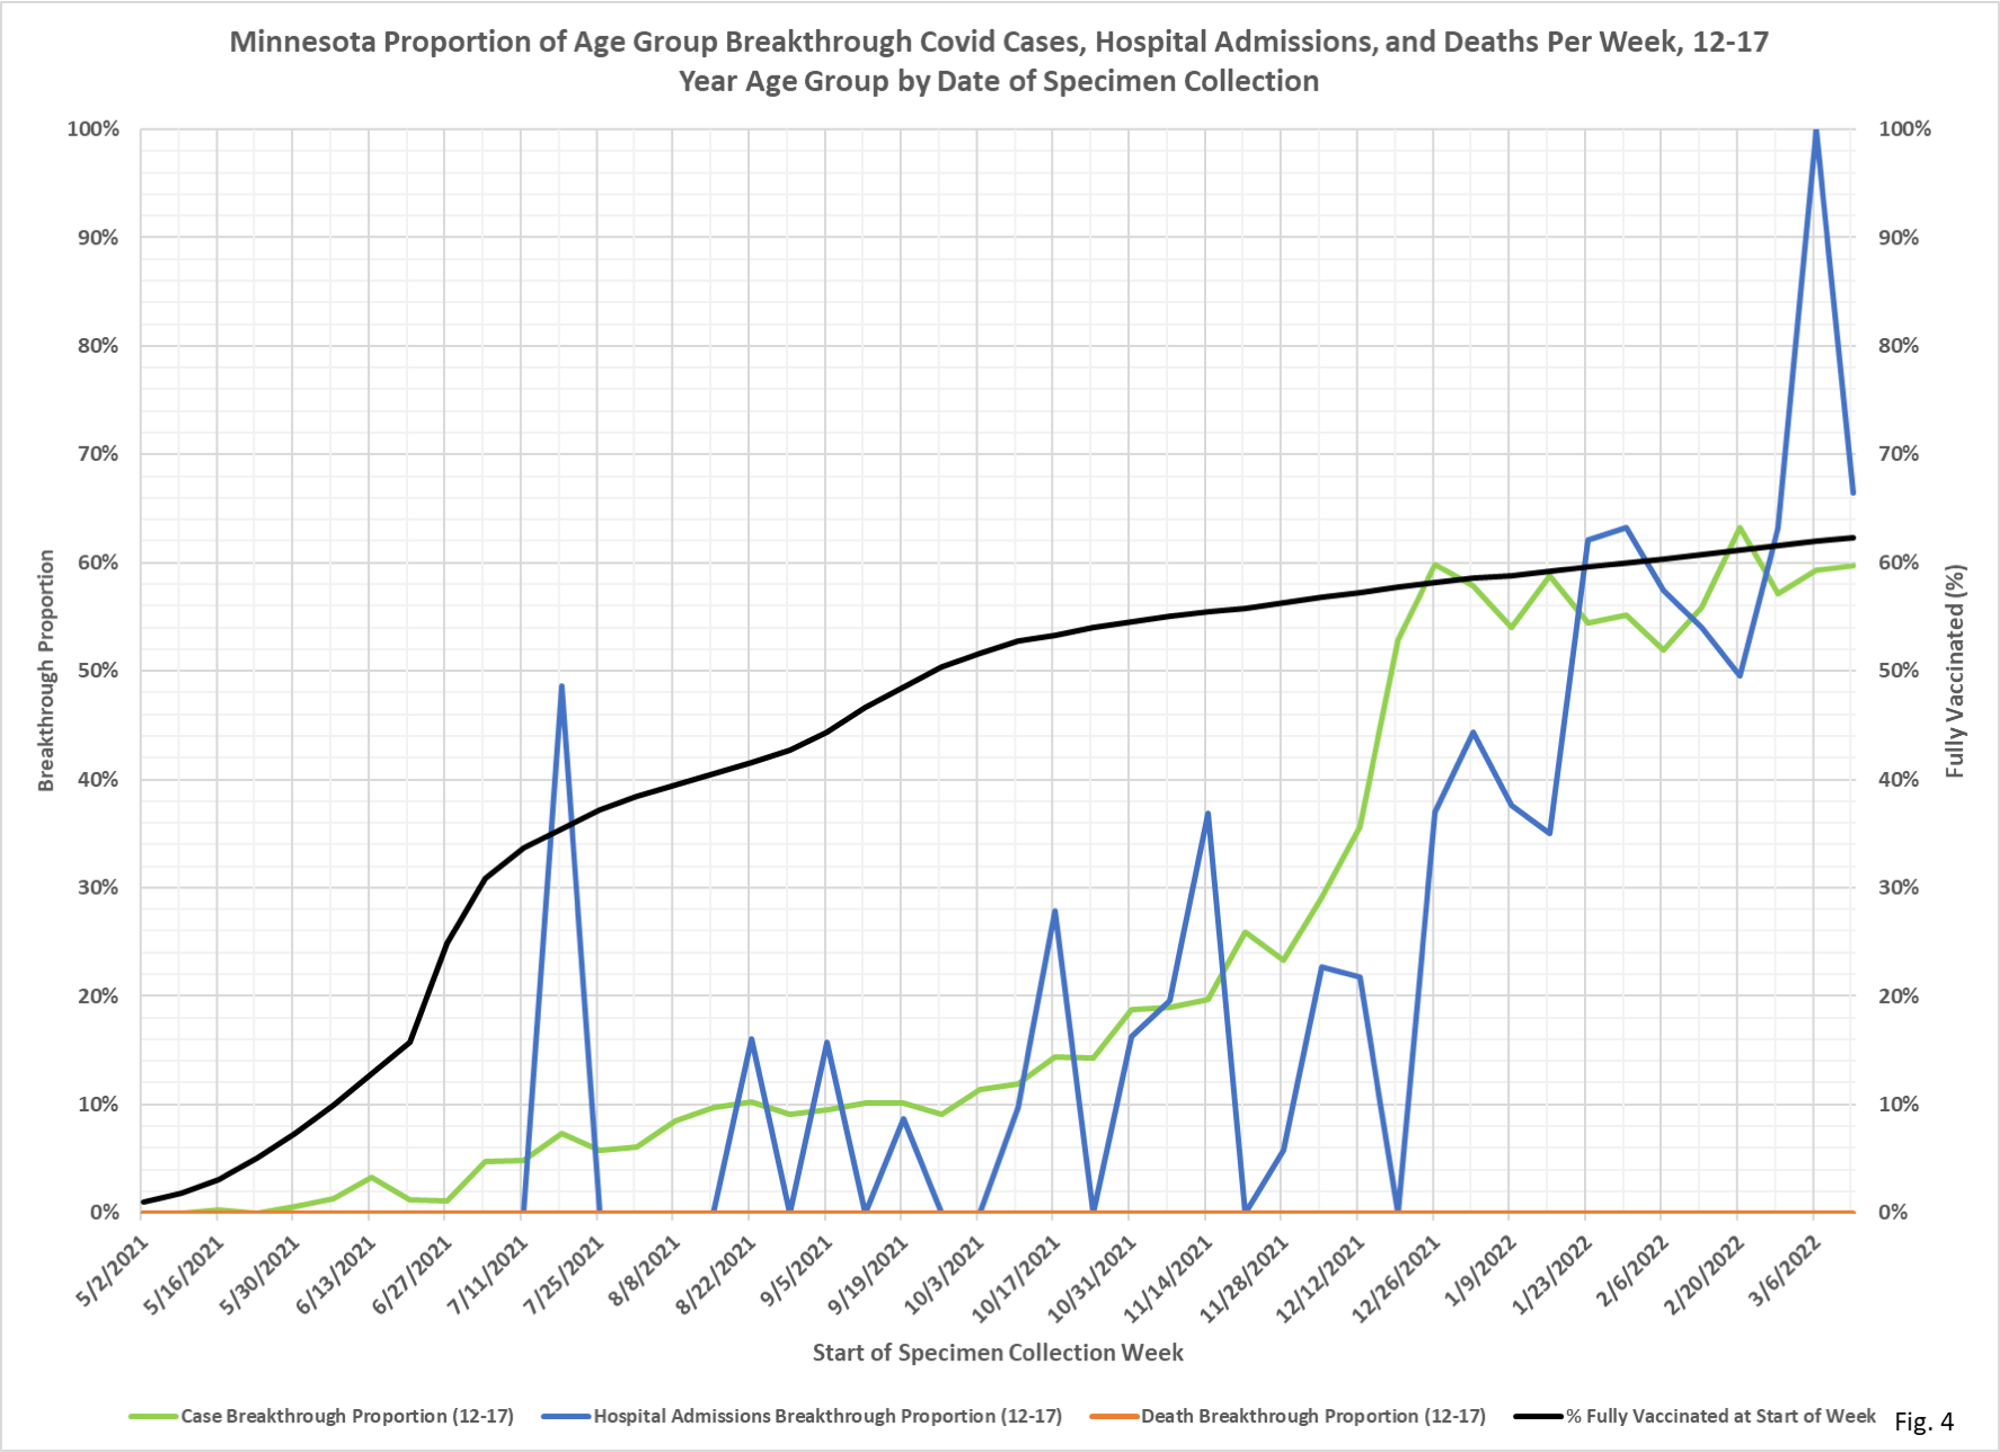
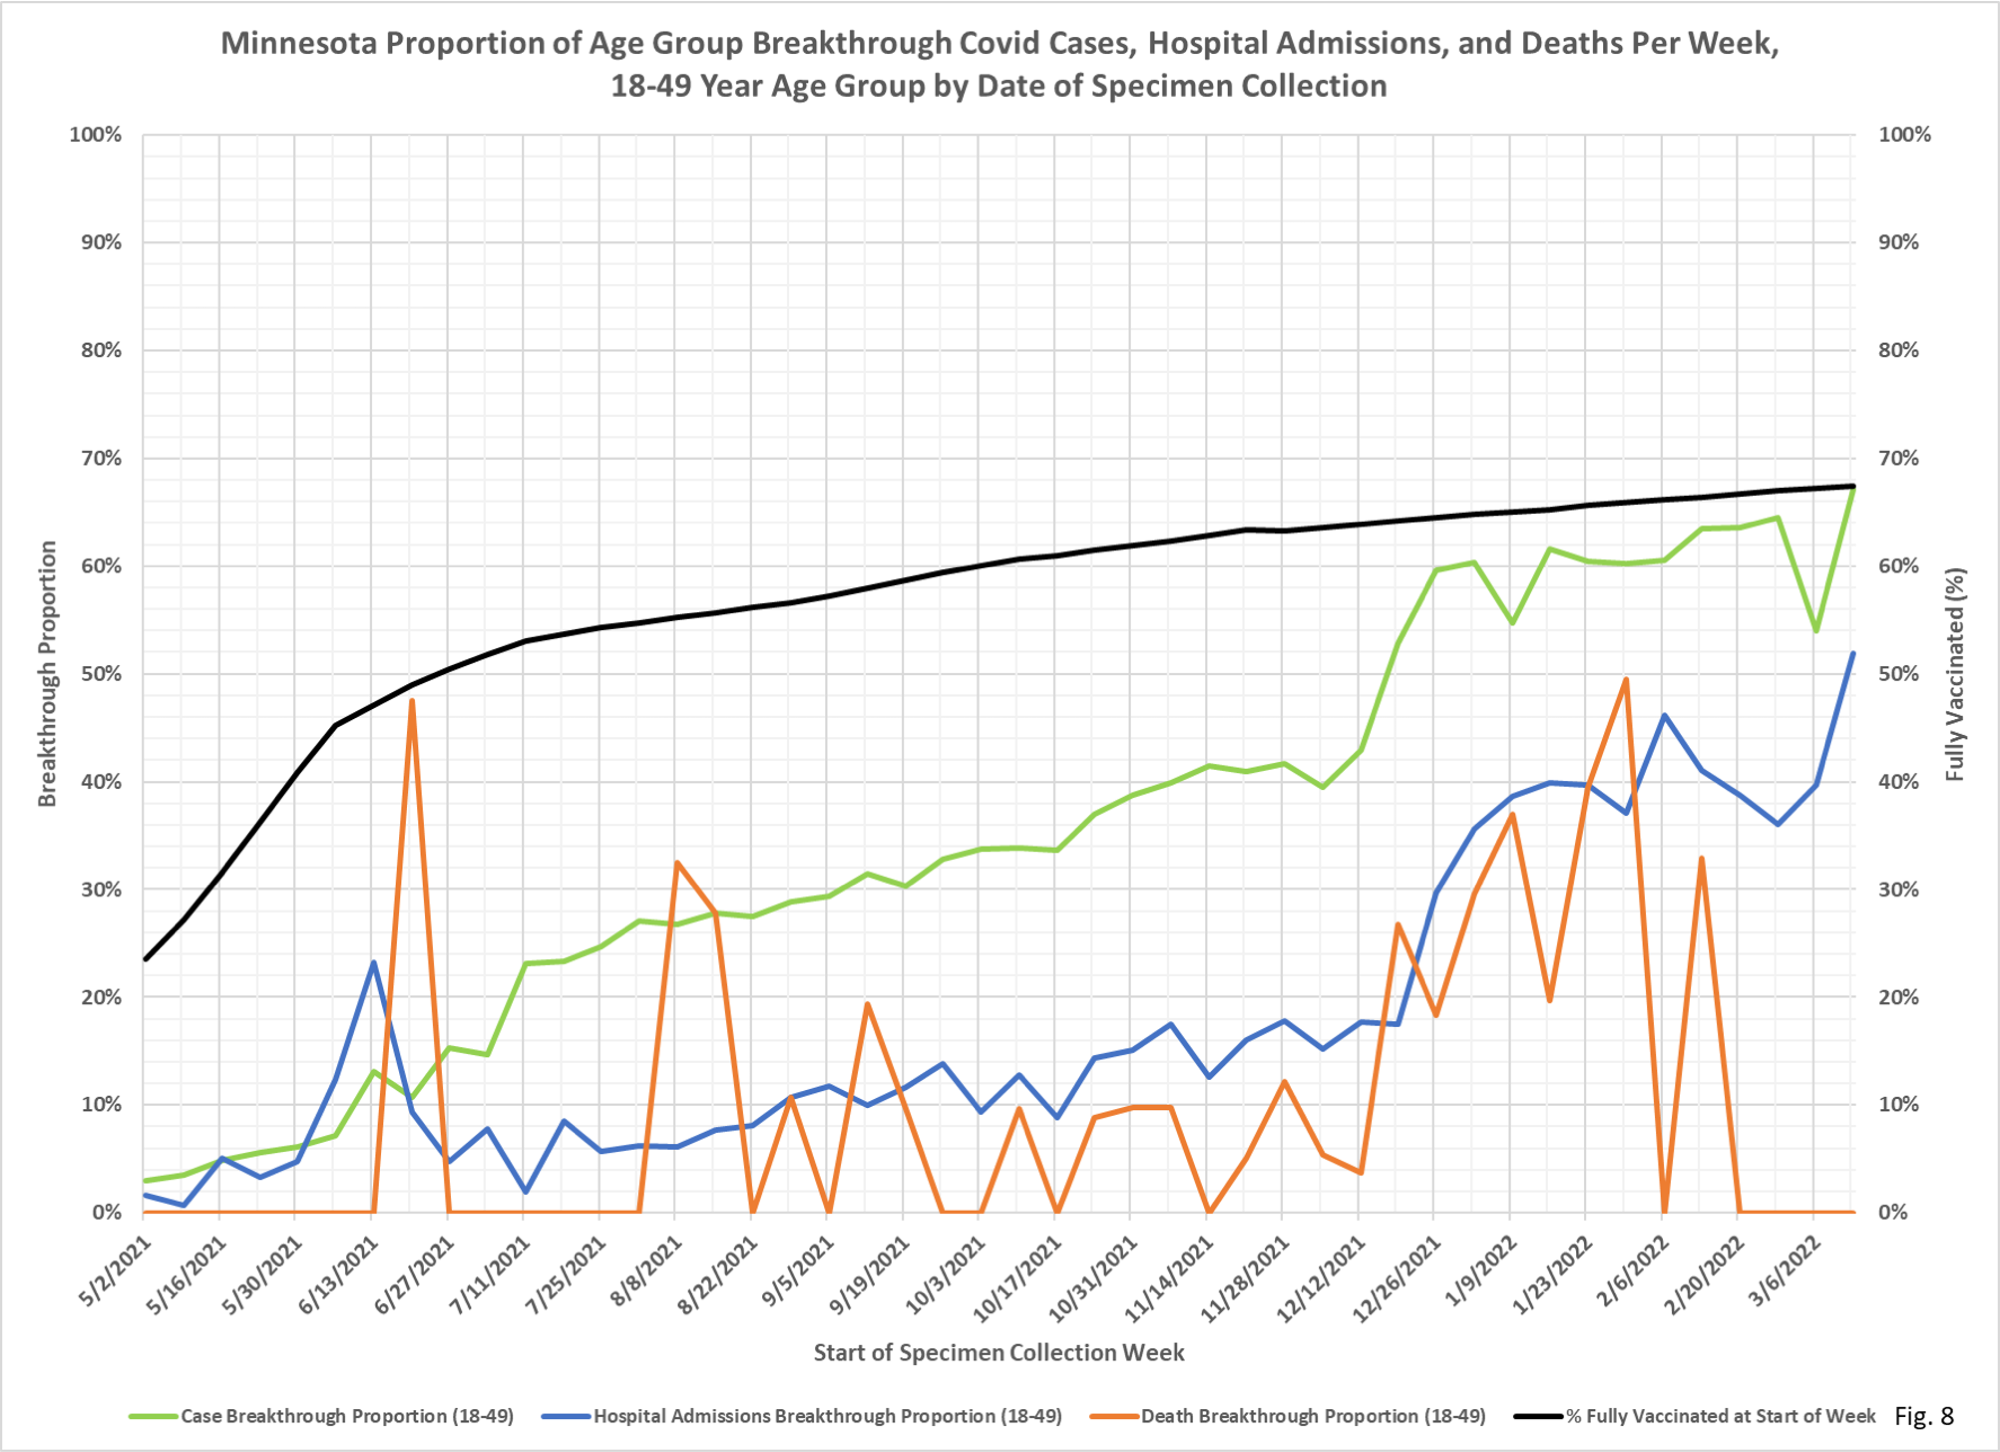
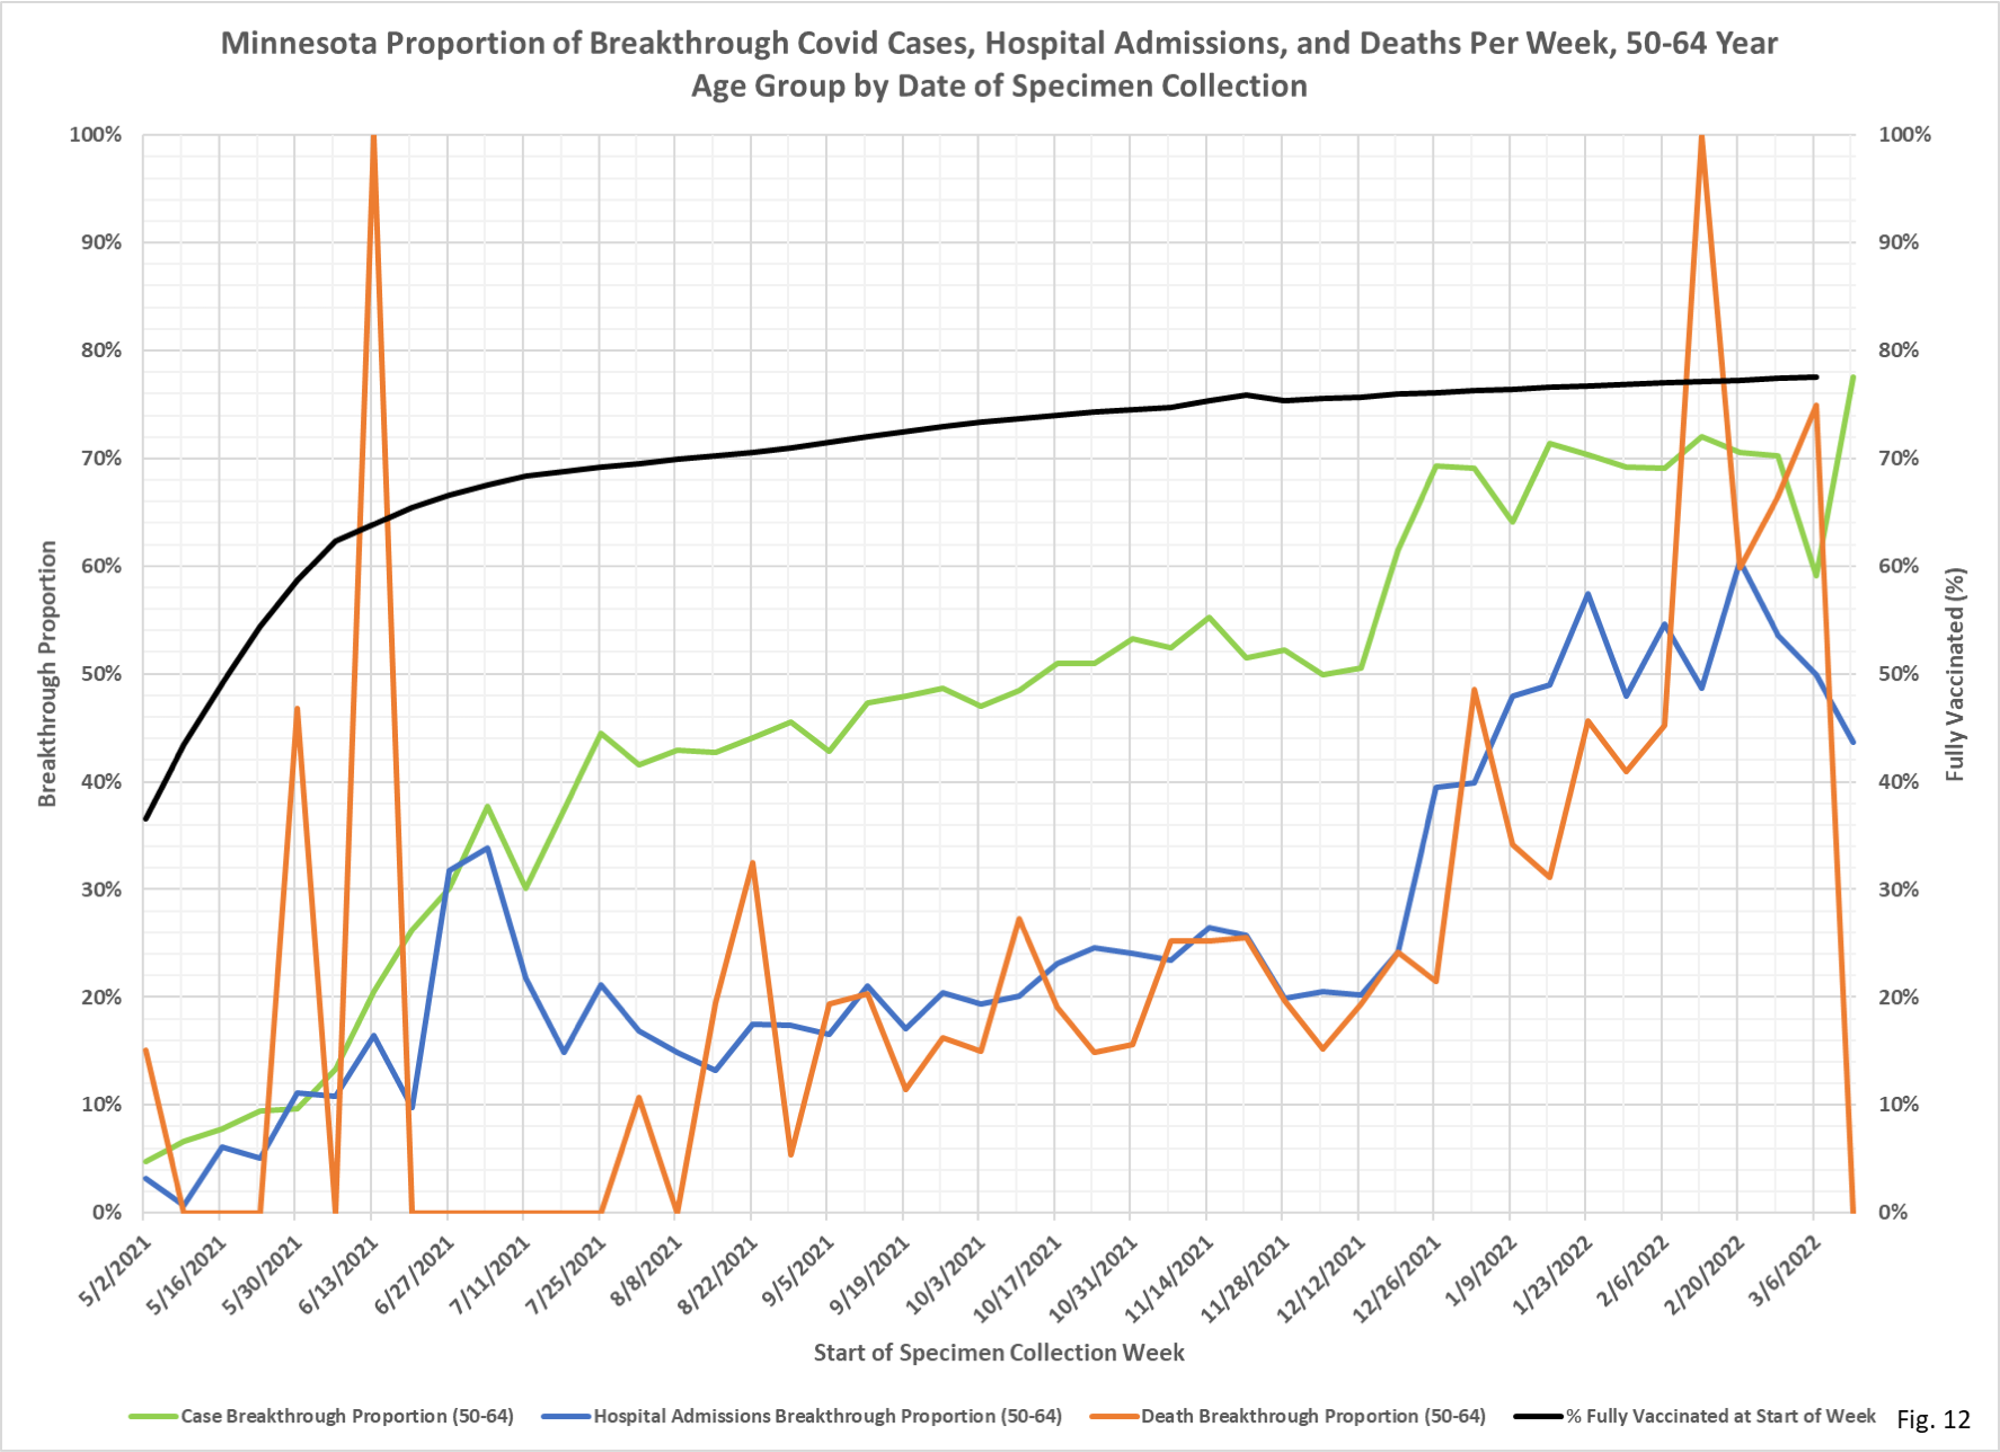
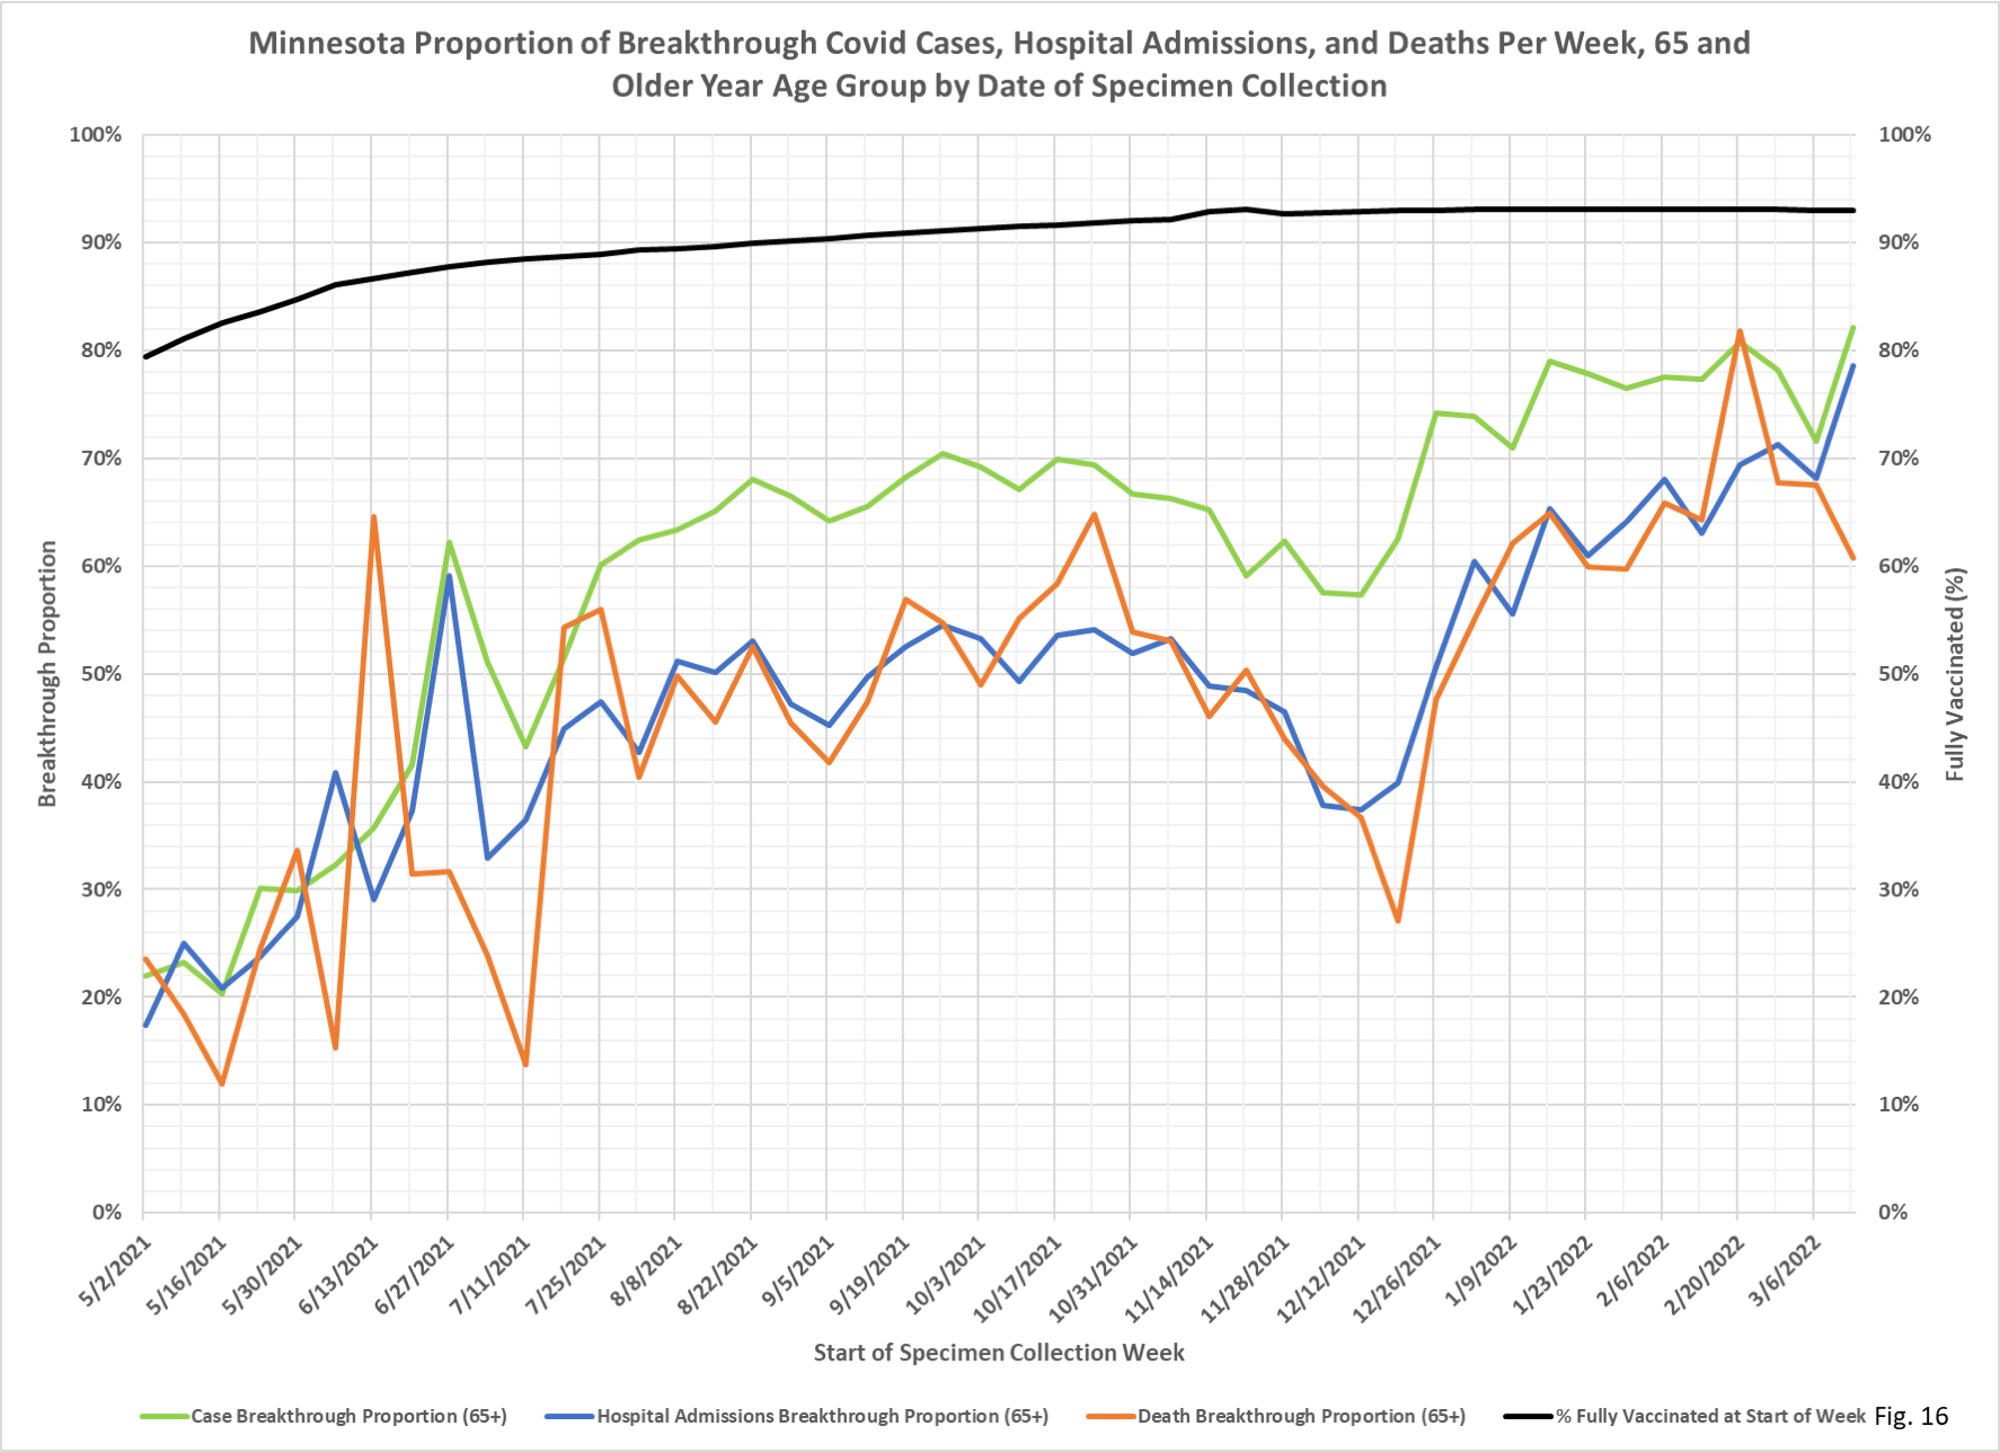
As with the general breakthrough charts, these age-based ones show the steady rise of the proportion of events in the vaccinated subgroup. For all age groups but the oldest one, which is heavily boosted, vaccine effectiveness against infection is essentially zero.
 Dave’s notes:
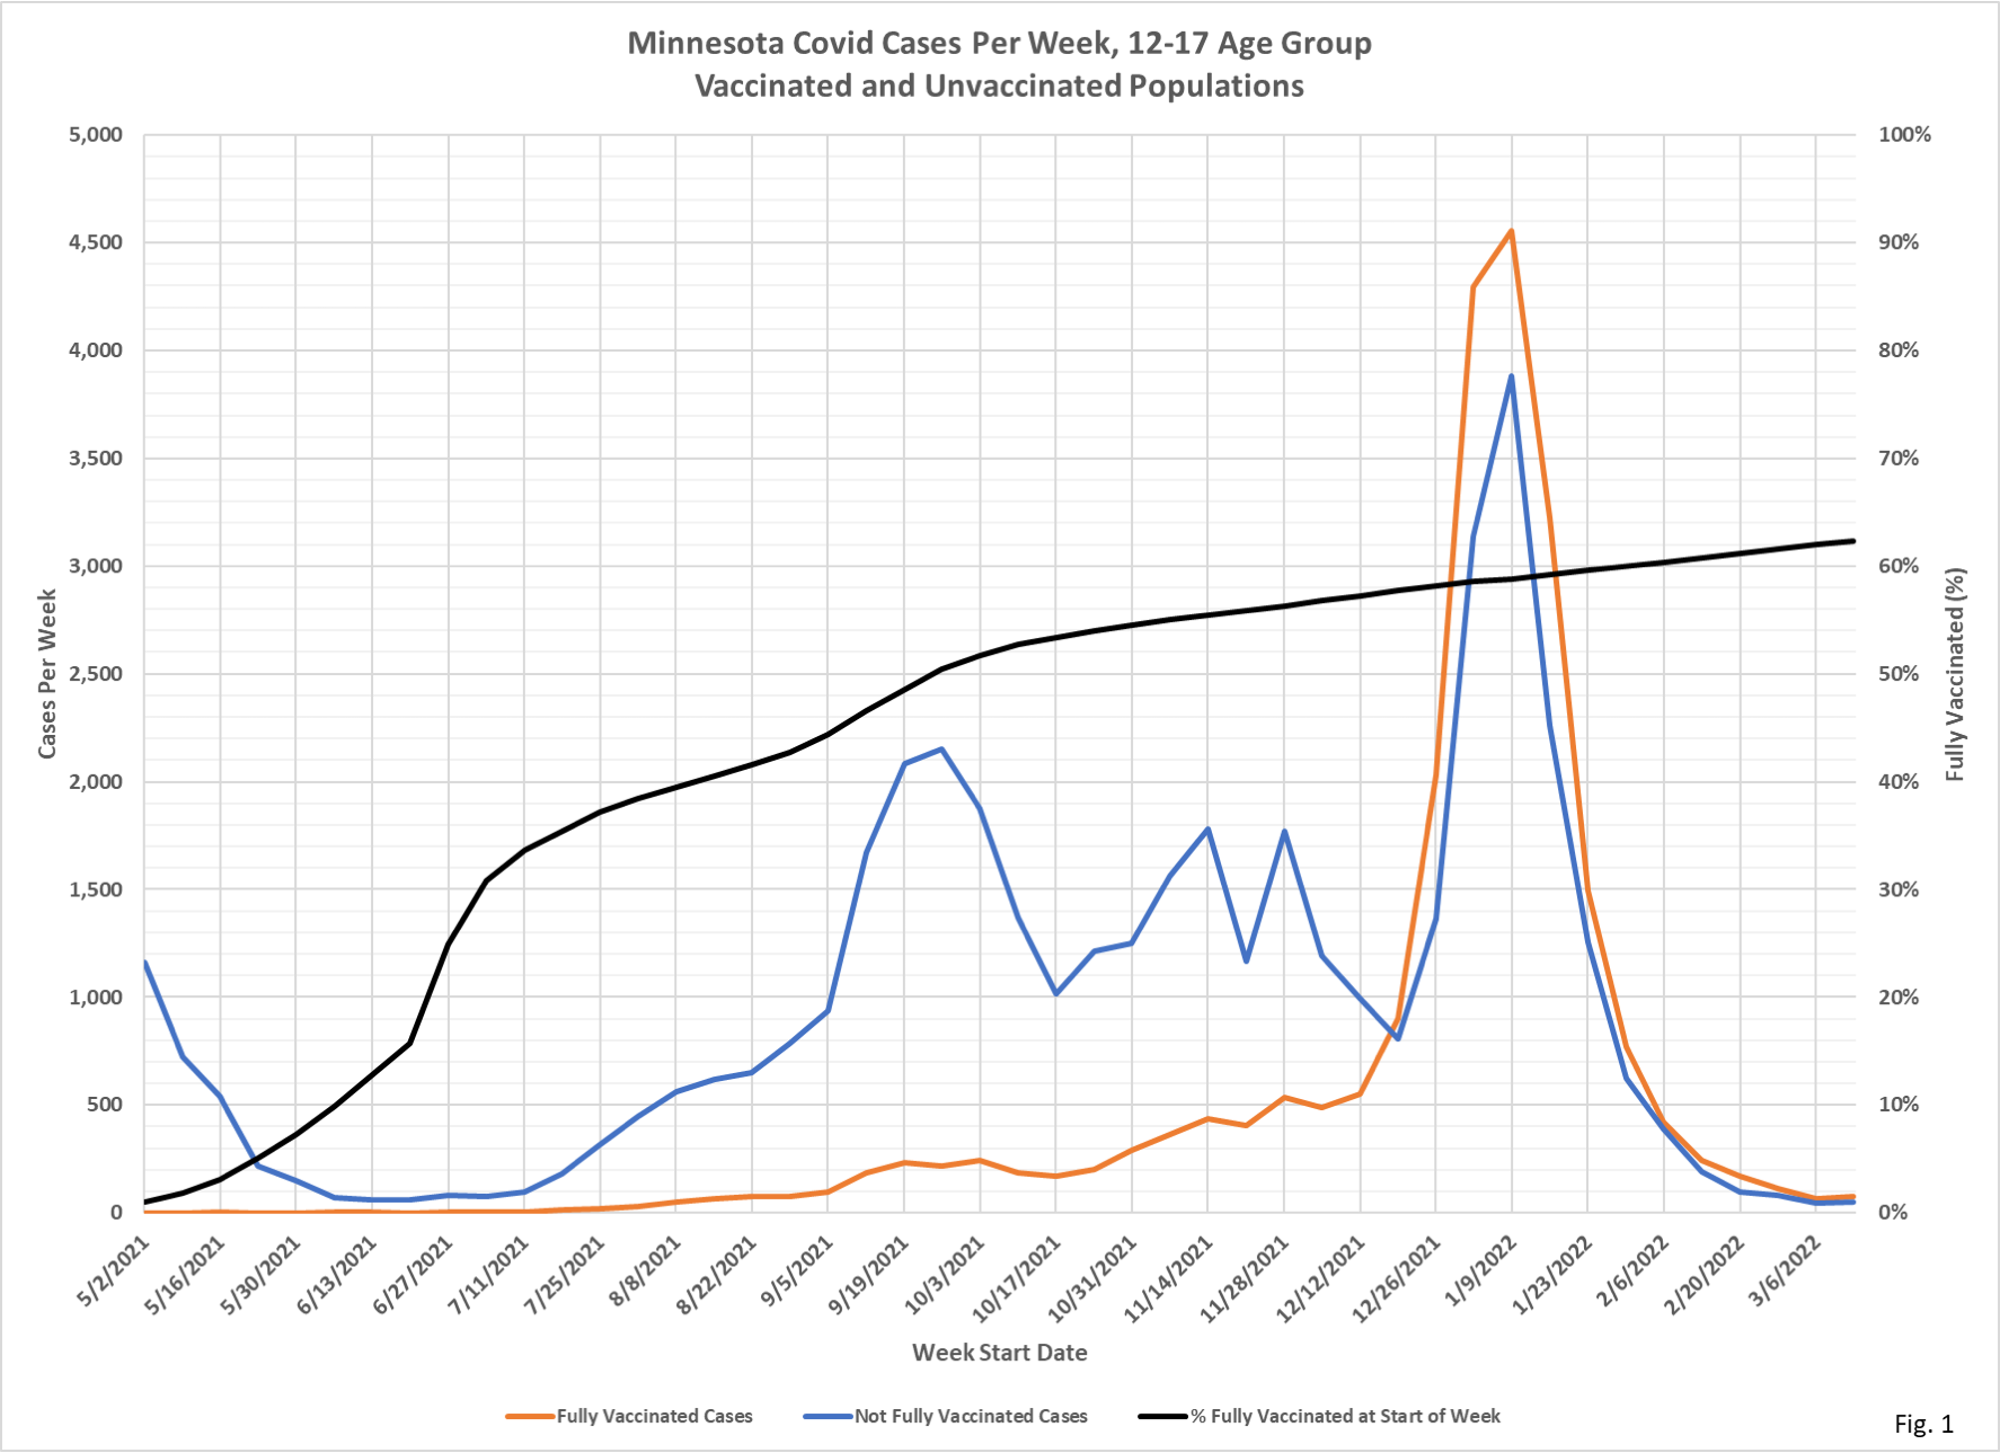
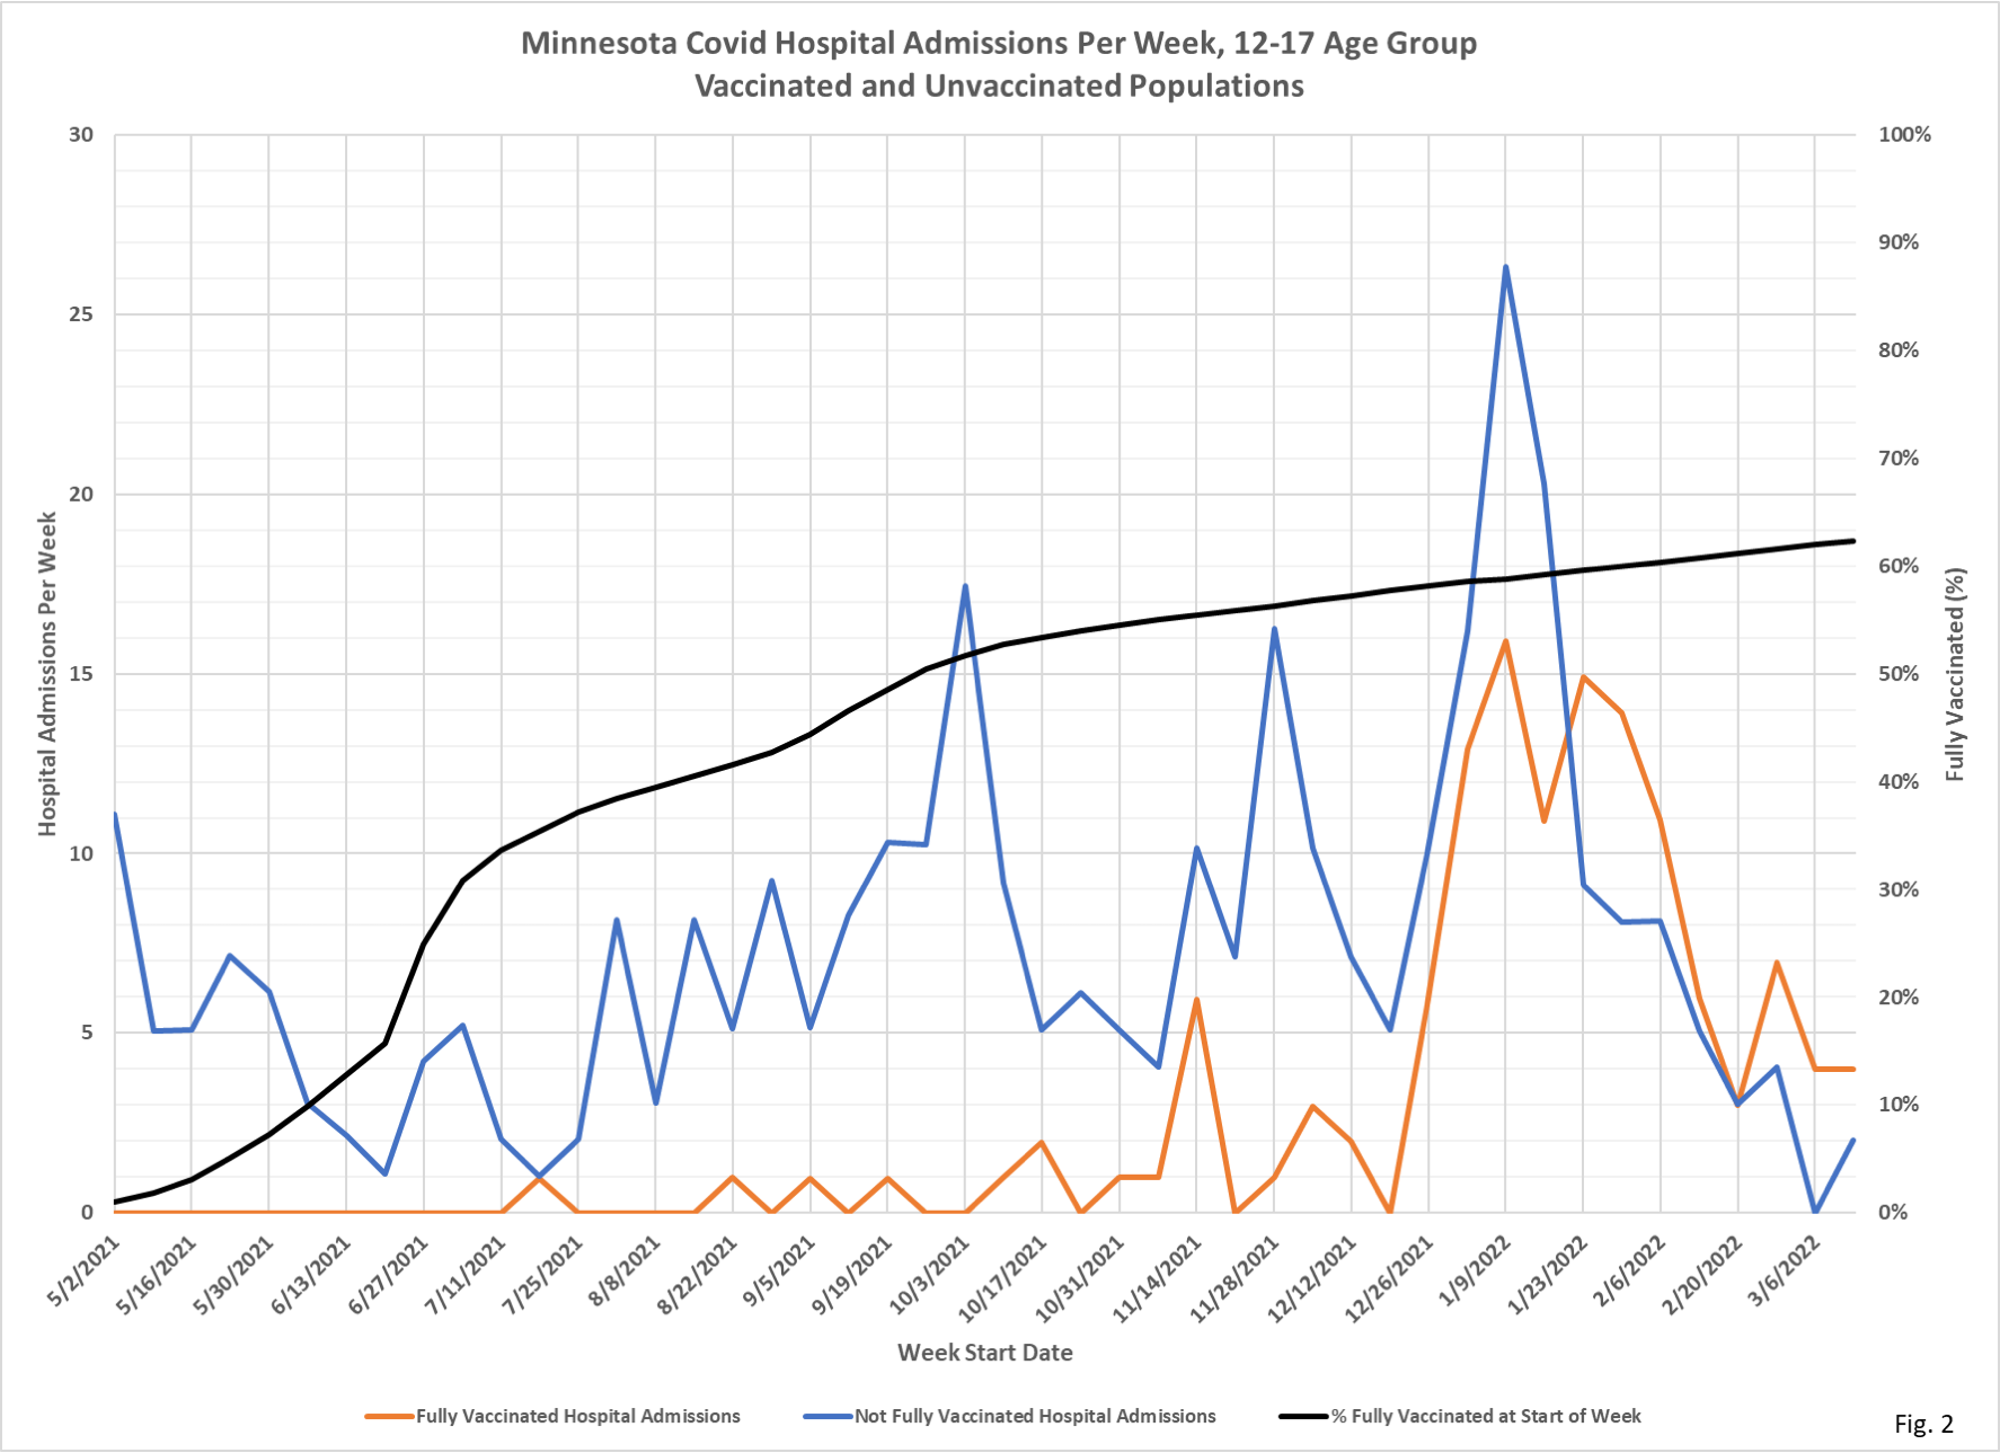
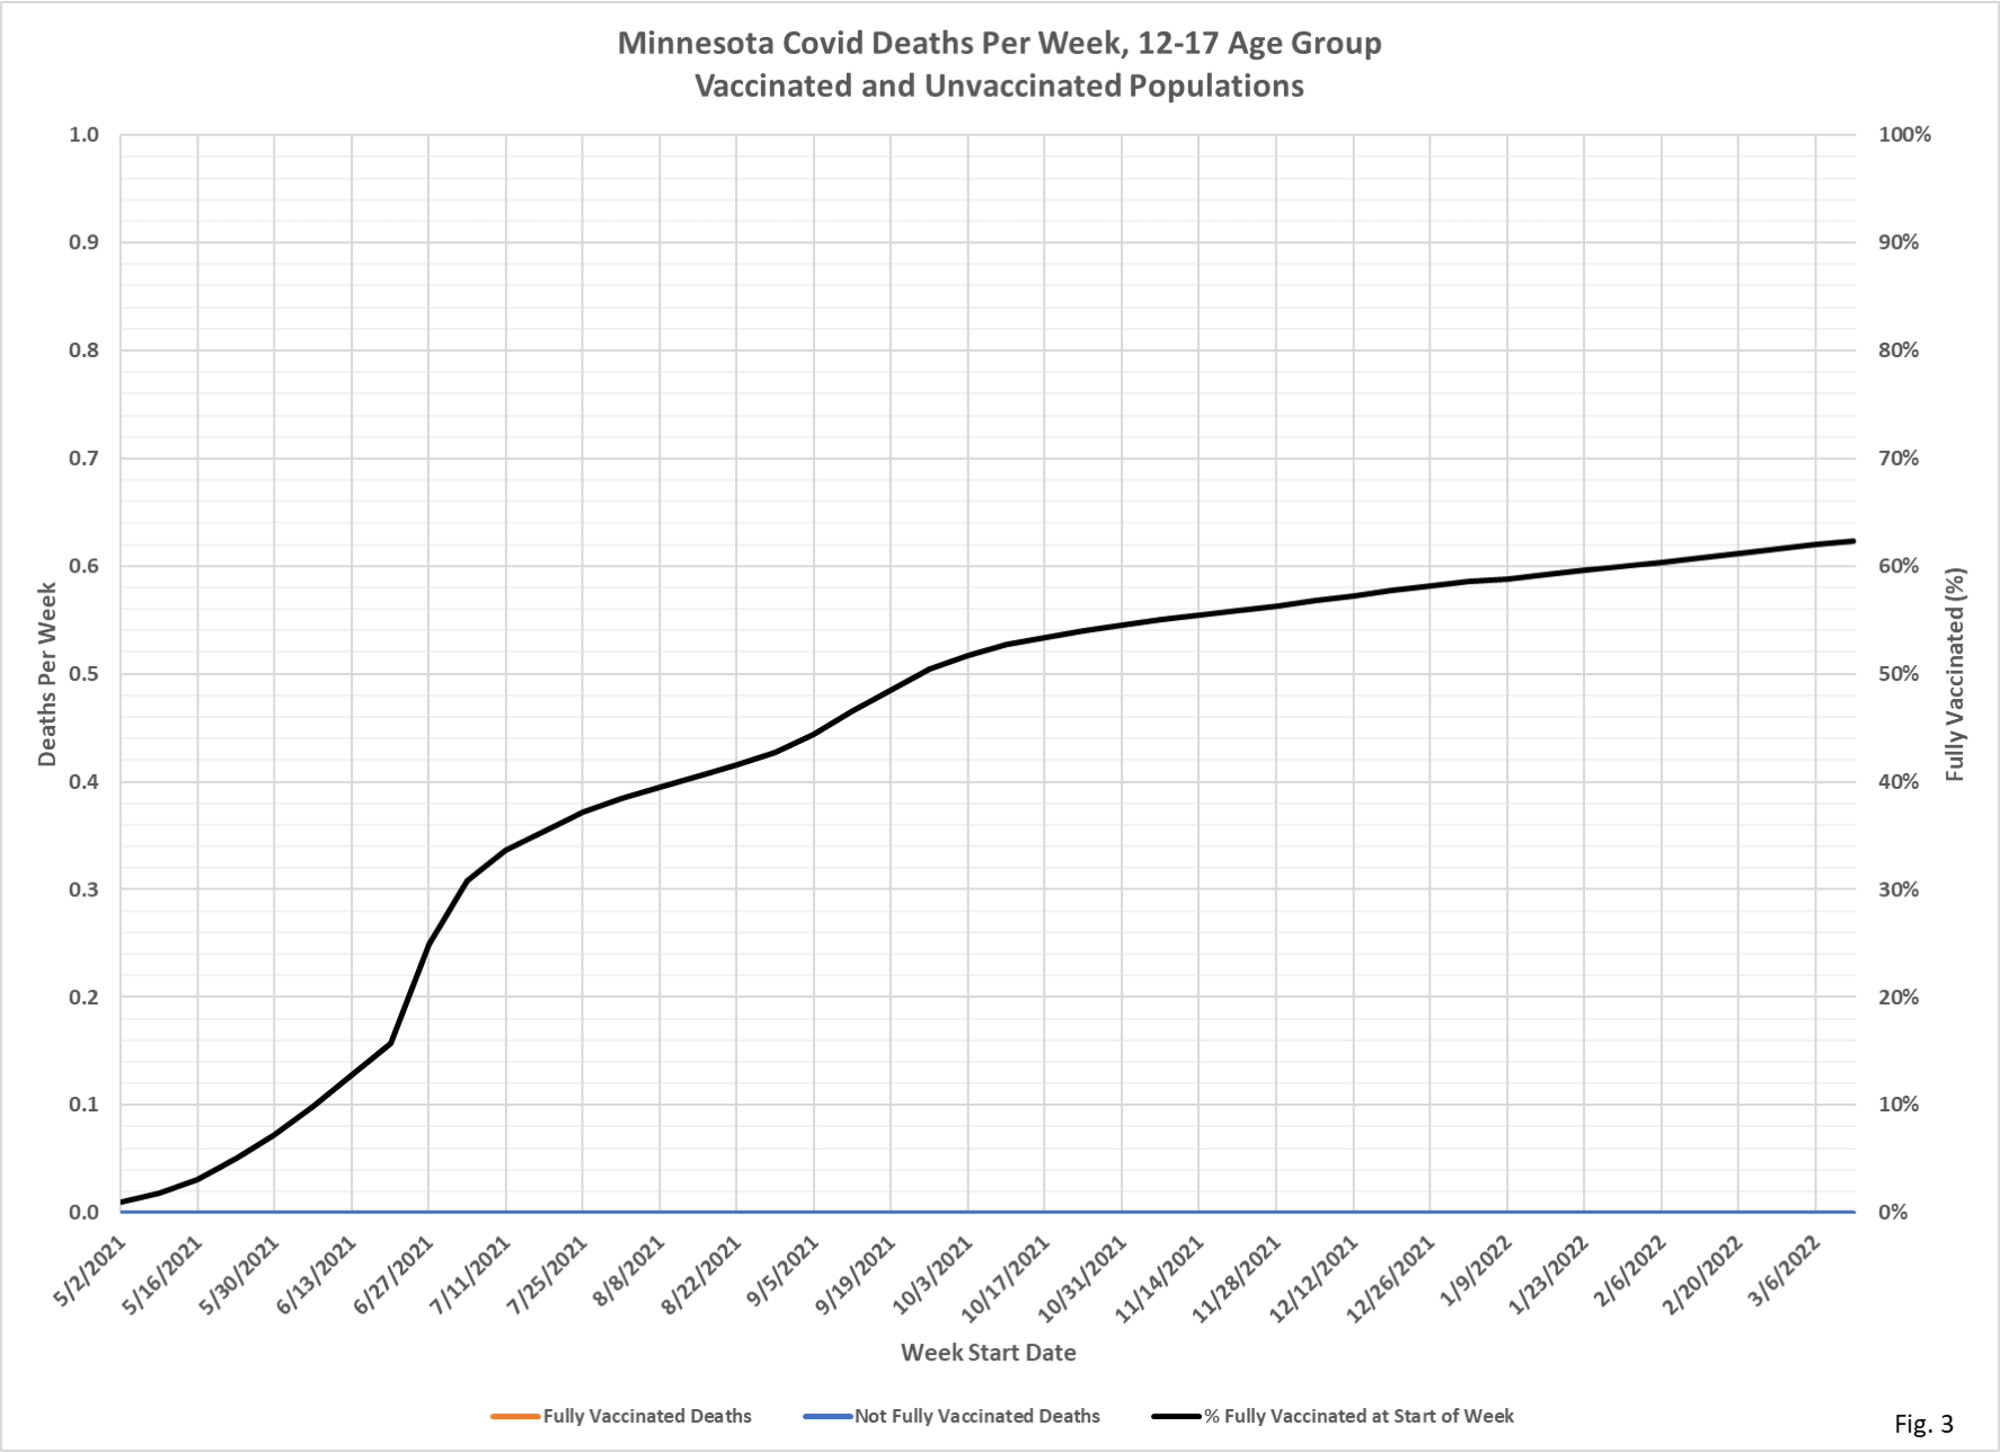
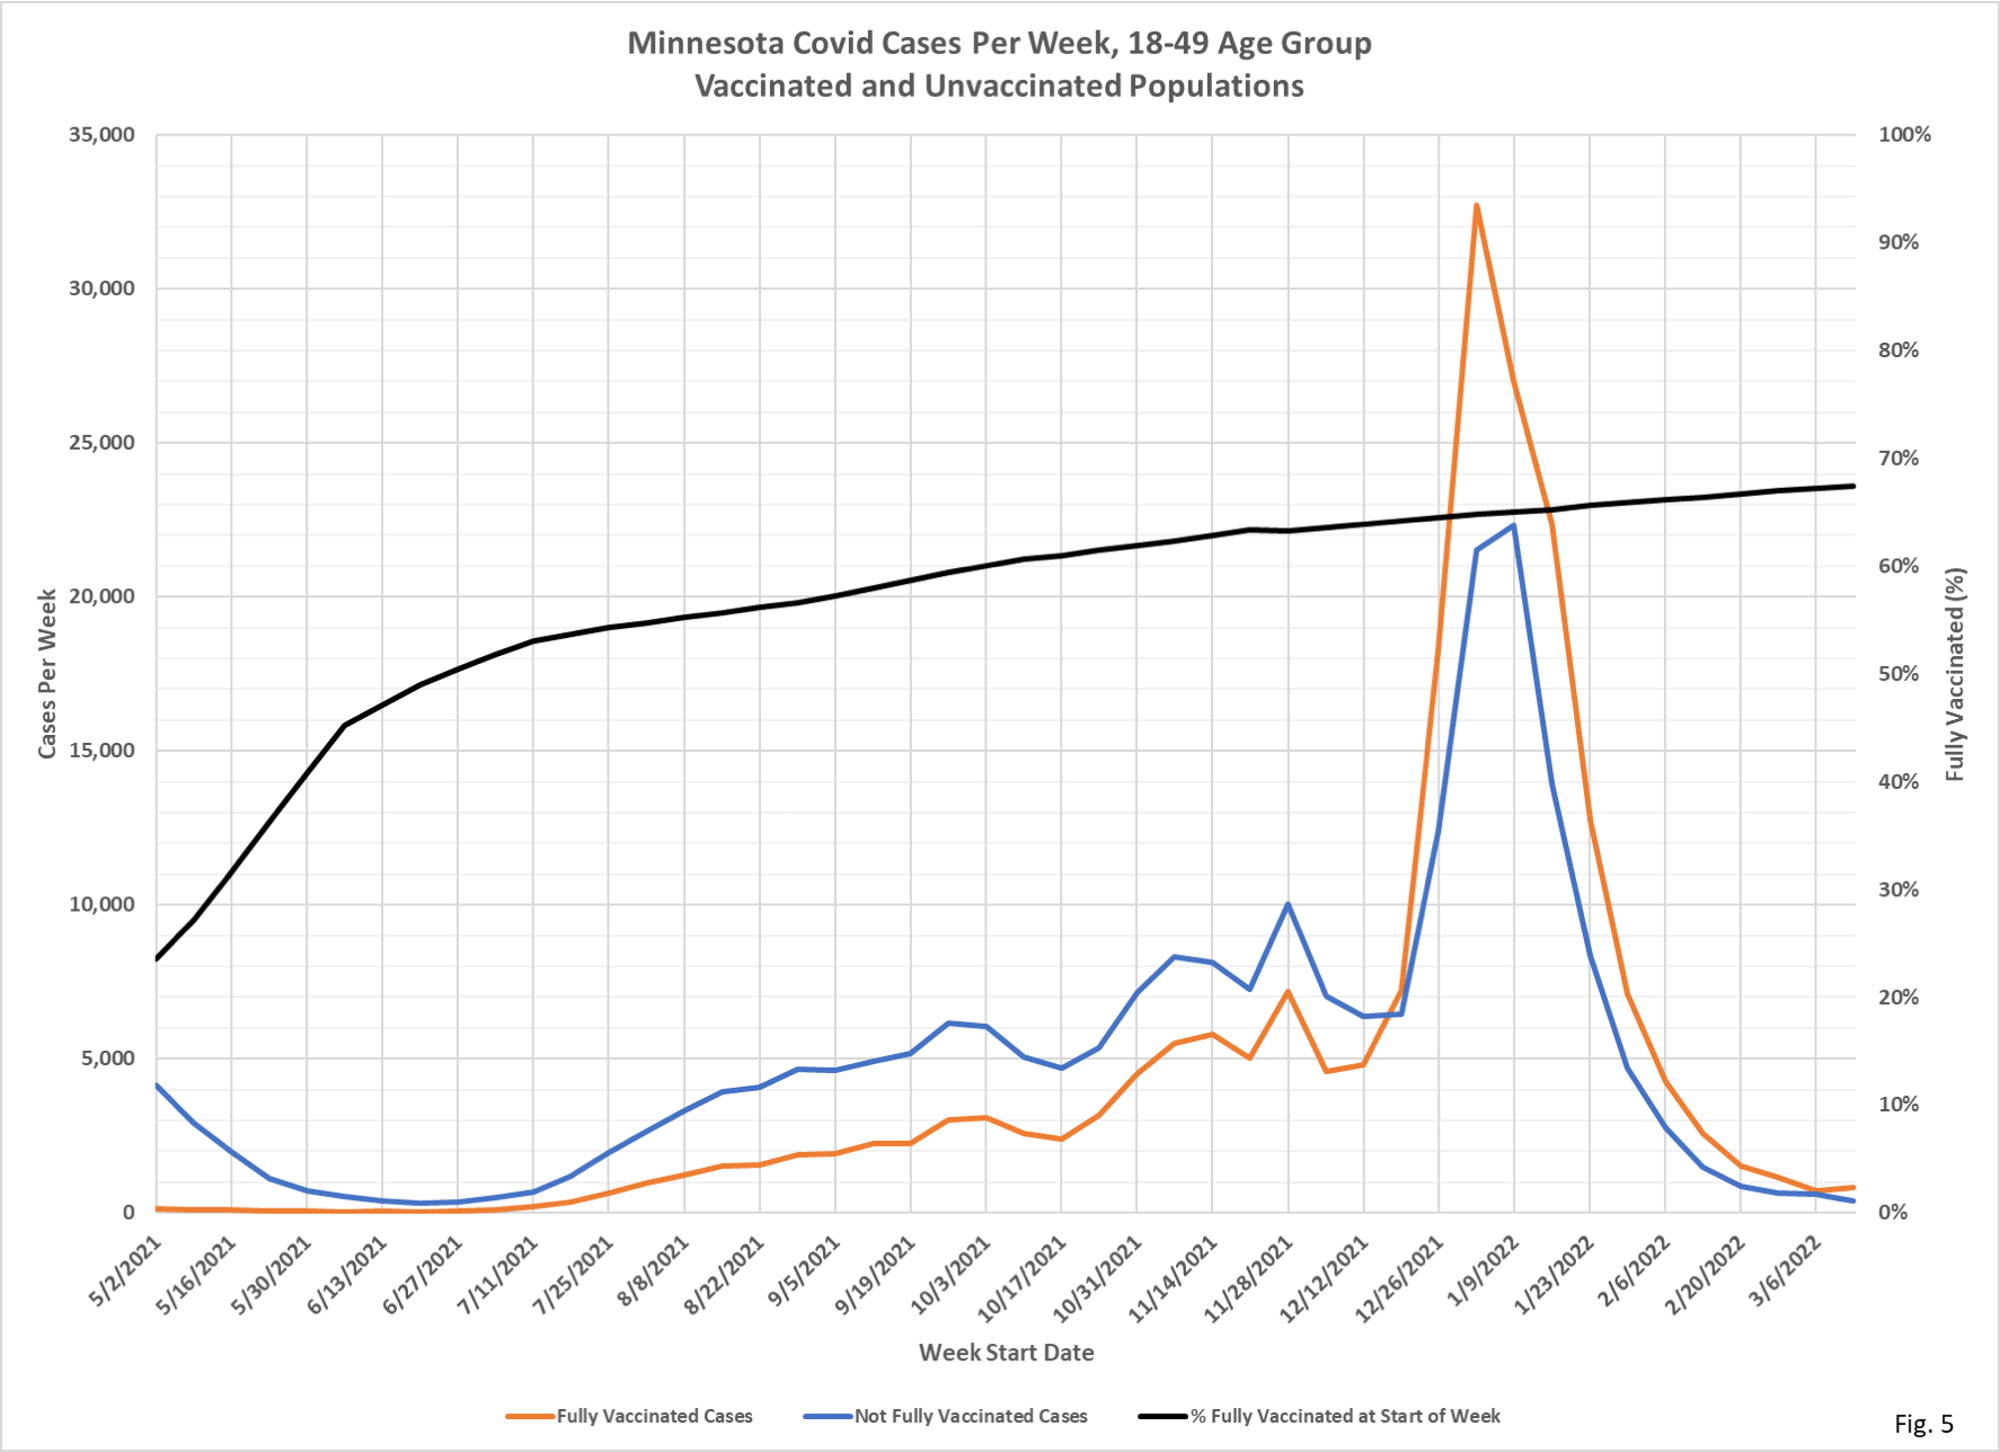
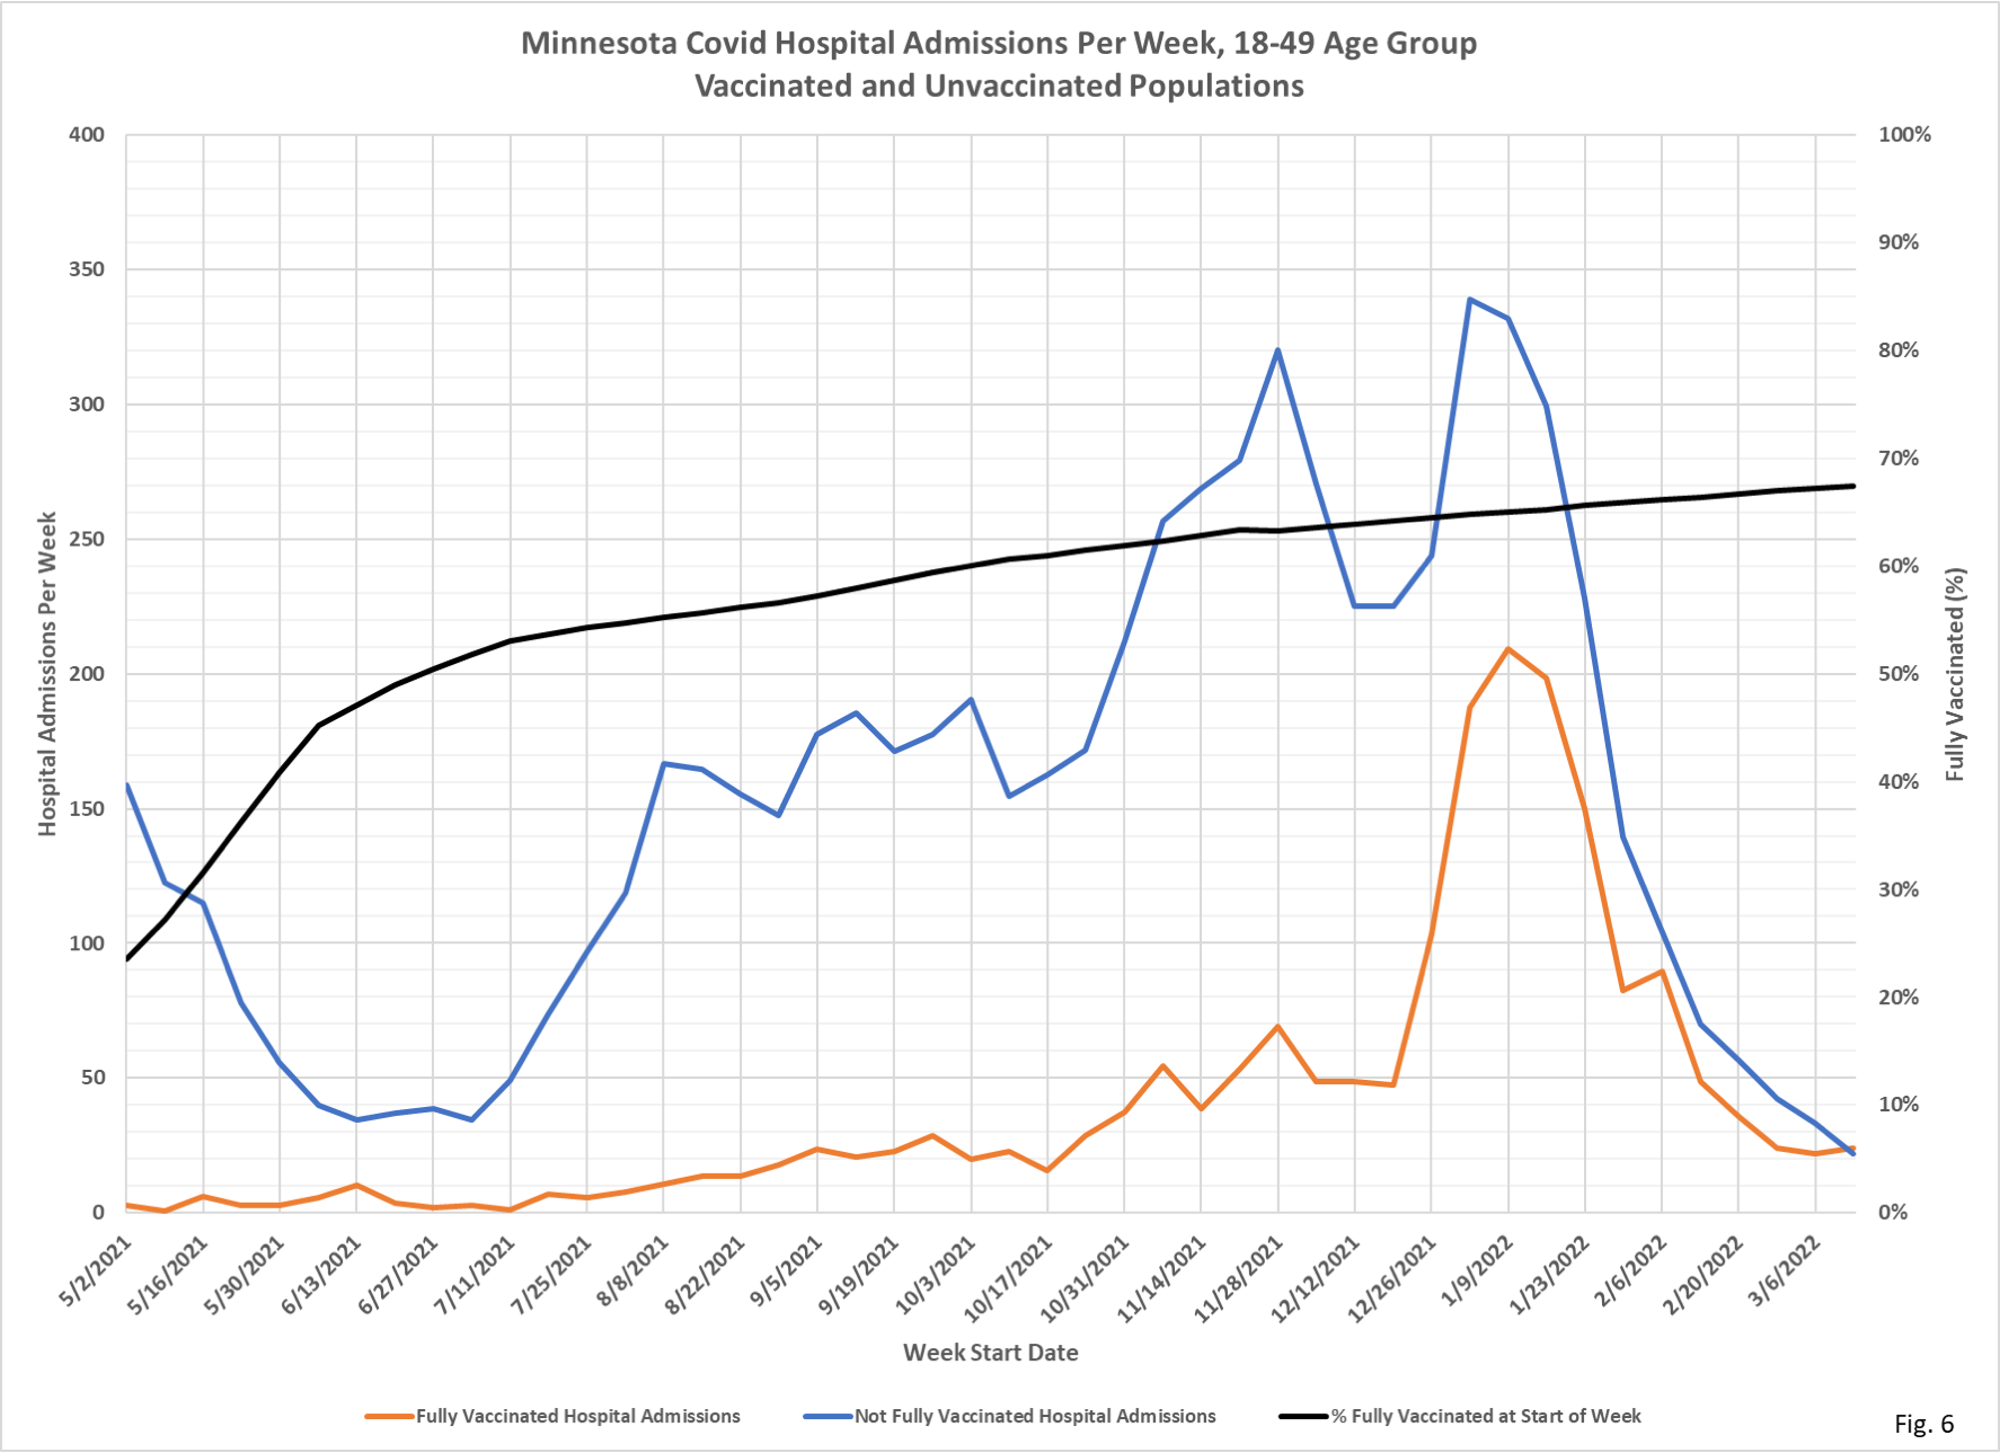
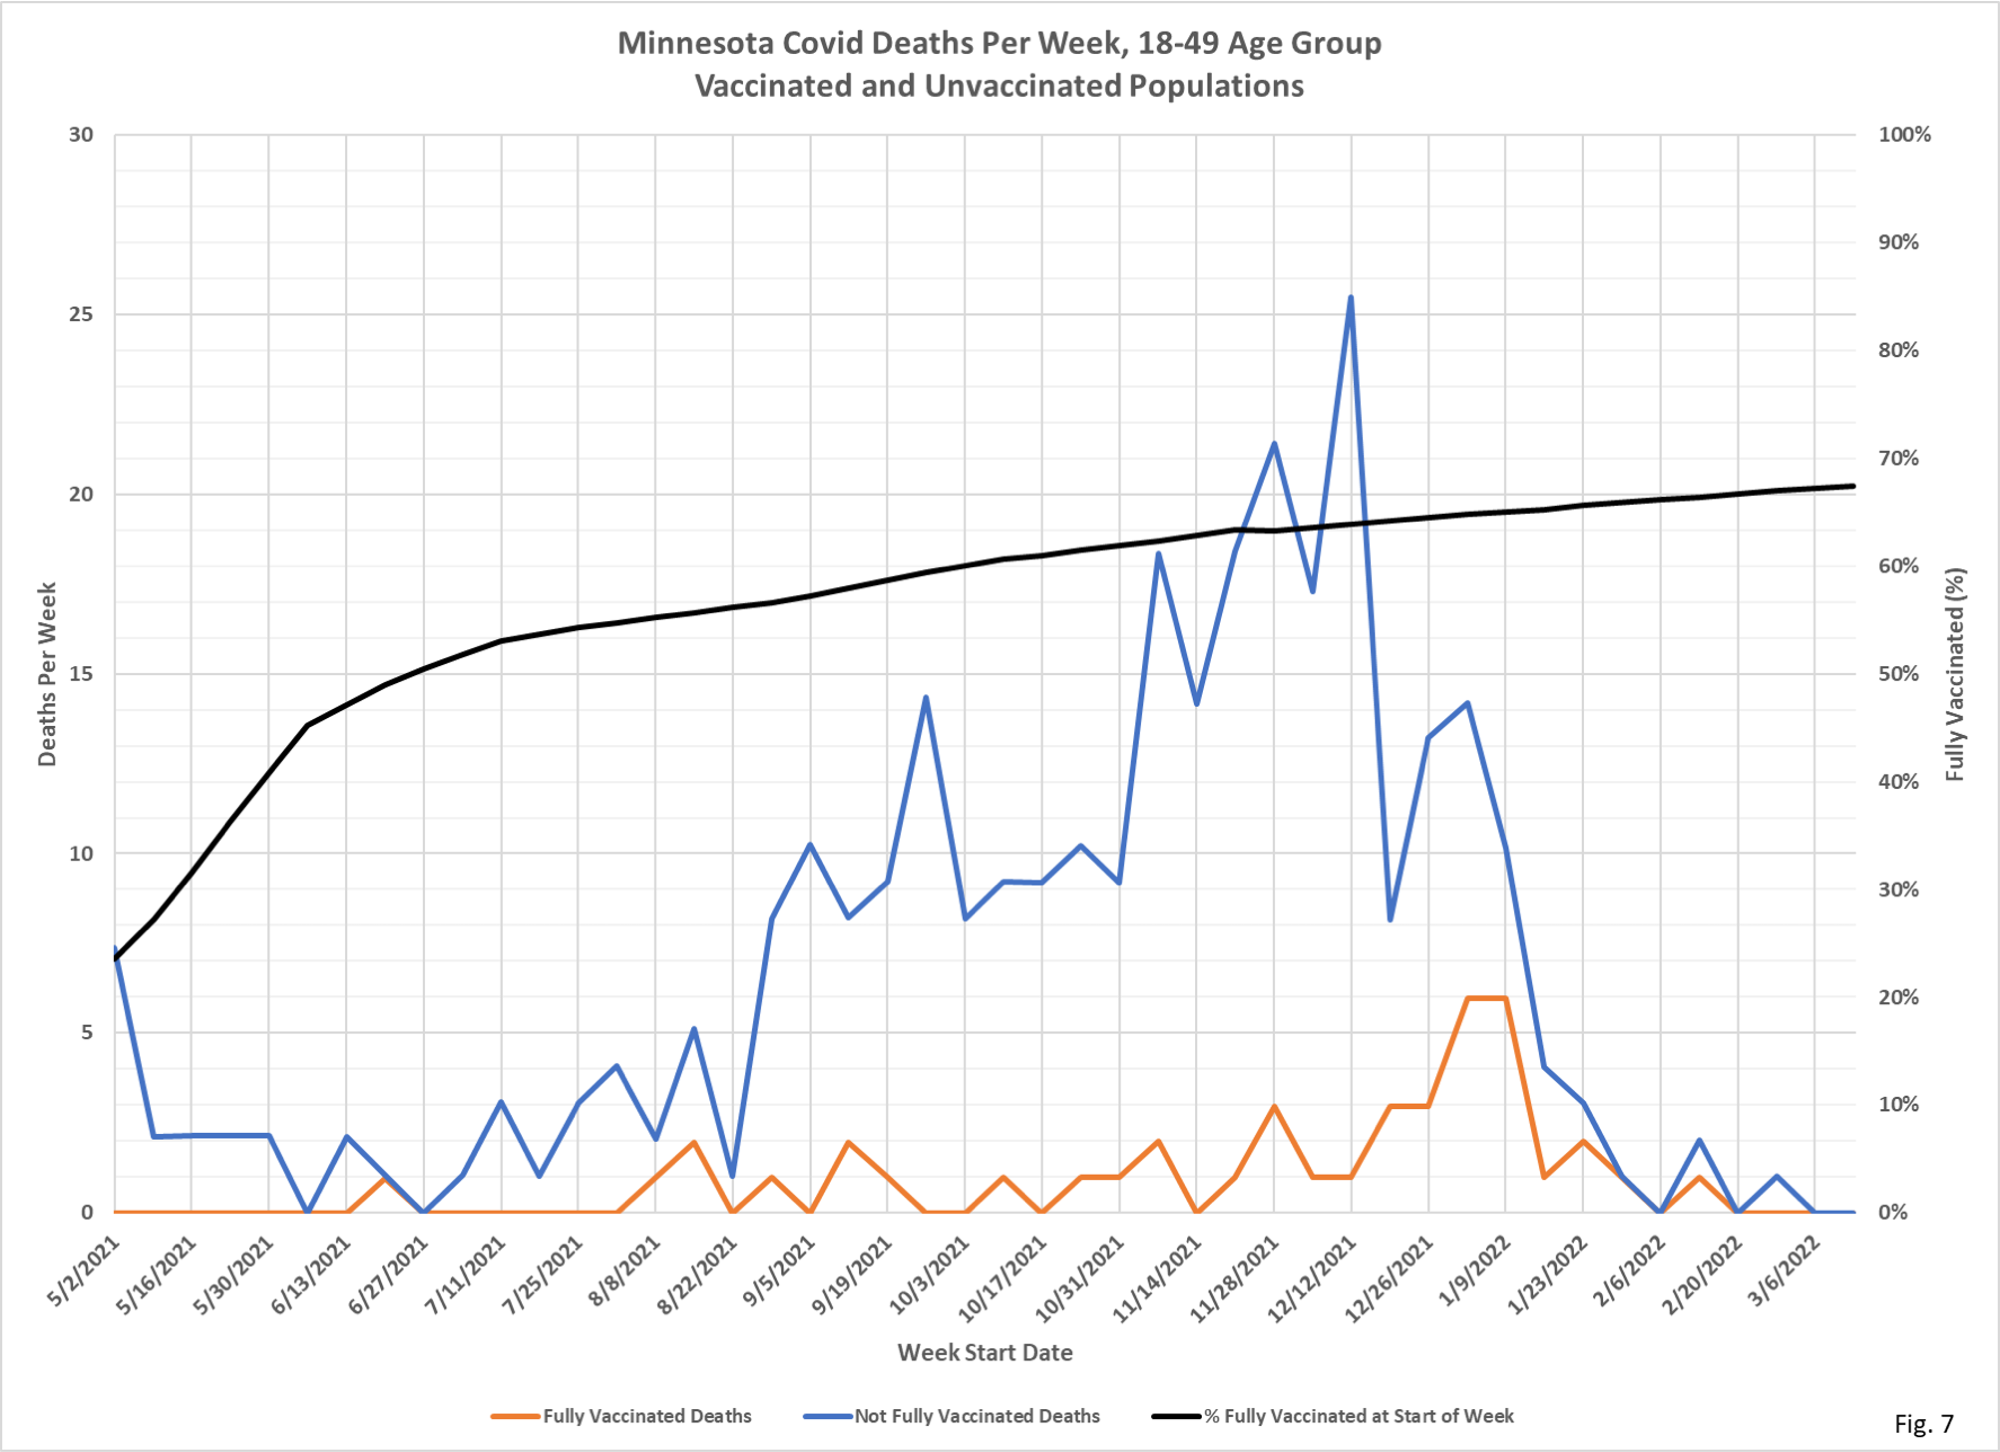
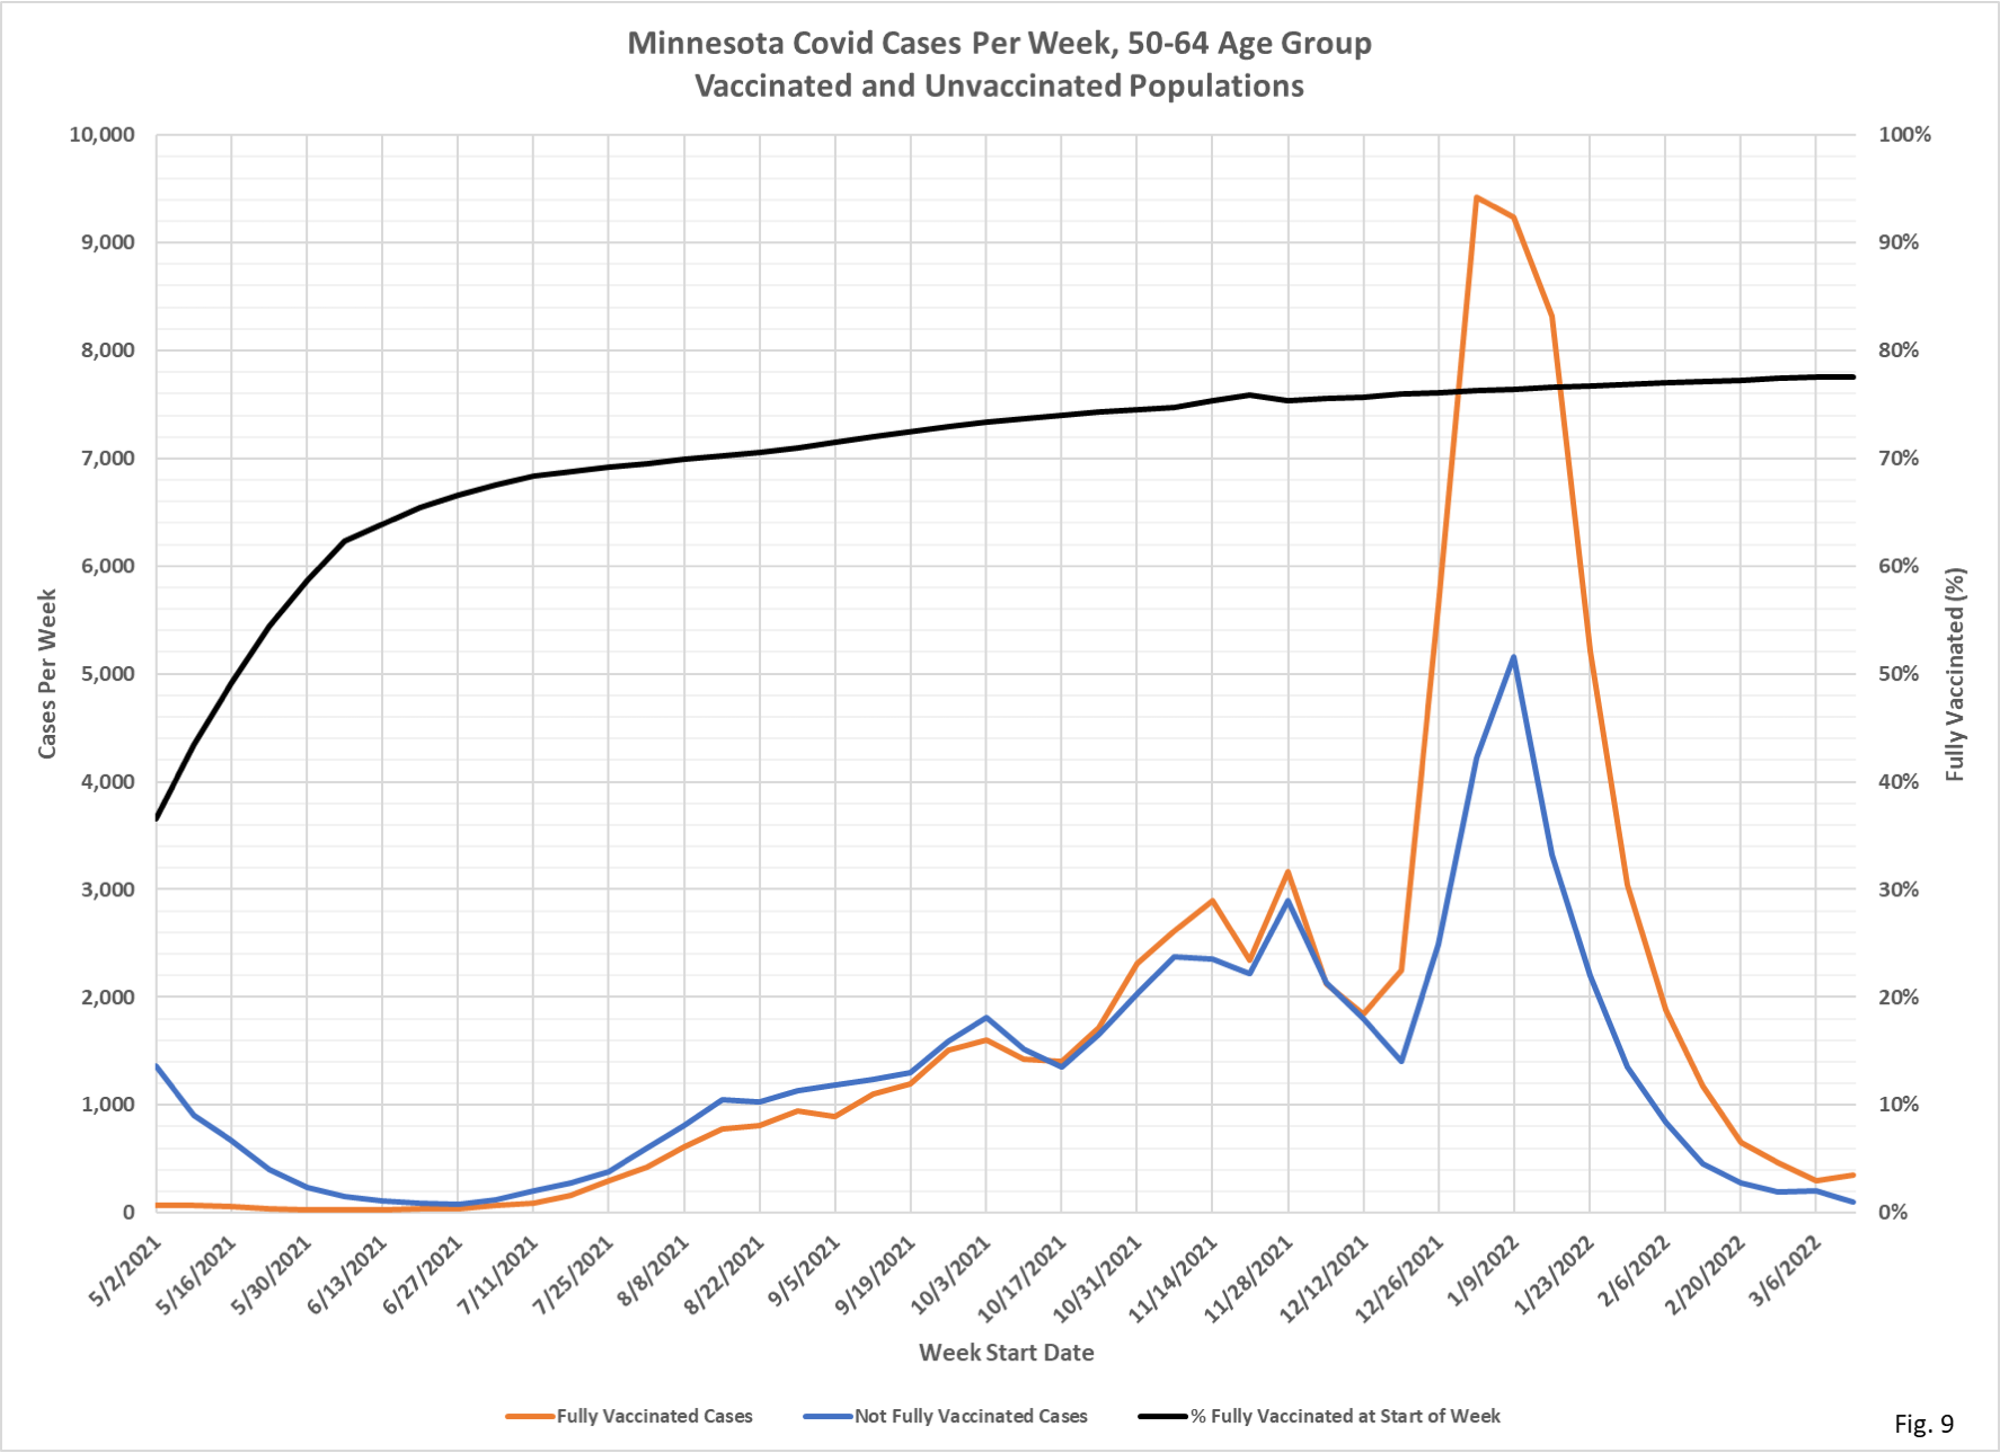
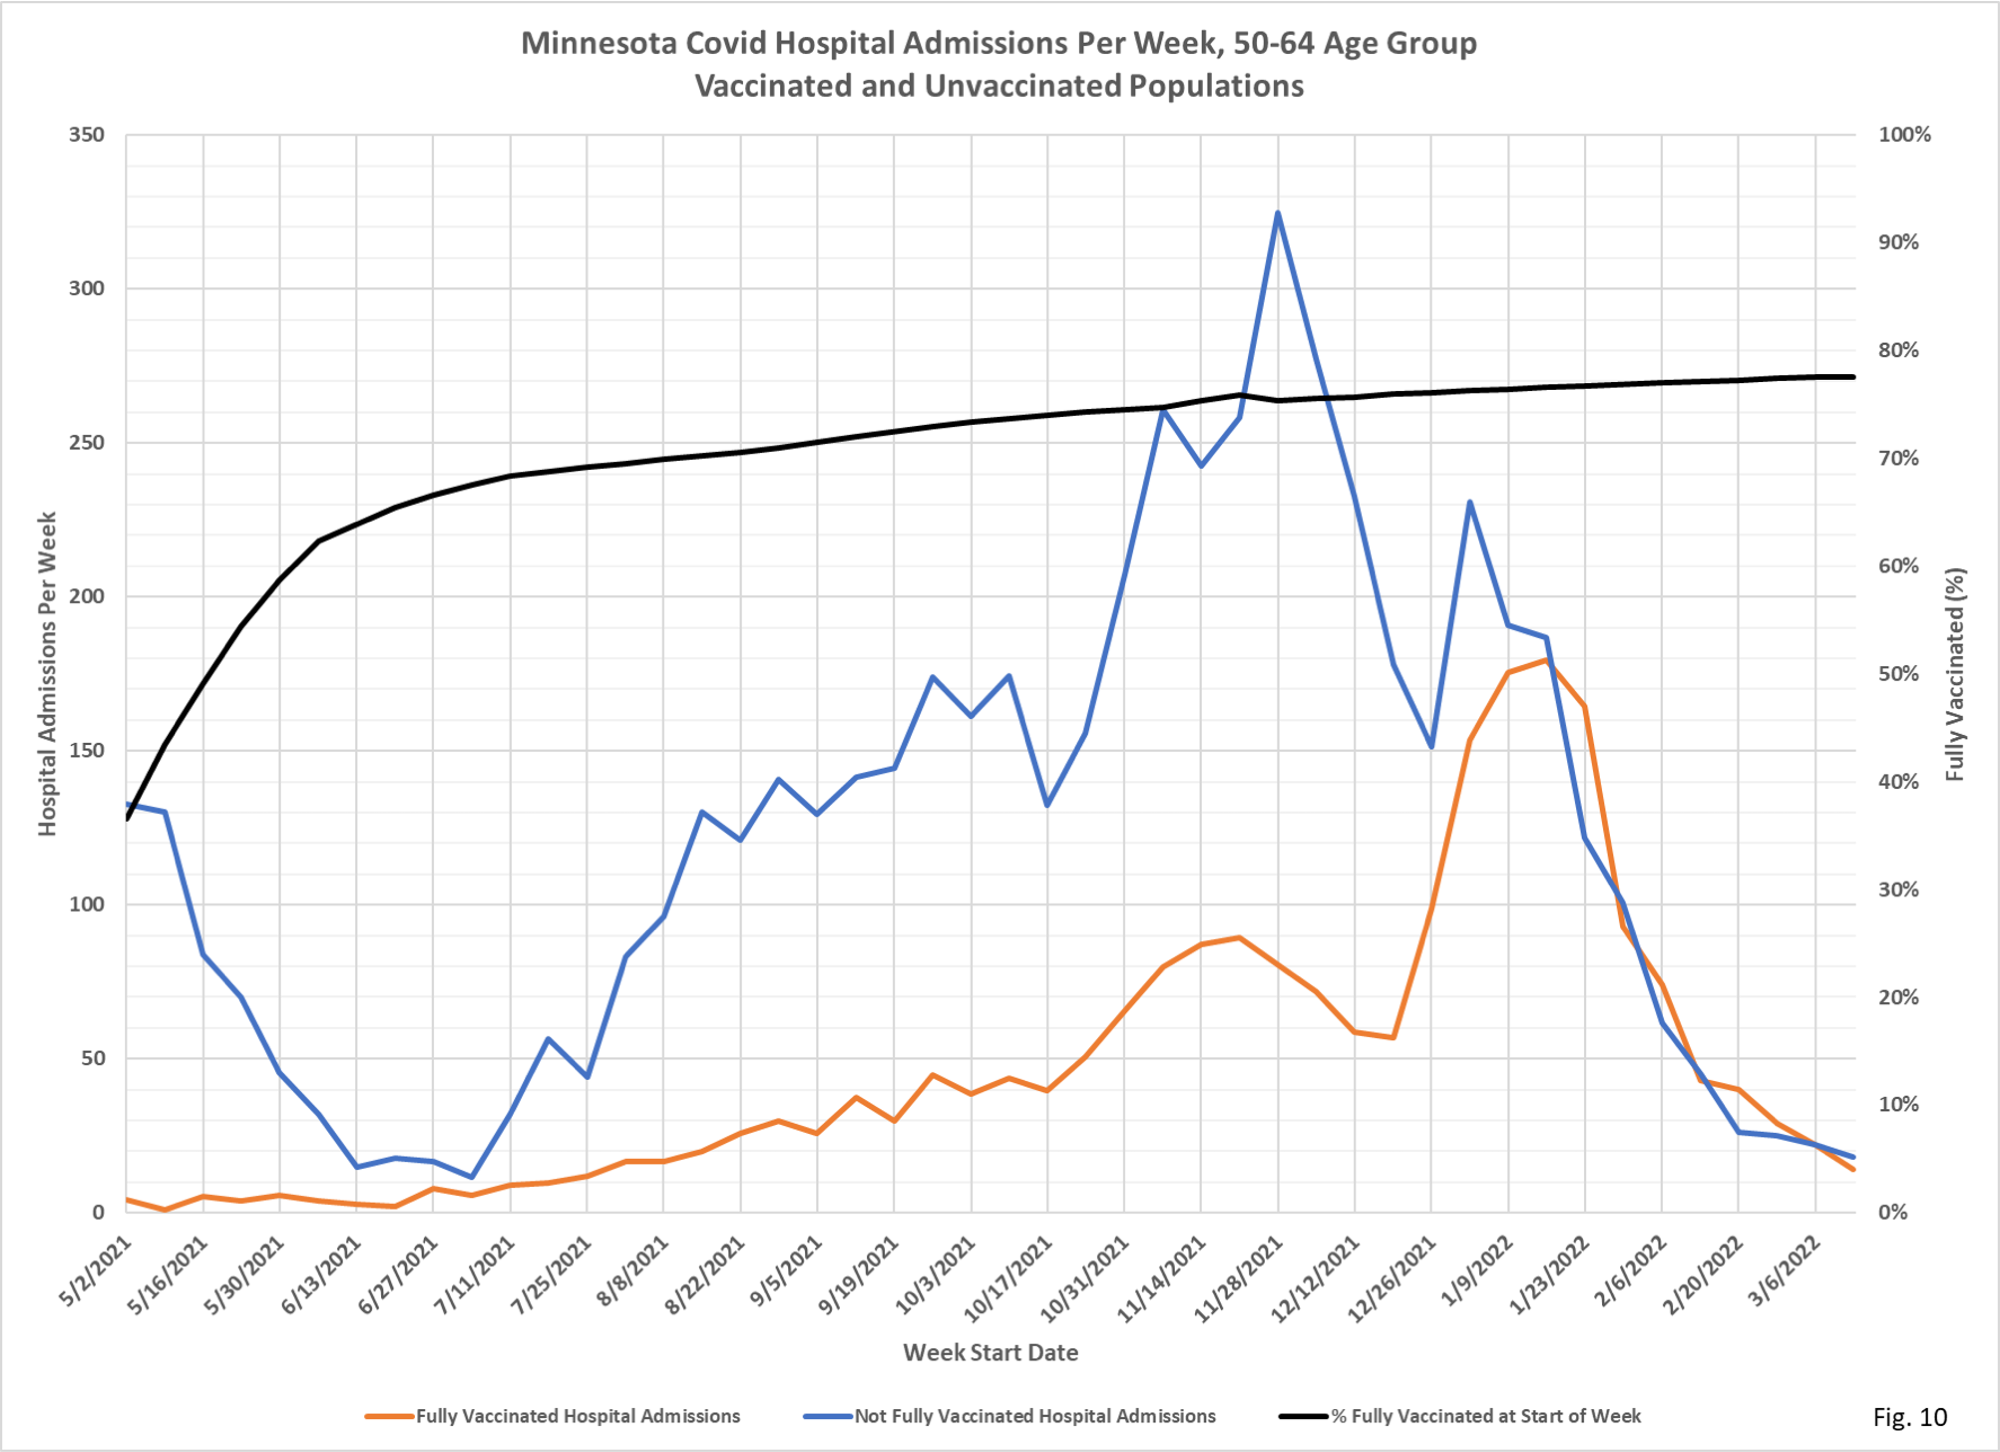
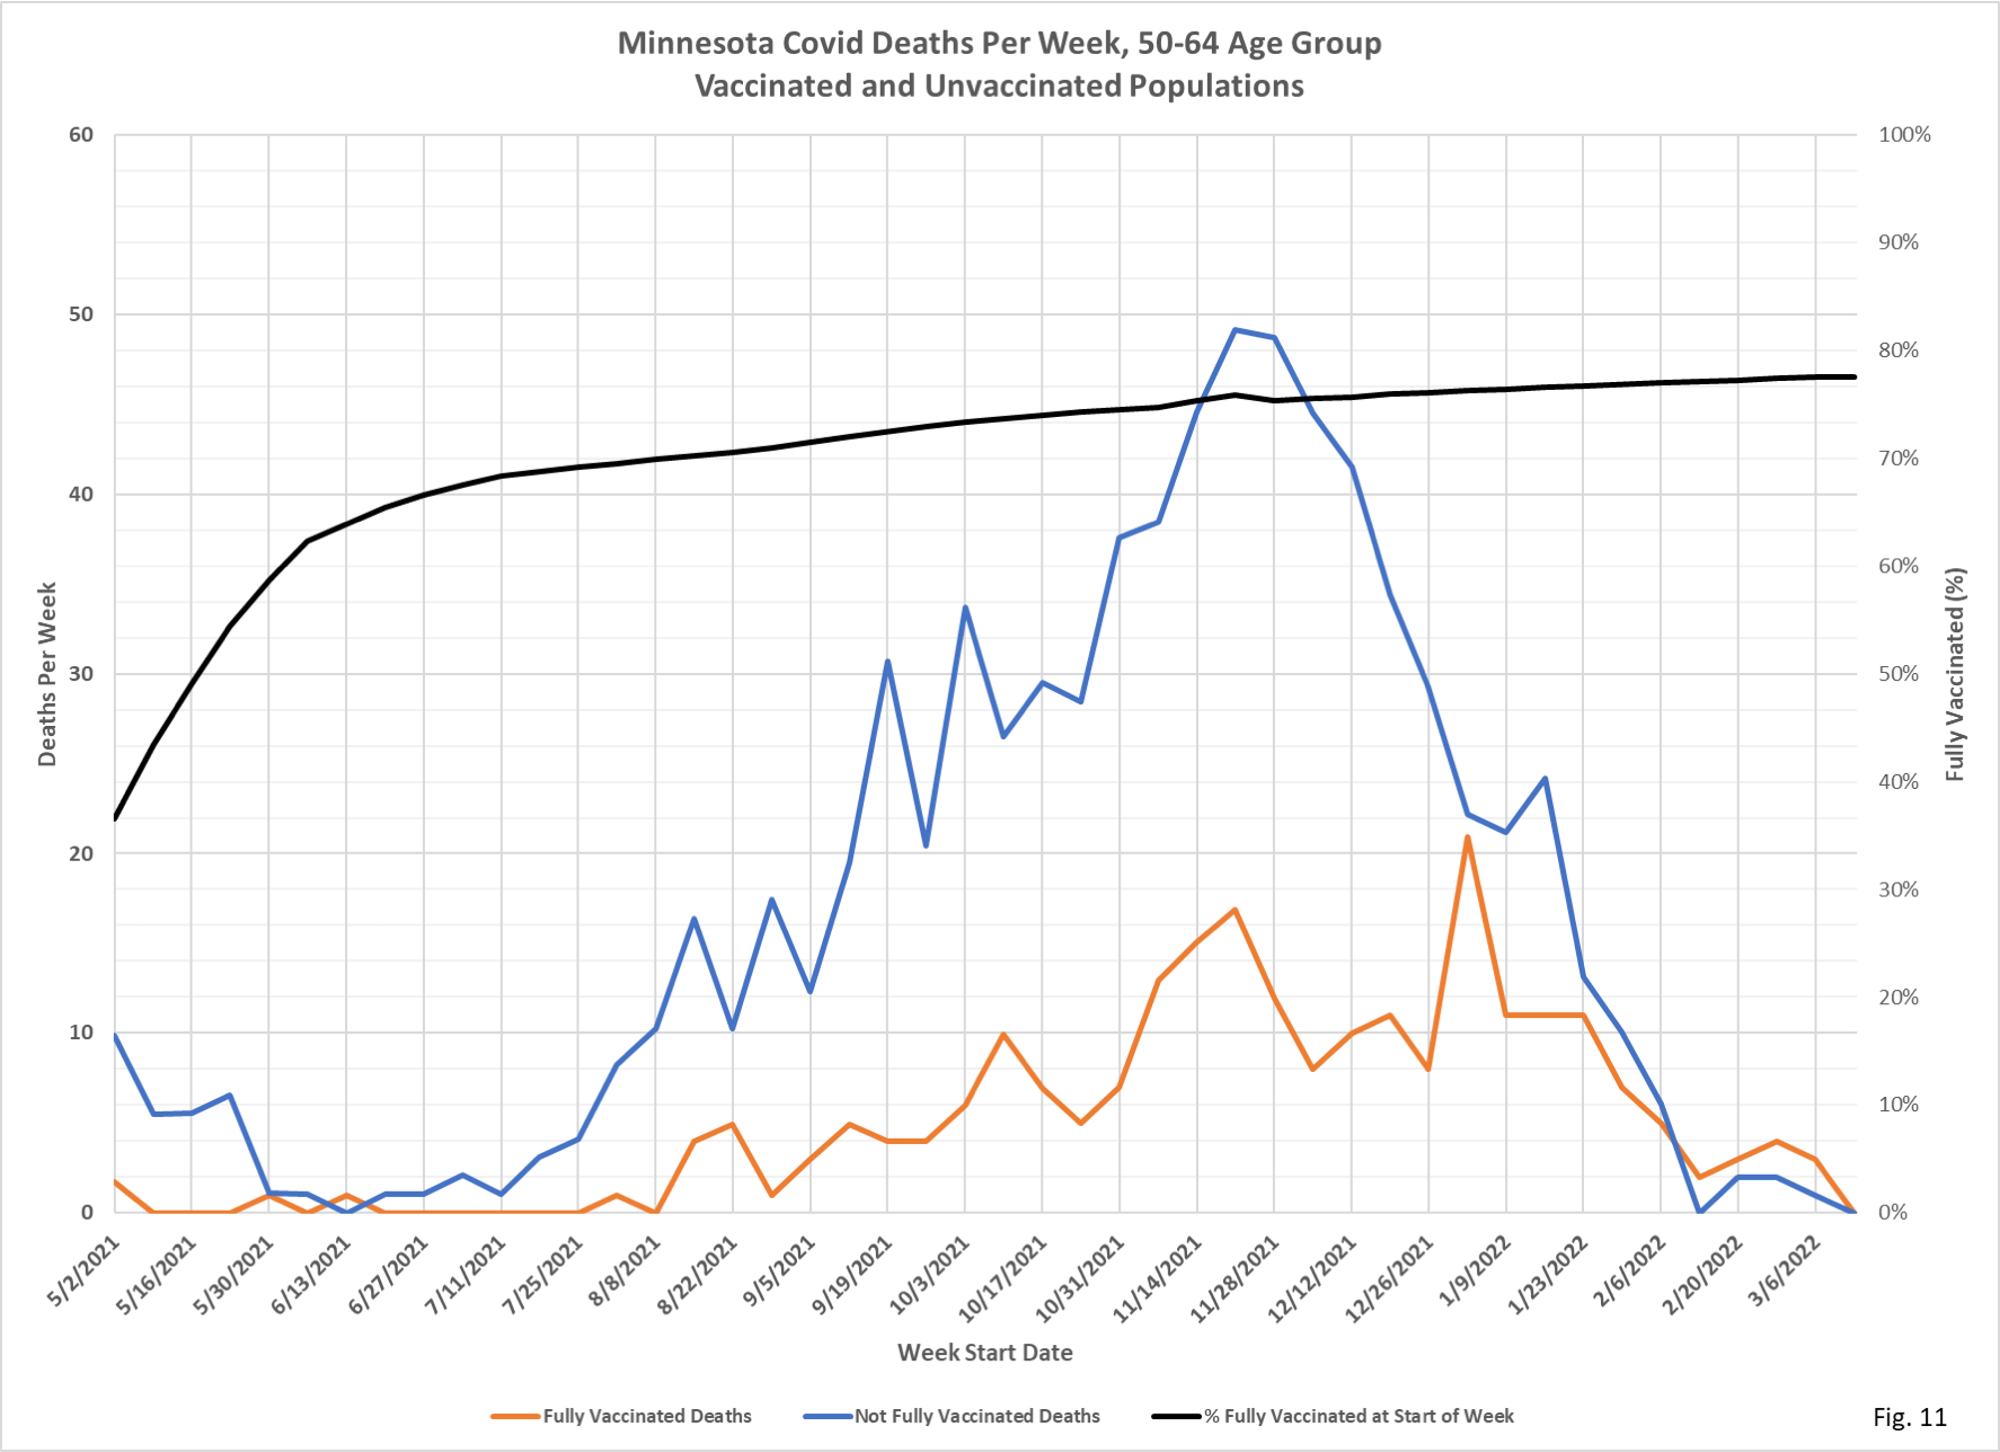
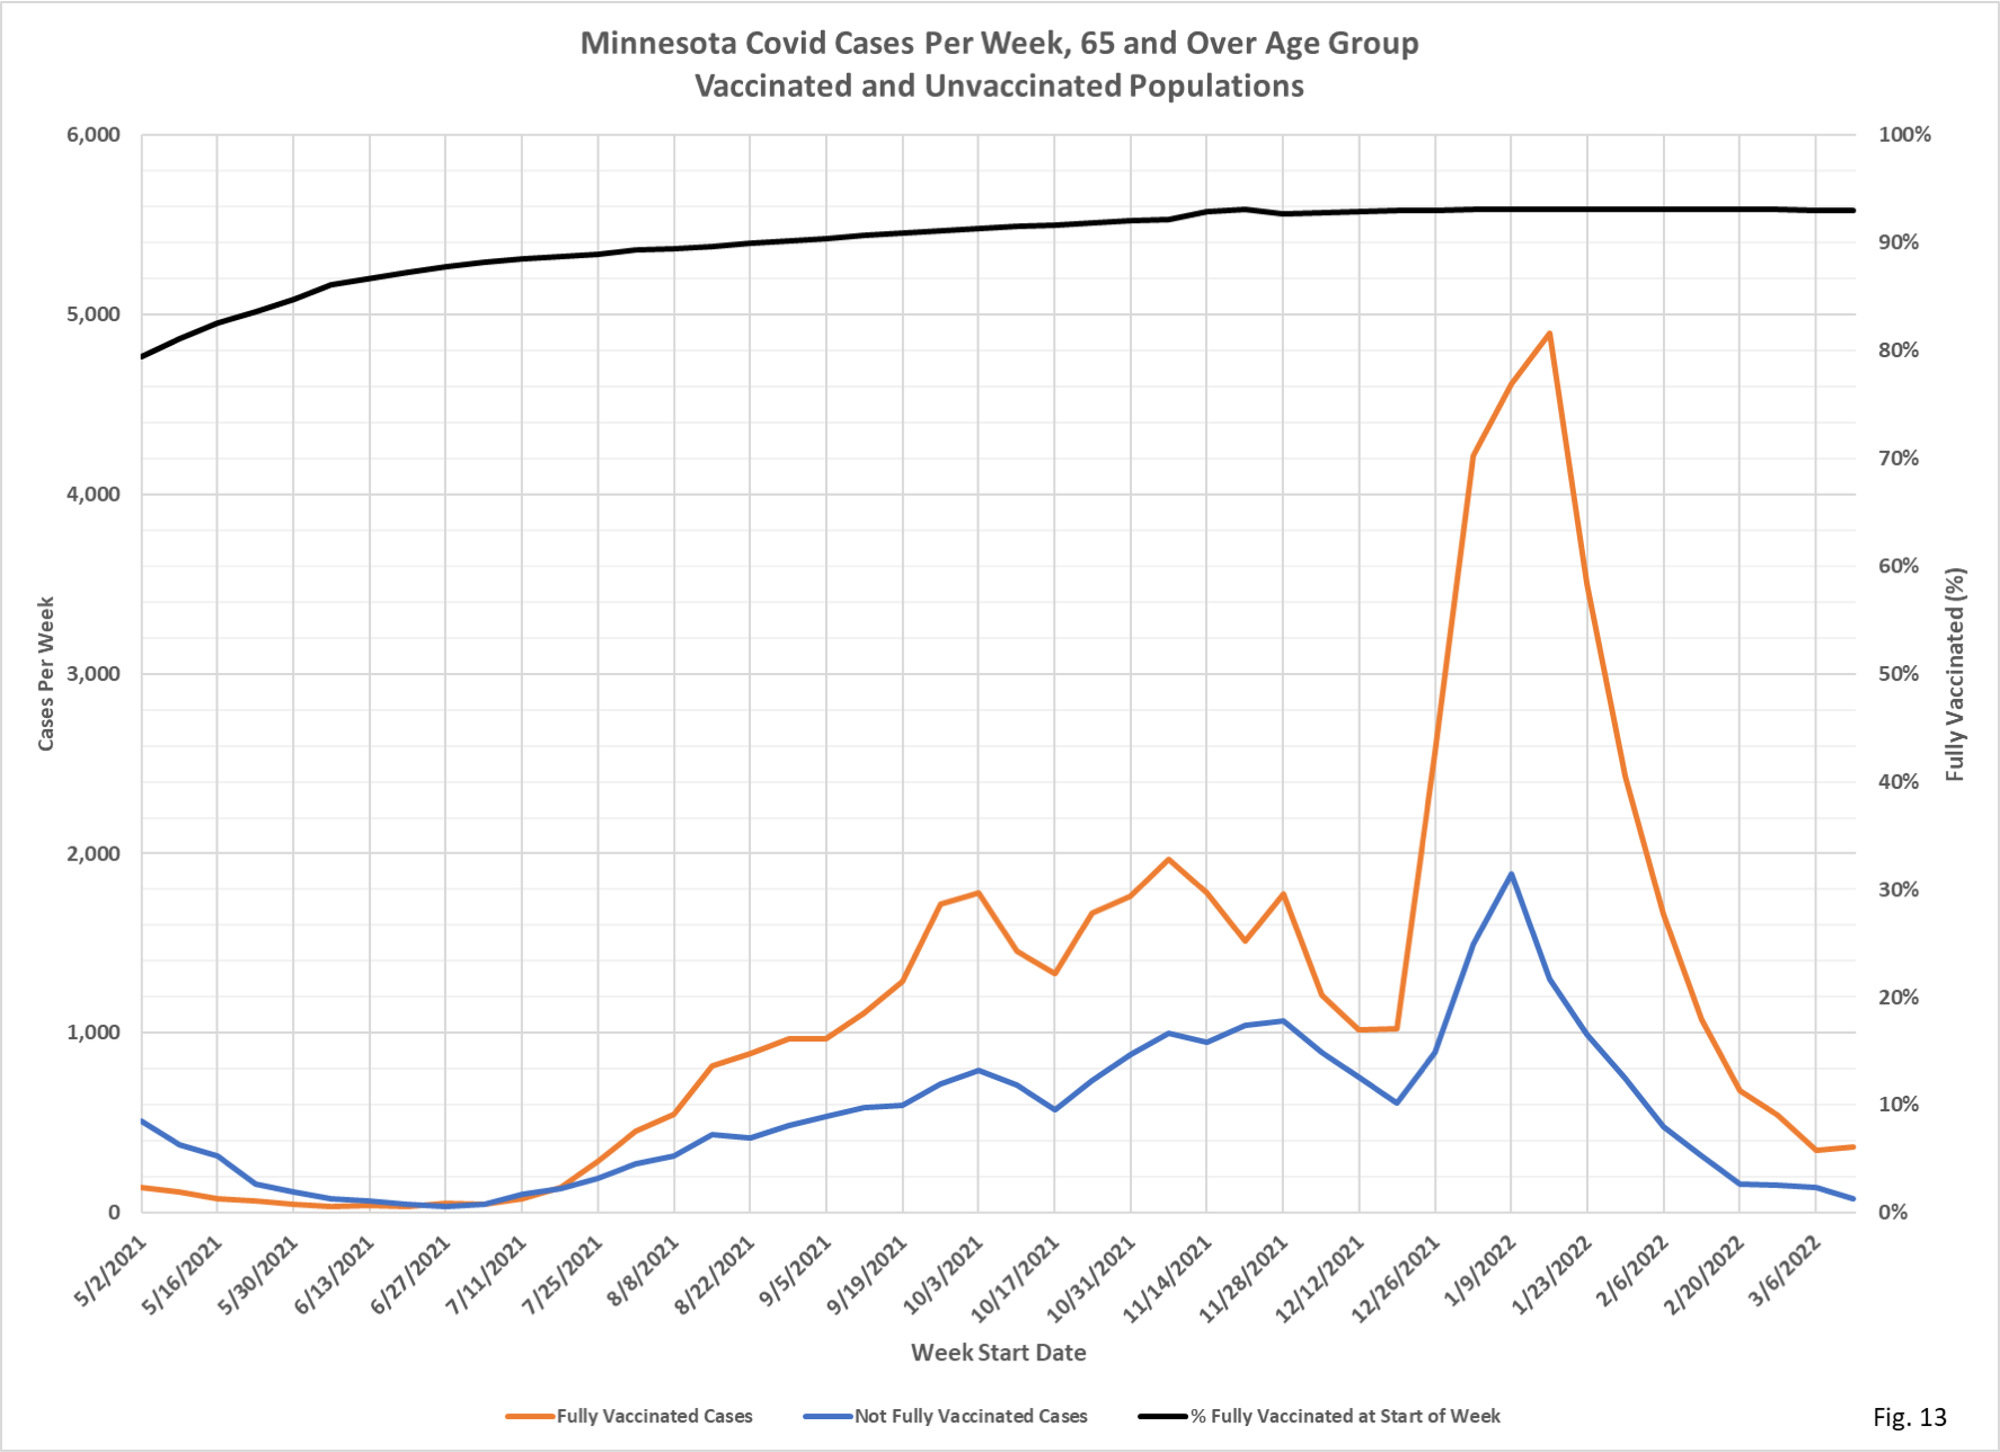
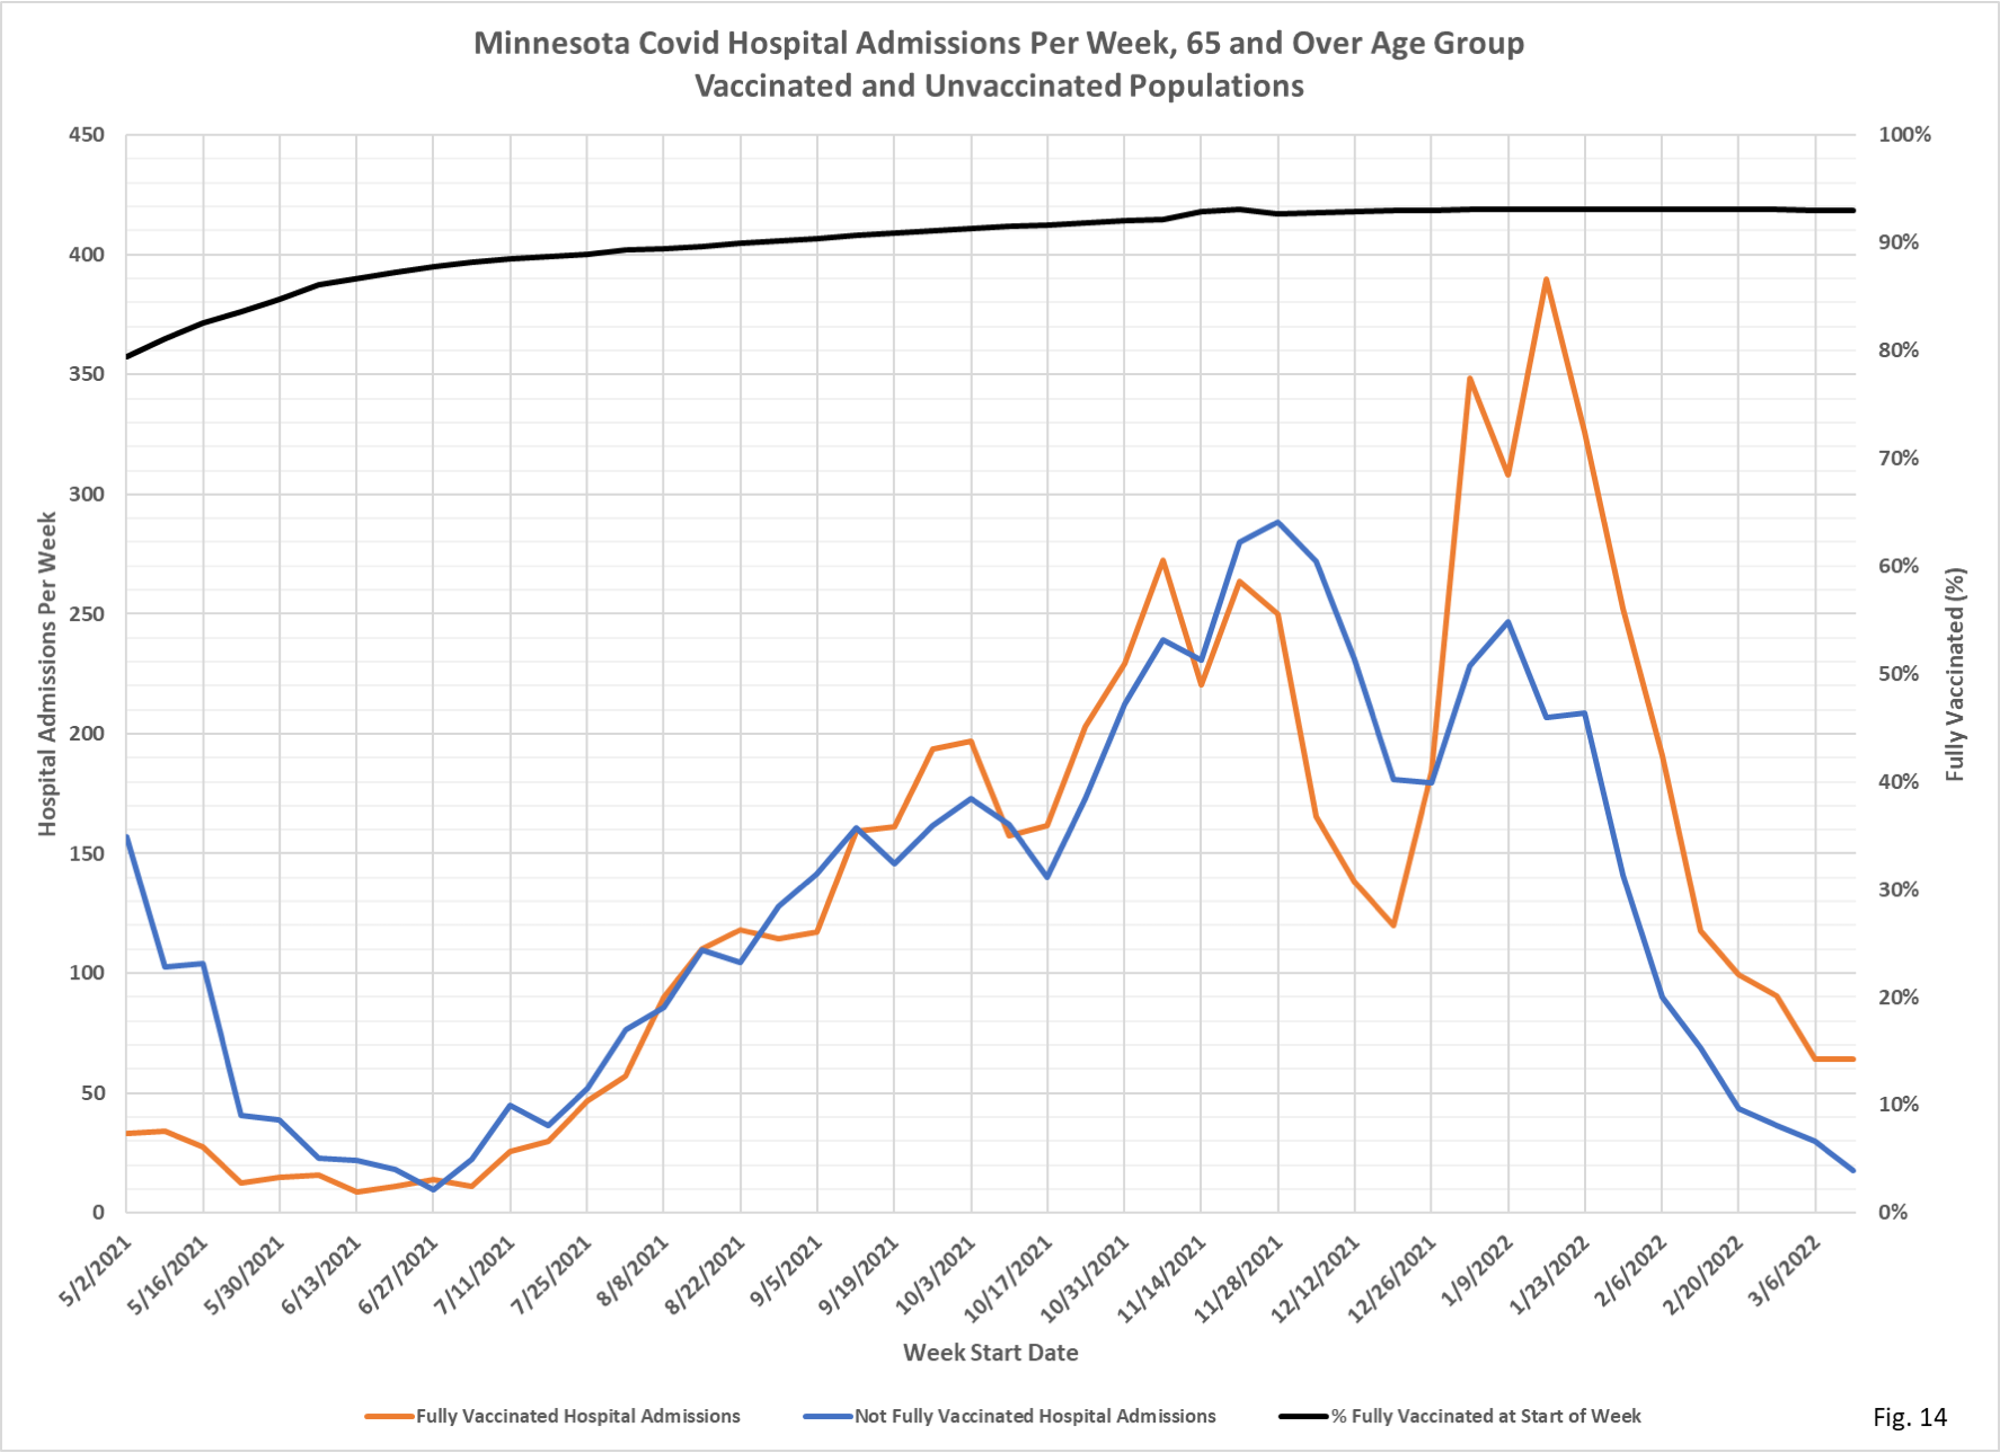
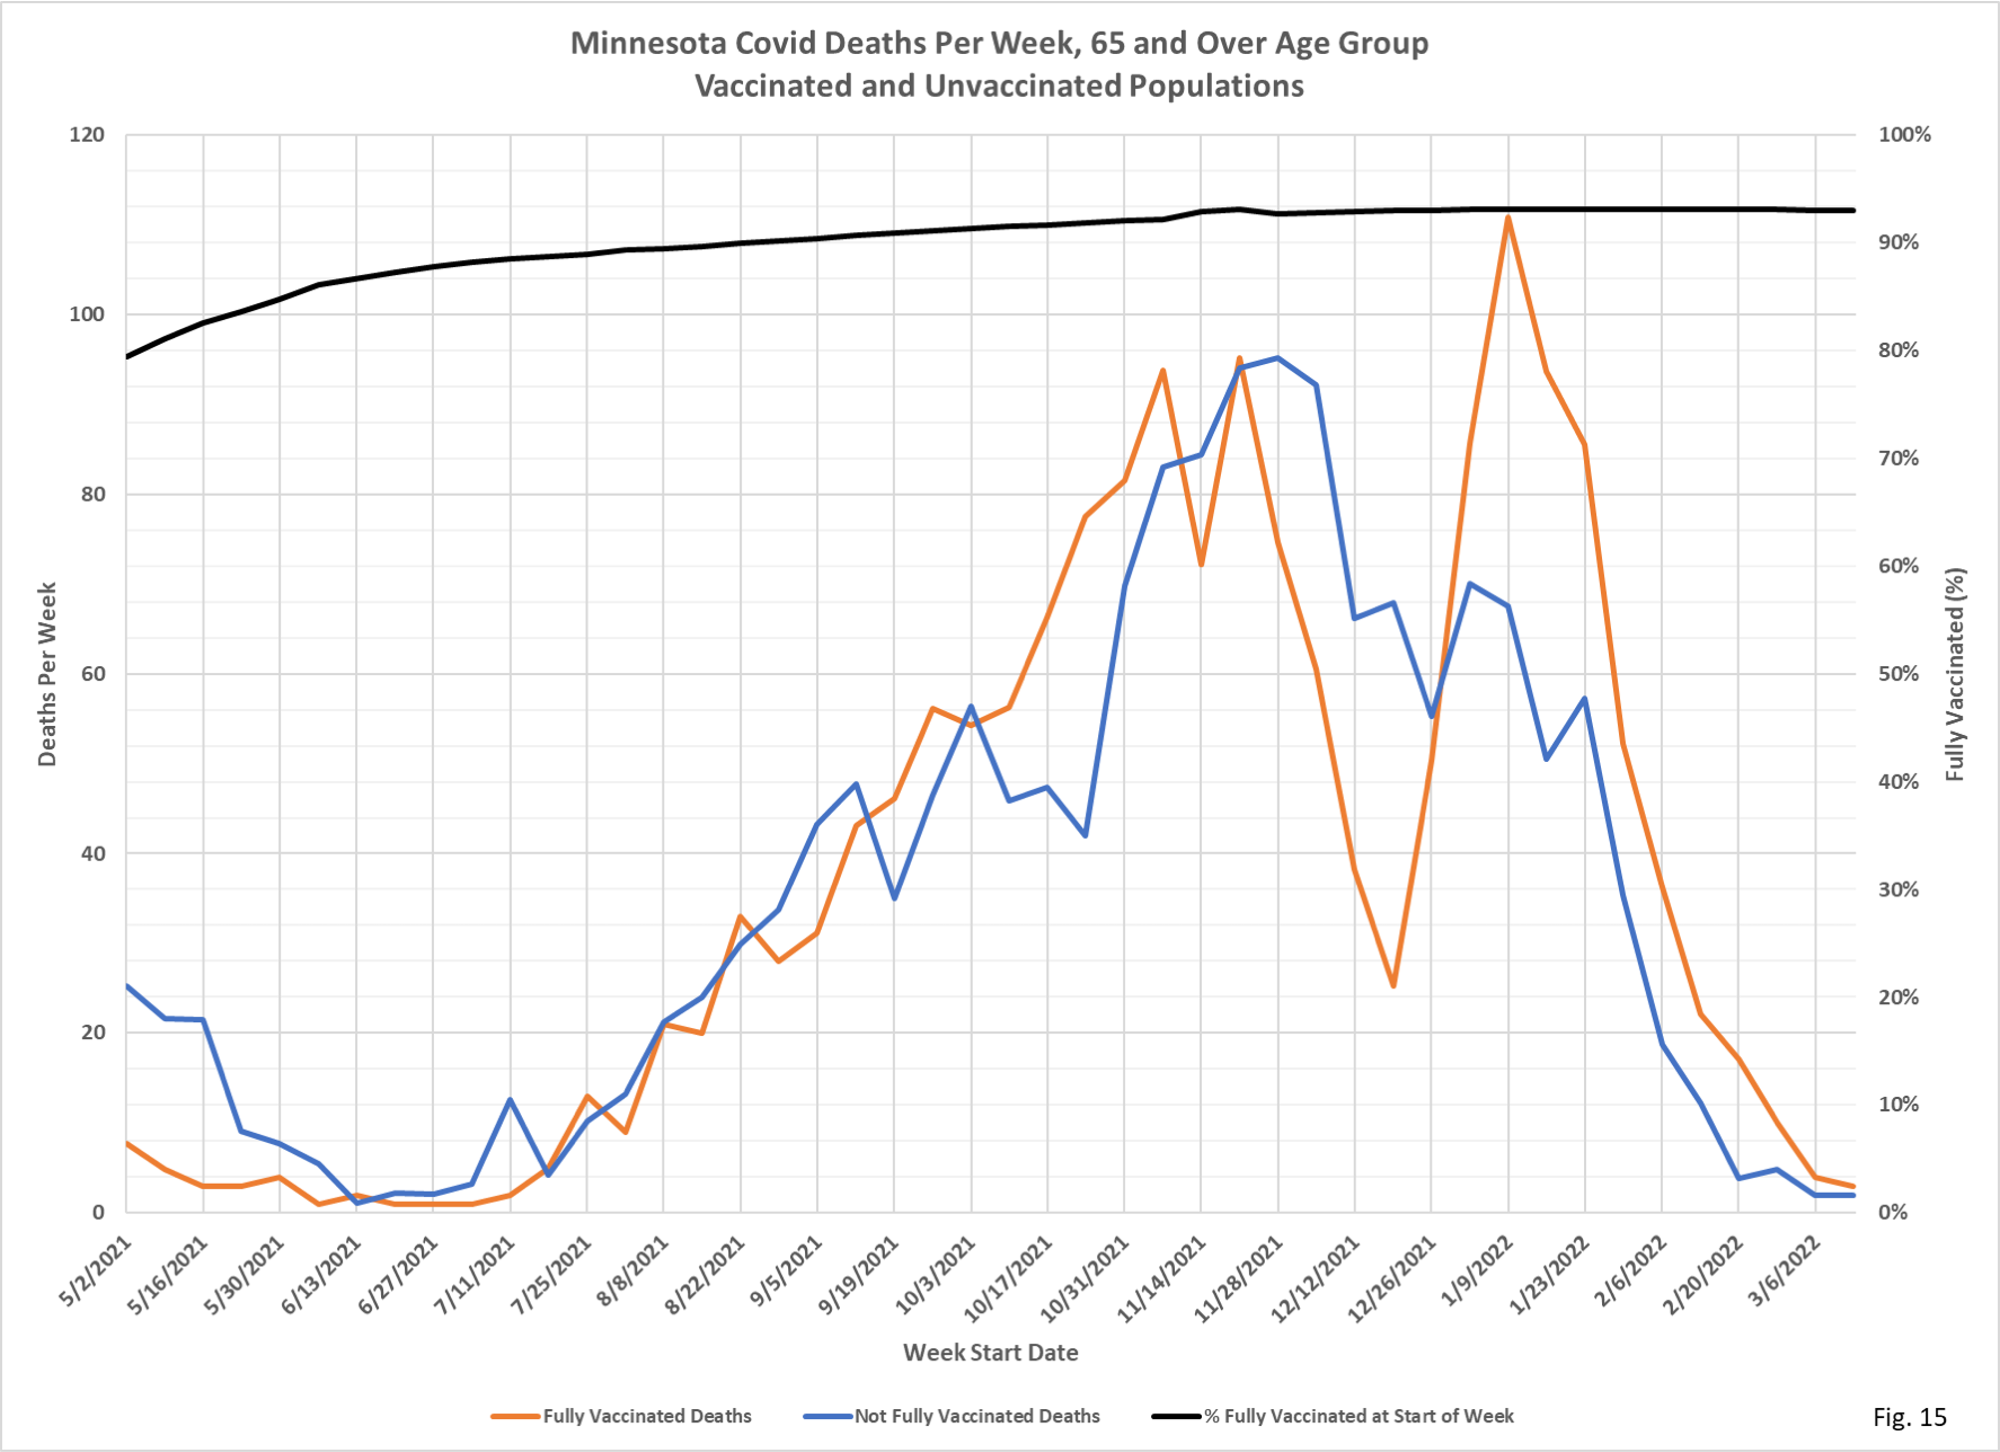
- In the charts that follow there are 4 slides for each age group; cases, hospital admissions, and deaths for the vaccinated and unvaccinated populations each week, and a single chart showing the breakthrough proportions each week.
- New the last few weeks is the addition of a curve on each chart showing the per cent of each age group that is fully vaccinated at the start of each week. Fully vaccinated is defined as completing their vaccination shots at least 14 days prior to the start of the week, but booster shots are not considered.
- Fig. 1 thru 4, 12-17 Age Group: Vaccinated cases exceed unvaccinated since 12/19/2021. Cases per week for both the vaccinated and unvaccinated are at very low rates. Vaccinated hospital admissions have exceeded unvaccinated admissions since 1/16/2022.
- Fig. 5 thru 8, 18-49 Age Group: Cases for both vaccinated and unvaccinated are at very low levels, with hospital admissions lagging behind somewhat. Deaths in this age group are very rare in recent weeks, whether vaccinated or not.
- Fig. 9 thru 12, 50-64 Age Group: The 50-64 age group charts appear quite similar to the 18-49 age group charts. Cases are at very low levels, while hospital admissions continue to decline. There are were zero deaths in this age group in the most recent week reported, based on this data.
- Fig. 13 thru 16, 65 and Over Age Group: Cases, hospitalizations, and deaths in this age group are still declining, in contrast to the other groups which have already levelled out.
- The data source for all charts is the data file vbtcirates.xlsx, found on the Minnesota Department of Health (MDH) web page: https://www.health.state.mn.
us/diseases/coronavirus/stats/ vbtcirates.xlsx , updated 4/18/2022. This data file gives the rates per 100k of cases, hospitalizations, and deaths in full vaccinated and not fully vaccinated people, broken out by age group. The rates per 100k in vbtcirates.xlsx are converted into cases, hospitalizations, and deaths by multiplying by the appropriate population. The number of vaccinated people by age group can found on the Vaccine Data page, https://mn.gov/covid19/ vaccine/data/index.jsp , in the data file People Vaccinated by Age. The unvaccinated population is found by taking the US Census American Community Survey 5-Year Estimate (Data Table S0101, https://data.census.gov/ cedsci/table) and subtracting the vaccinated population. The breakthrough proportion is then found by dividing the breakthrough events by the total of the breakthrough and non-breakthrough weekly events. - MDH defines a breakthrough event as a Covid case, hospital admission, or death that occurs 14 or more days after completing the vaccination series (not including boosters).

I’ve seen a great deal of data locally, statewide and nationally (Maryland is my home state) and I conclude that I don’t trust much of what I see. I spent a good part of my career in healthcare as an administrator, consultant and industrial engineer. From those experiences the single most important aspect of my work involved data integrity; clear and consistent attention to data and definitions used to create meaningful categories. There is no way, in the middle of a pandemic, that much of our data is accurate. Look no further than reimbursement incentives, insistence that off label drugs had no value, all of these and many more strategies drove people into hospitals and for some, death.
As with many things. the truth is easily overwhelmed by those who seek money and power. Eventually, as we are seeing now, truth reveals long after the fake condition those ne’er do wells created. Even common sense took a holiday. What critical thinking person would let someone inject them with a substance that has not undergone rigorous testing and without informed consent. My goodness, when I was a young boy my mom always impressed upon me and my sisters to never take any drink or substance from anyone unless you know where it came from. And yet, too many fell prey to fear and junk science. President Trump made what I believe is a life changing mistake for millions. Yes, he accomplishes a great deal but Operation Warp Speed will prove to have long term health consequences. This was one instance in which I believe, speed kills.
Still, today, there is NO emphasis from “public health officials” about the need to lose weight, take D3, Zinc, Magnesium, Quercetin and other OTC products. There is NO interest in highly respected scientist who don’t support the main stream narrative. In fact to disagree means banishment. We are living and suffering within an unconstitutional and corrupt system. If we refuse to take better care of ourselves, stand up for our rights and challenge what we have been told we deserve the end result.
Fascinating how this year’s cycle trough has the ‘Blue” line under the ‘Orange” line in every chart … hummm!