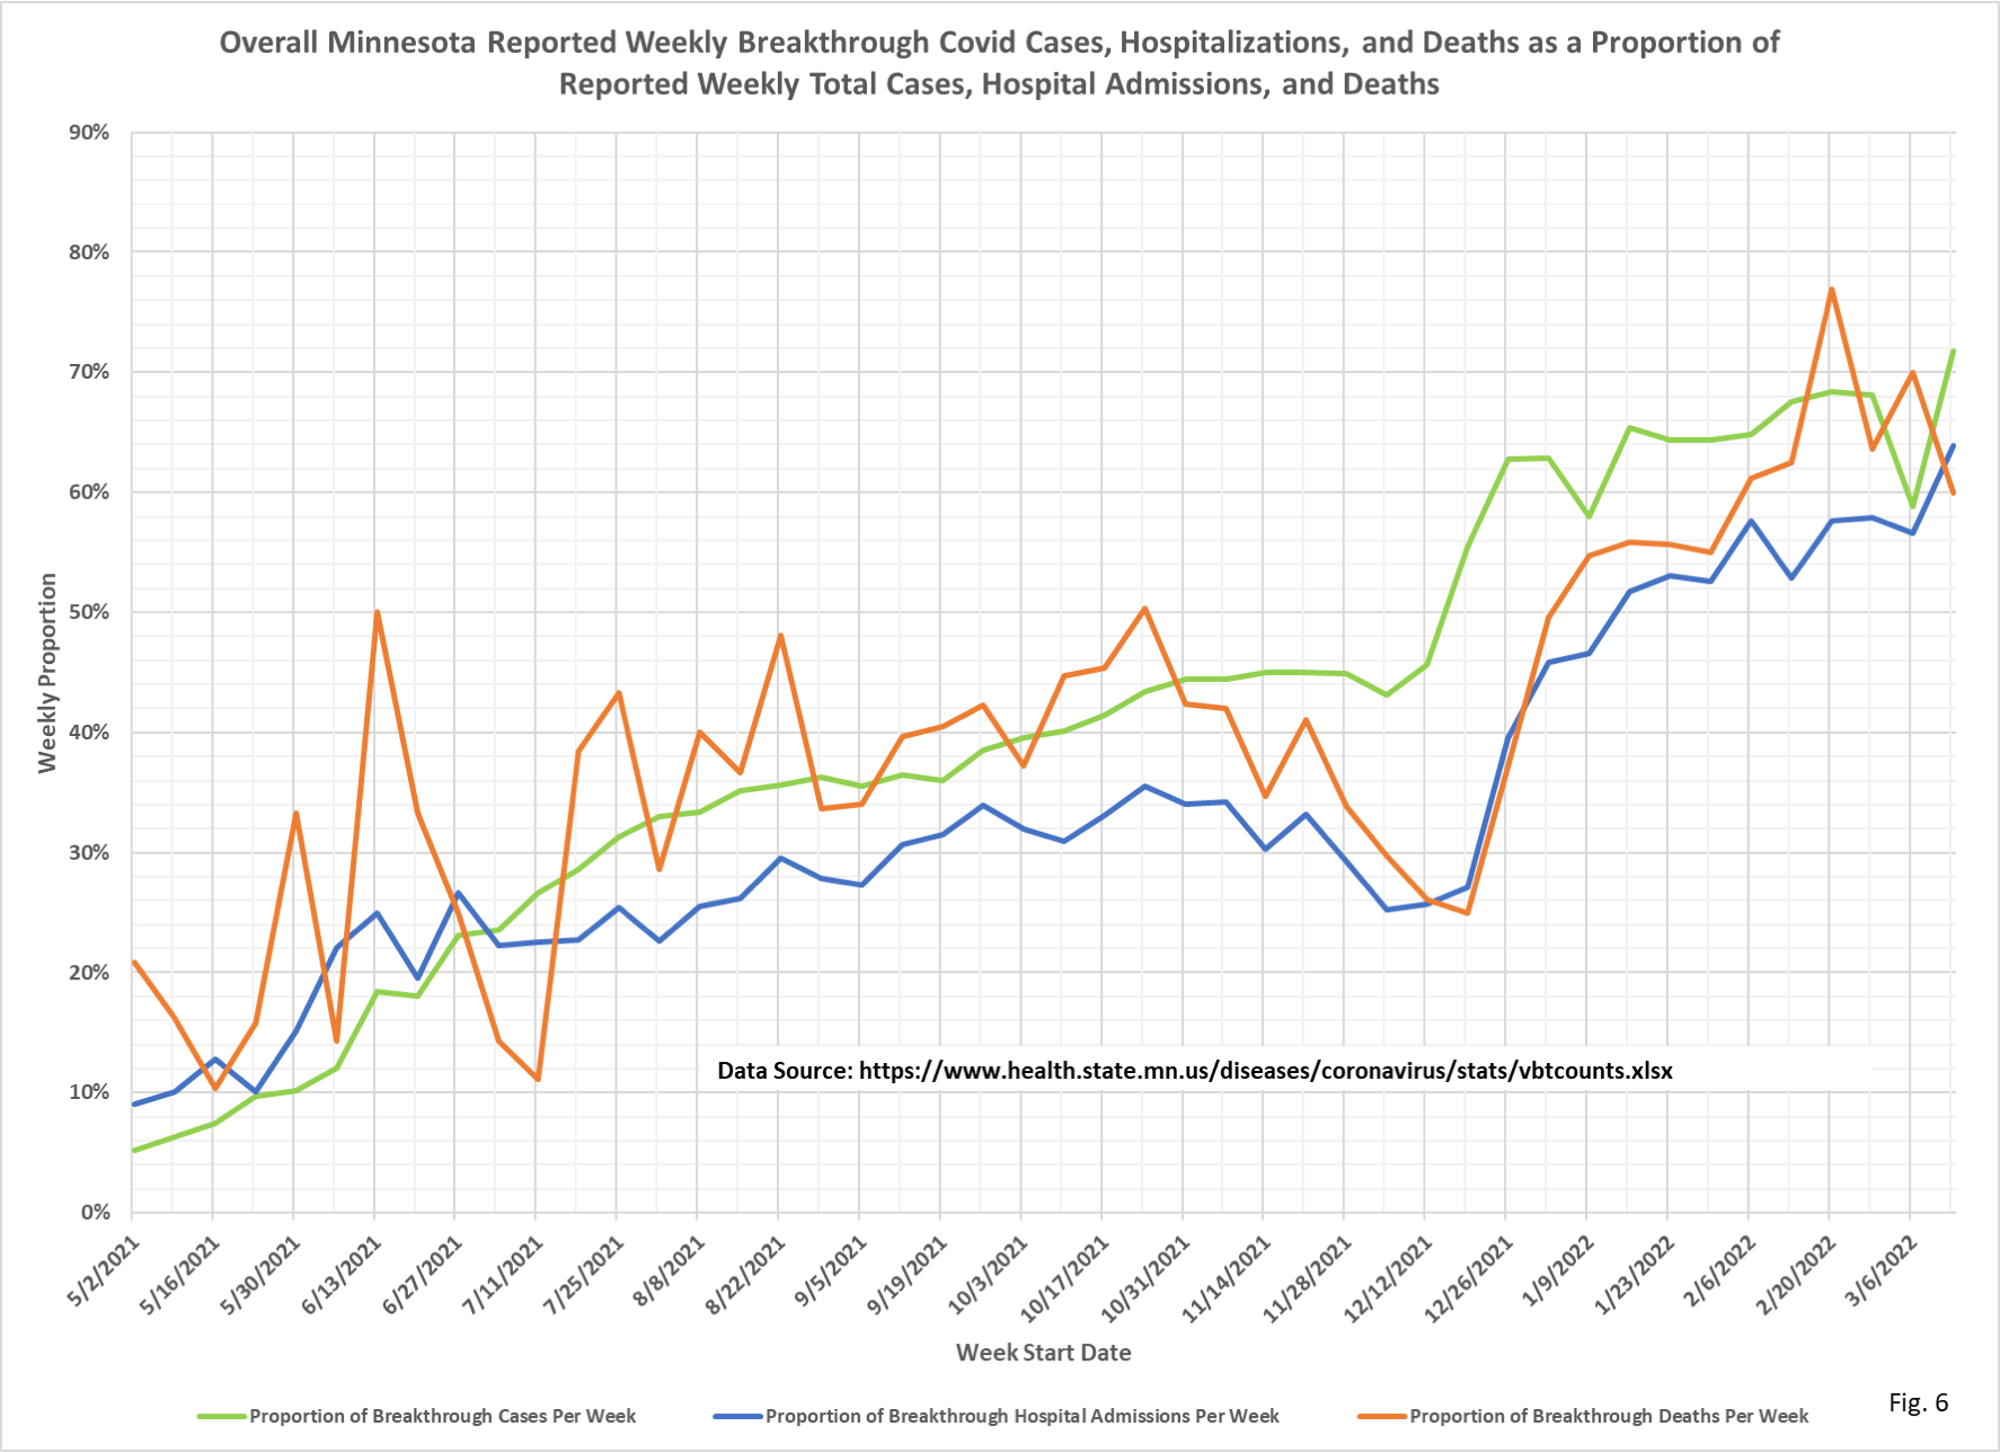
The proportion of events in the vaxed continues to rise, and is approaching the levels of vaccination in the population.
 Dave’s notes:
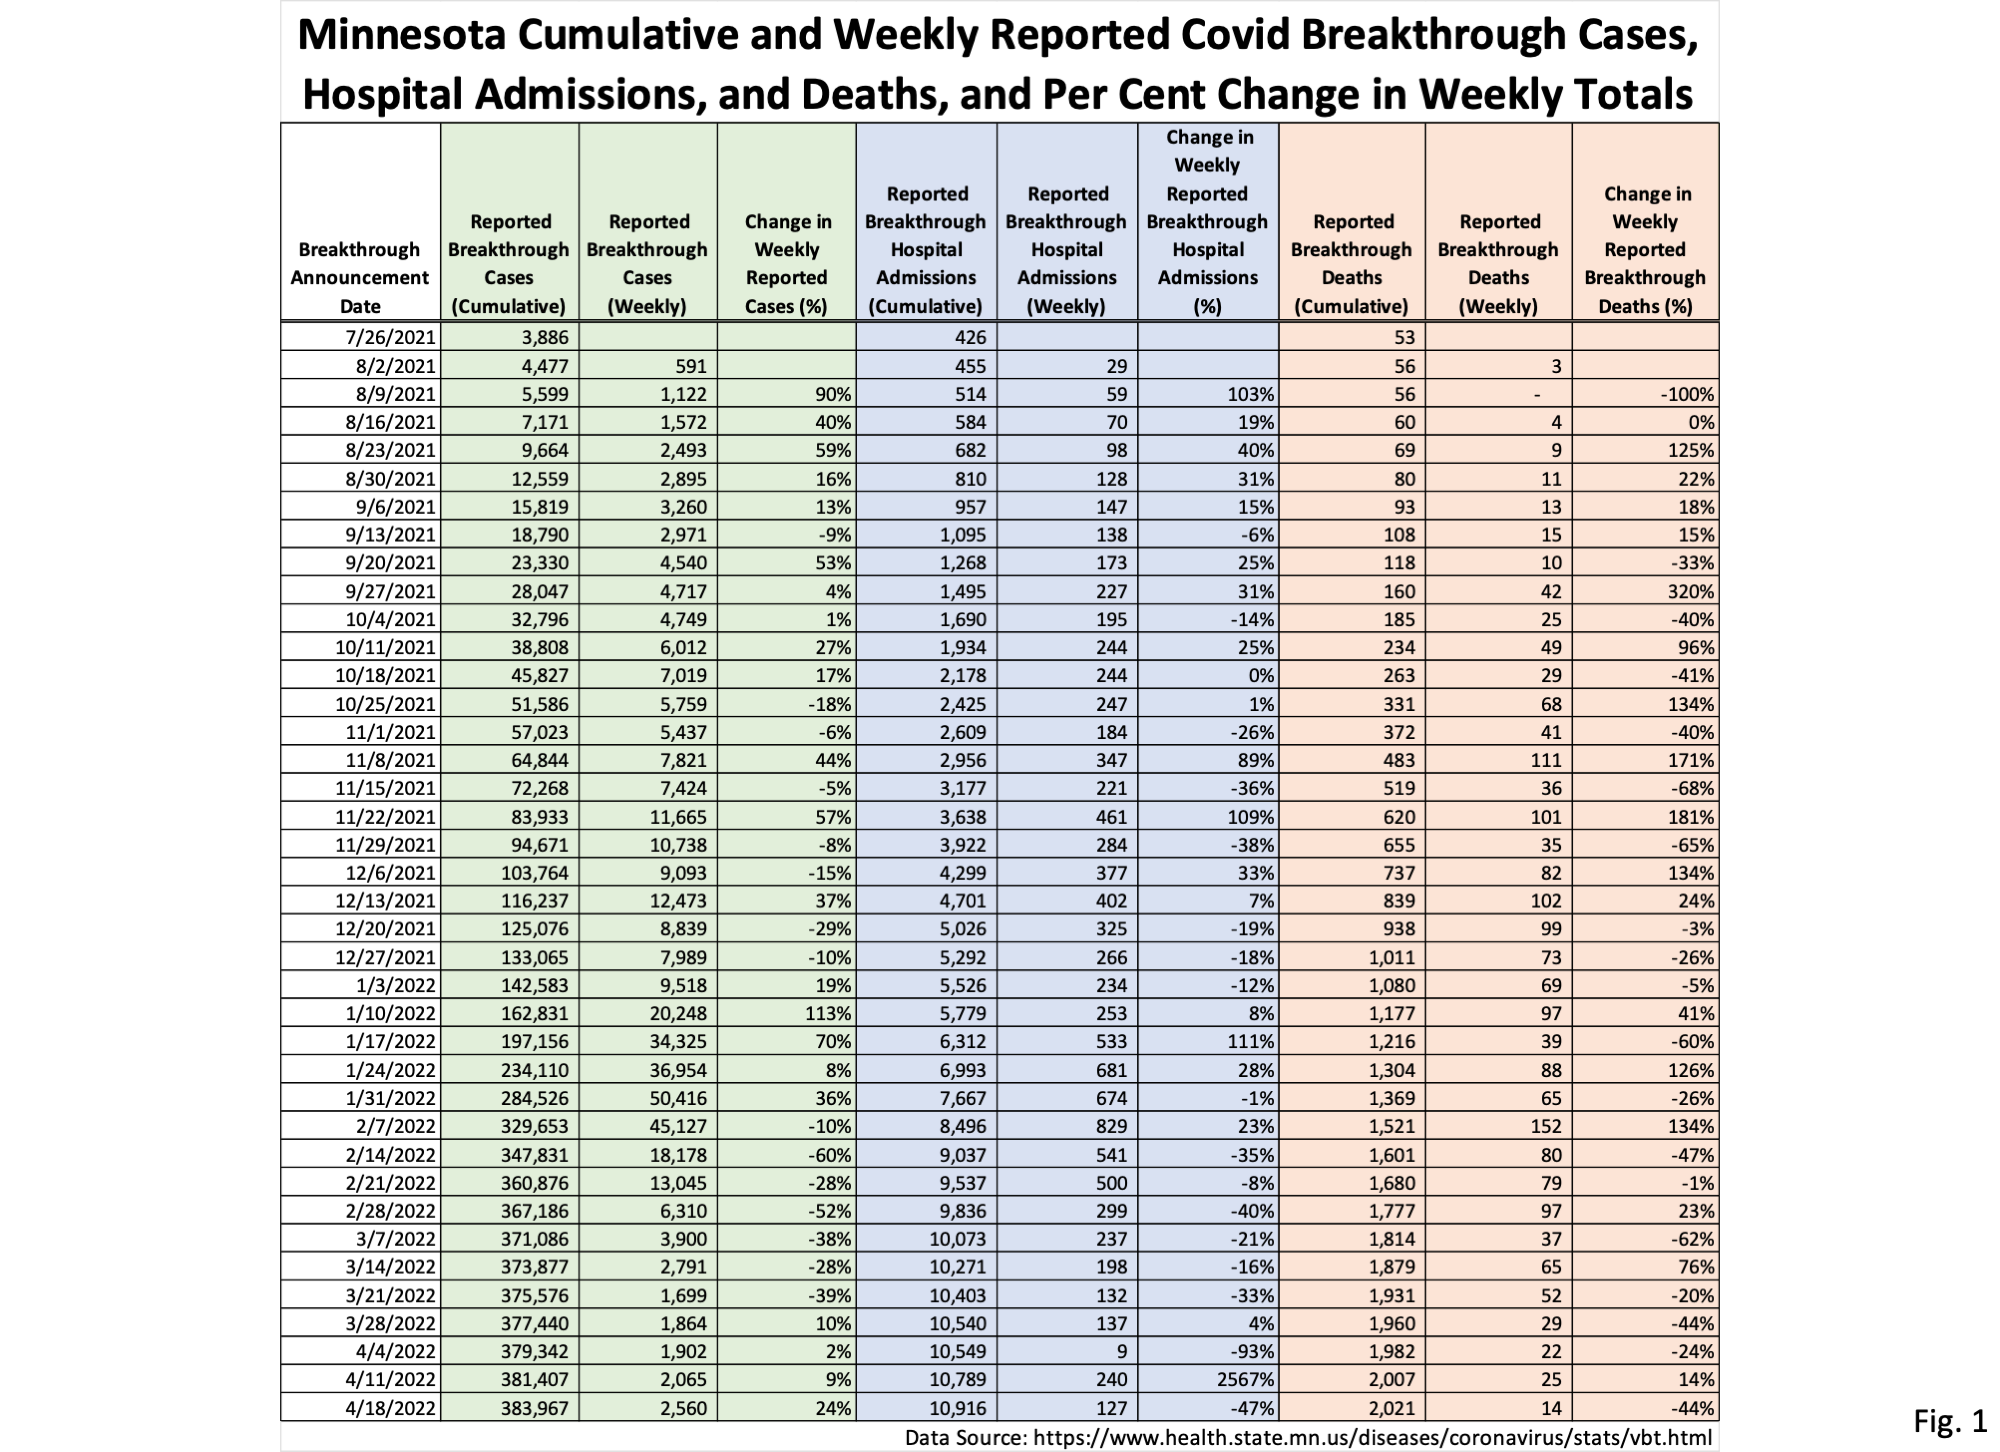
- Fig. 1: This table is the weekly announced cumulative breakthrough cases, hospital admissions, and deaths, as well as the weekly totals, and change in weekly totals, as published on the Vaccine Breakthrough Update web page https://www.health.state.mn.
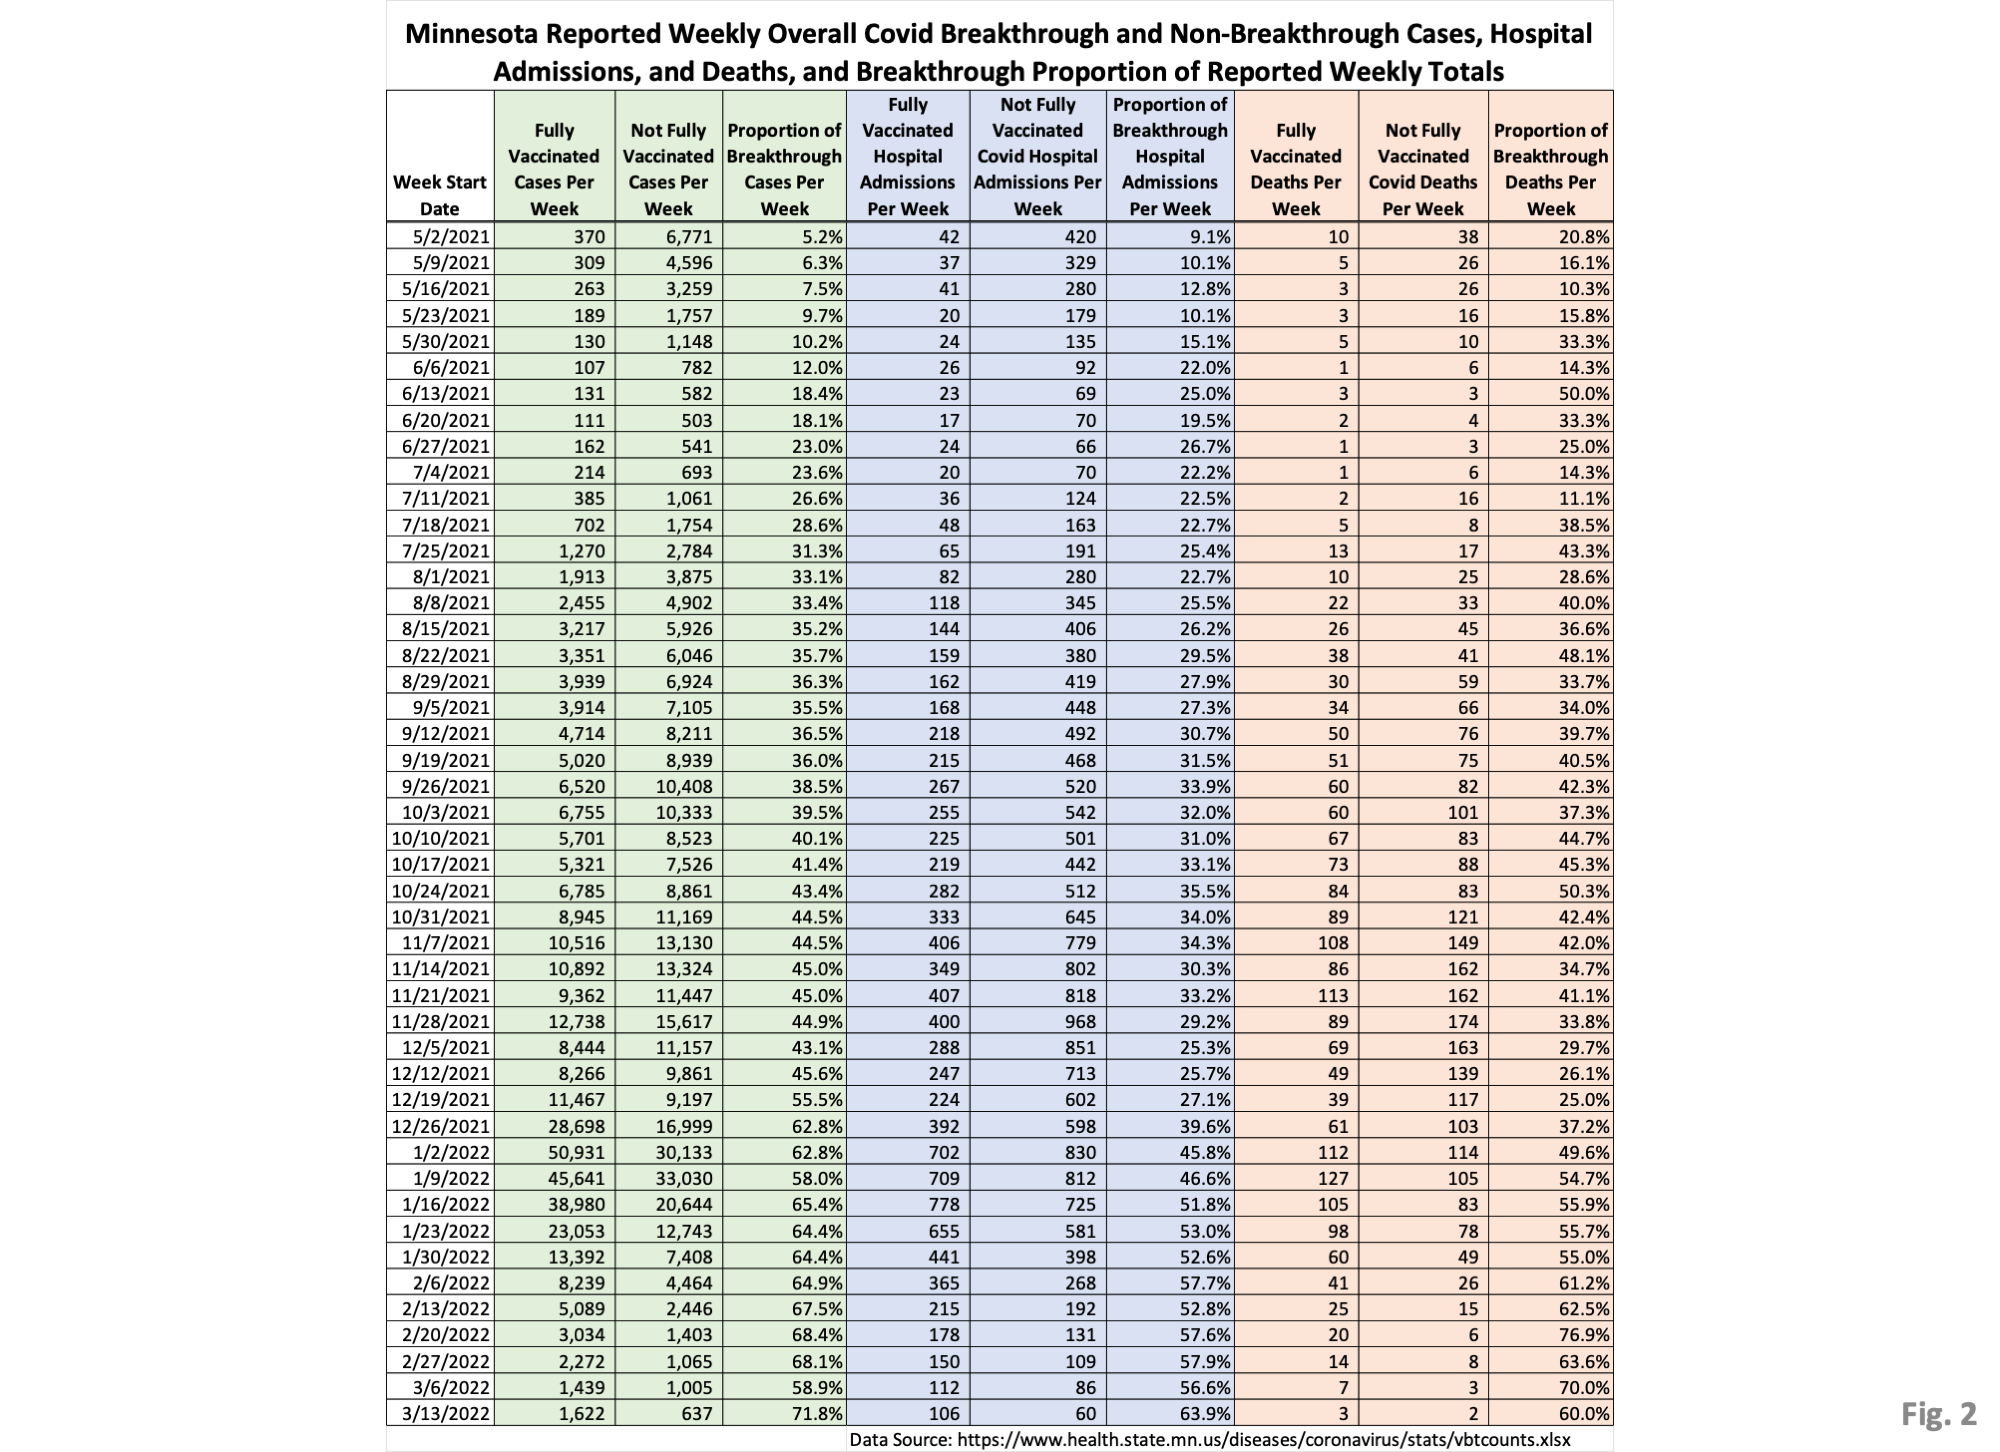
us/diseases/coronavirus/stats/ vbt.html. New breakthrough cases announced on 4/18/2022 total 2,560 cases, up from 2,065 new breakthrough cases last week. Note that newly reported breakthrough cases have been increasing for 5 weeks in a row. New breakthrough hospital admissions total 127 for the week, and have been highly variable the last several weeks. New breakthrough deaths totaled 14, compared to 25 reported breakthrough deaths last week. - Fig. 2: This table displays the total cases, hospital admissions, and deaths that occurred each week among the vaccinated and unvaccinated populations. These numbers are taken from the vbtcounts.xlsx data file published by MDH on the Vaccine Breakthrough Update web page. We noted weeks ago that we discovered an apparent discrepancy in MDH’s published data compared to a data we obtained through a Government Data Practices Act request. We still believe that there are missing breakthrough cases, hospital admissions, and deaths that are not reported in this data, but there has no response from MDH about our concerns. Note that a majority of cases, hospitalizations, and deaths continue to be among the vaccinated each week.
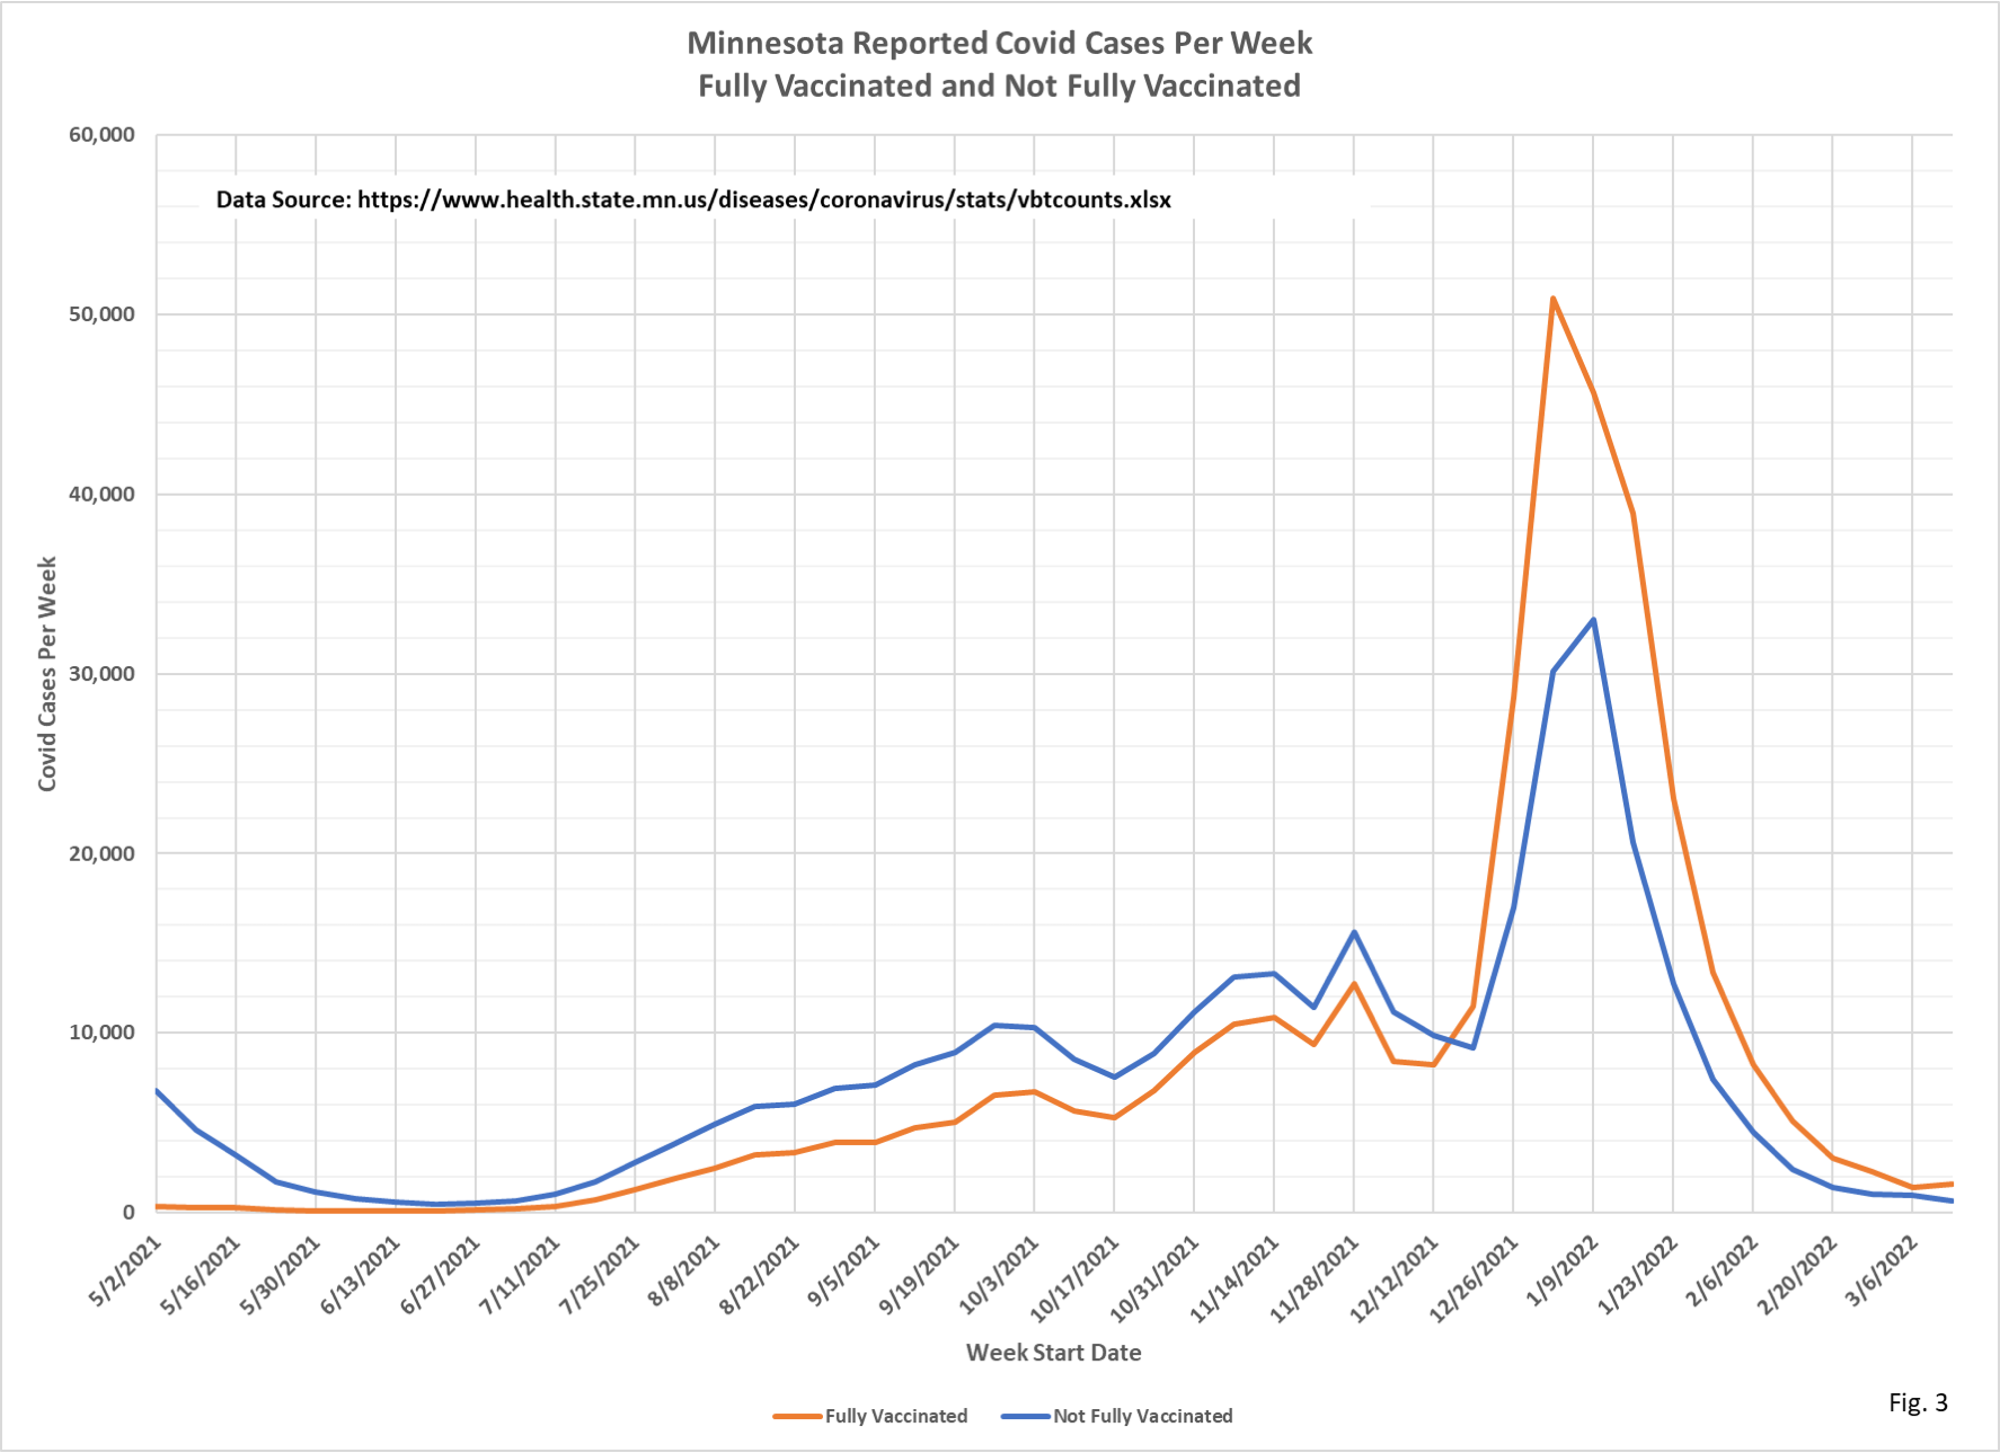
- Fig. 3: This chart simply plots the cases among the vaccinated and unvaccinated populations each week, as found in Fig. 2. Cases among the vaccinated increased very slightly for the week of 3/13/2022.
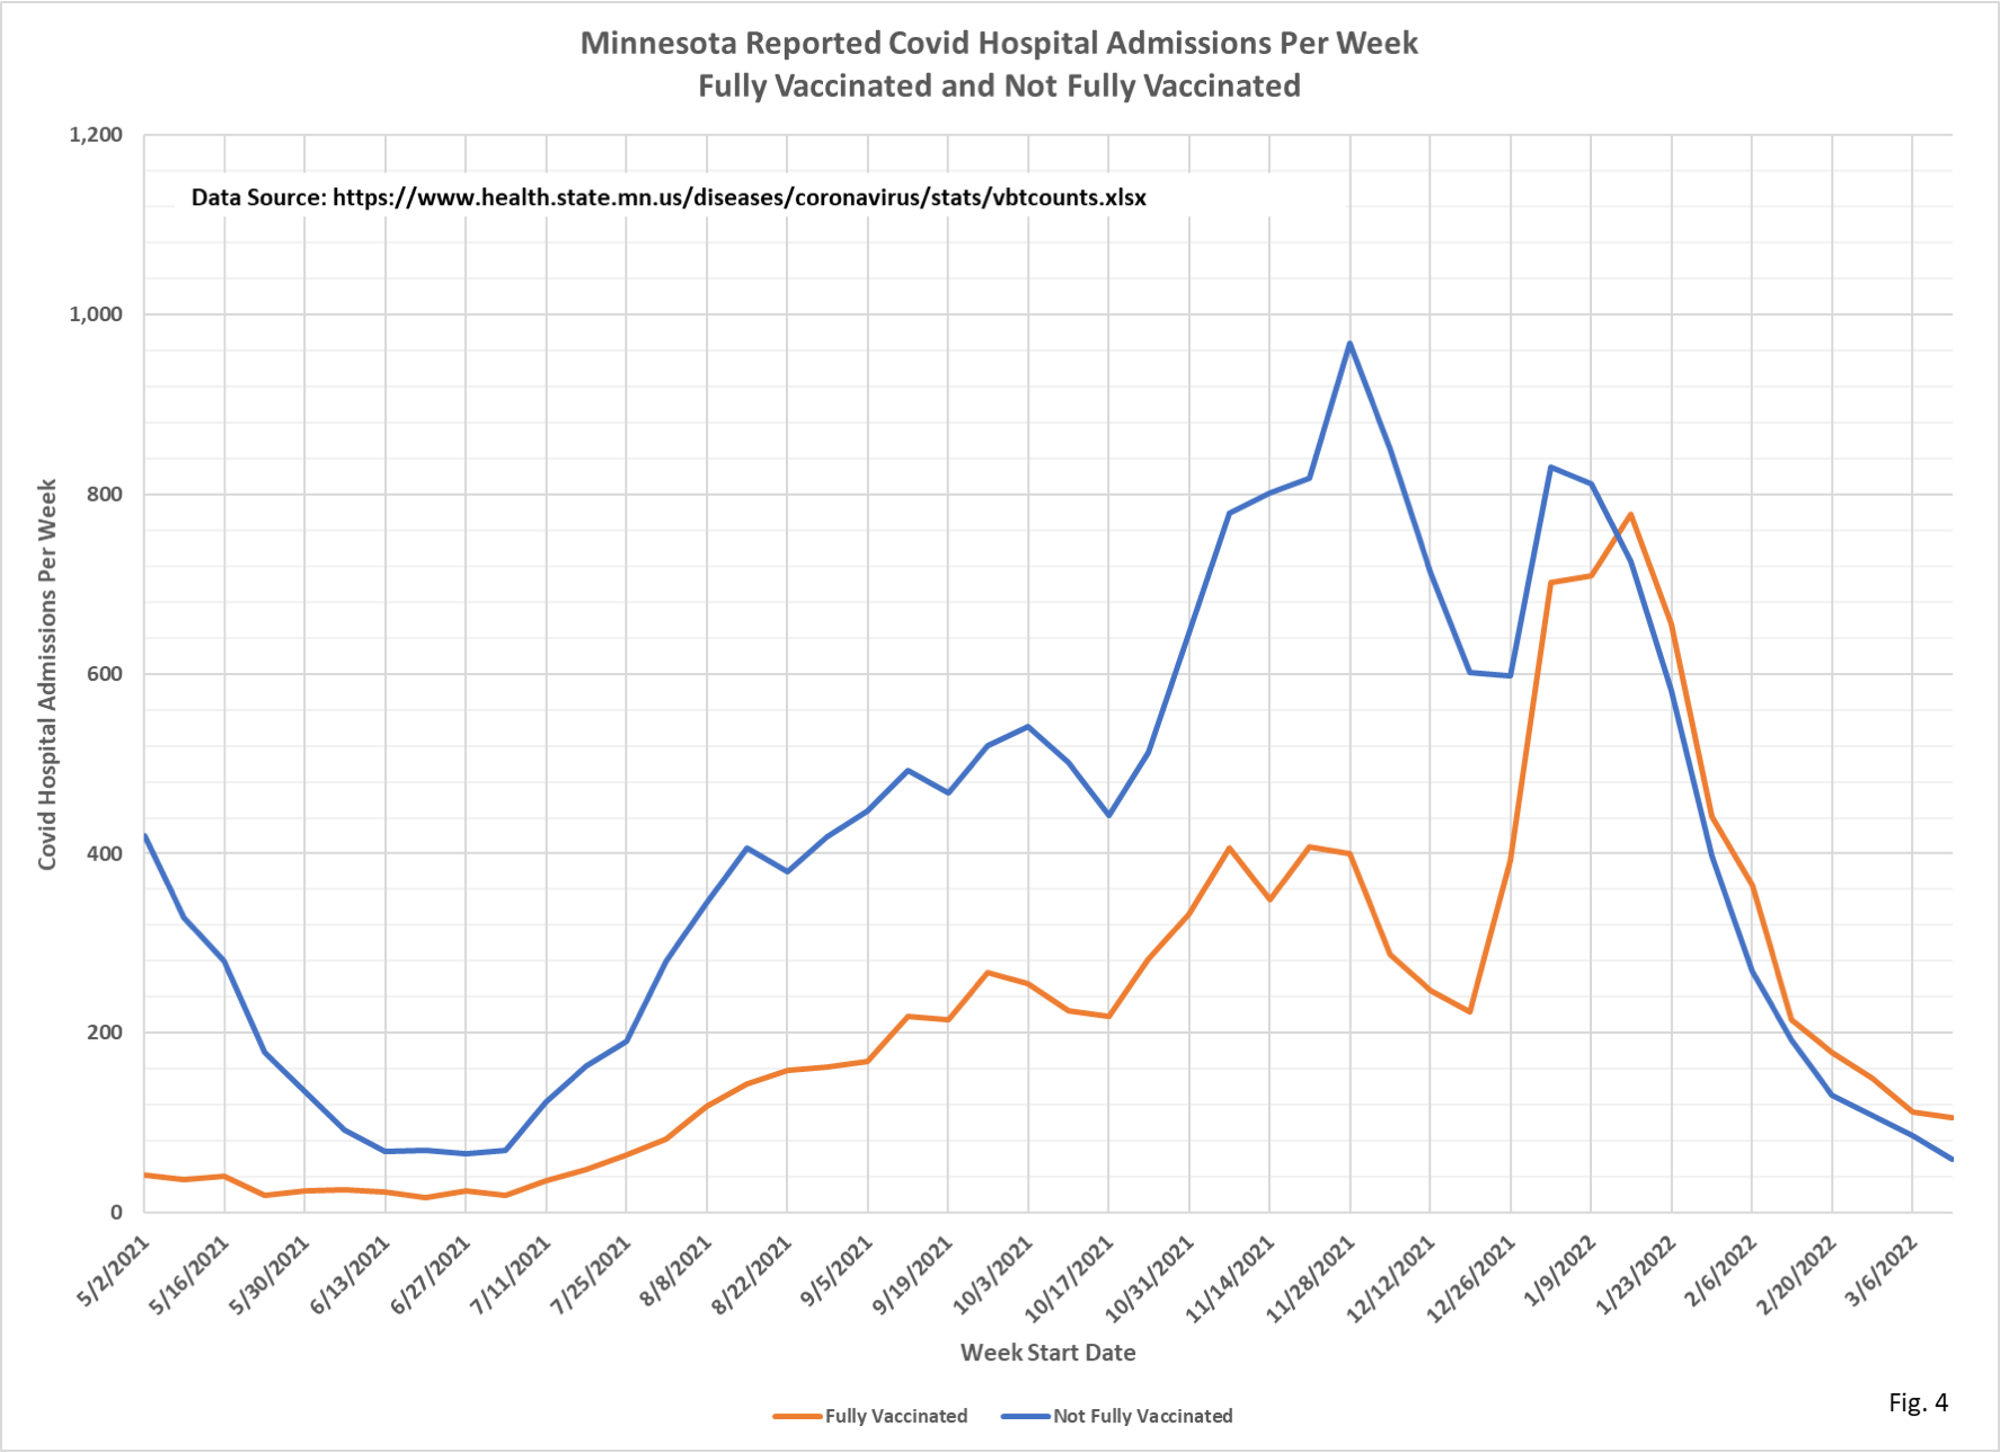
- Fig. 4: This chart displays the hospital admissions among the vaccinated and unvaccinated populations each week from the data in Fig. 2. For the week of 3/13/2022 hospital admissions were still declining, lagging behind the decline in cases.
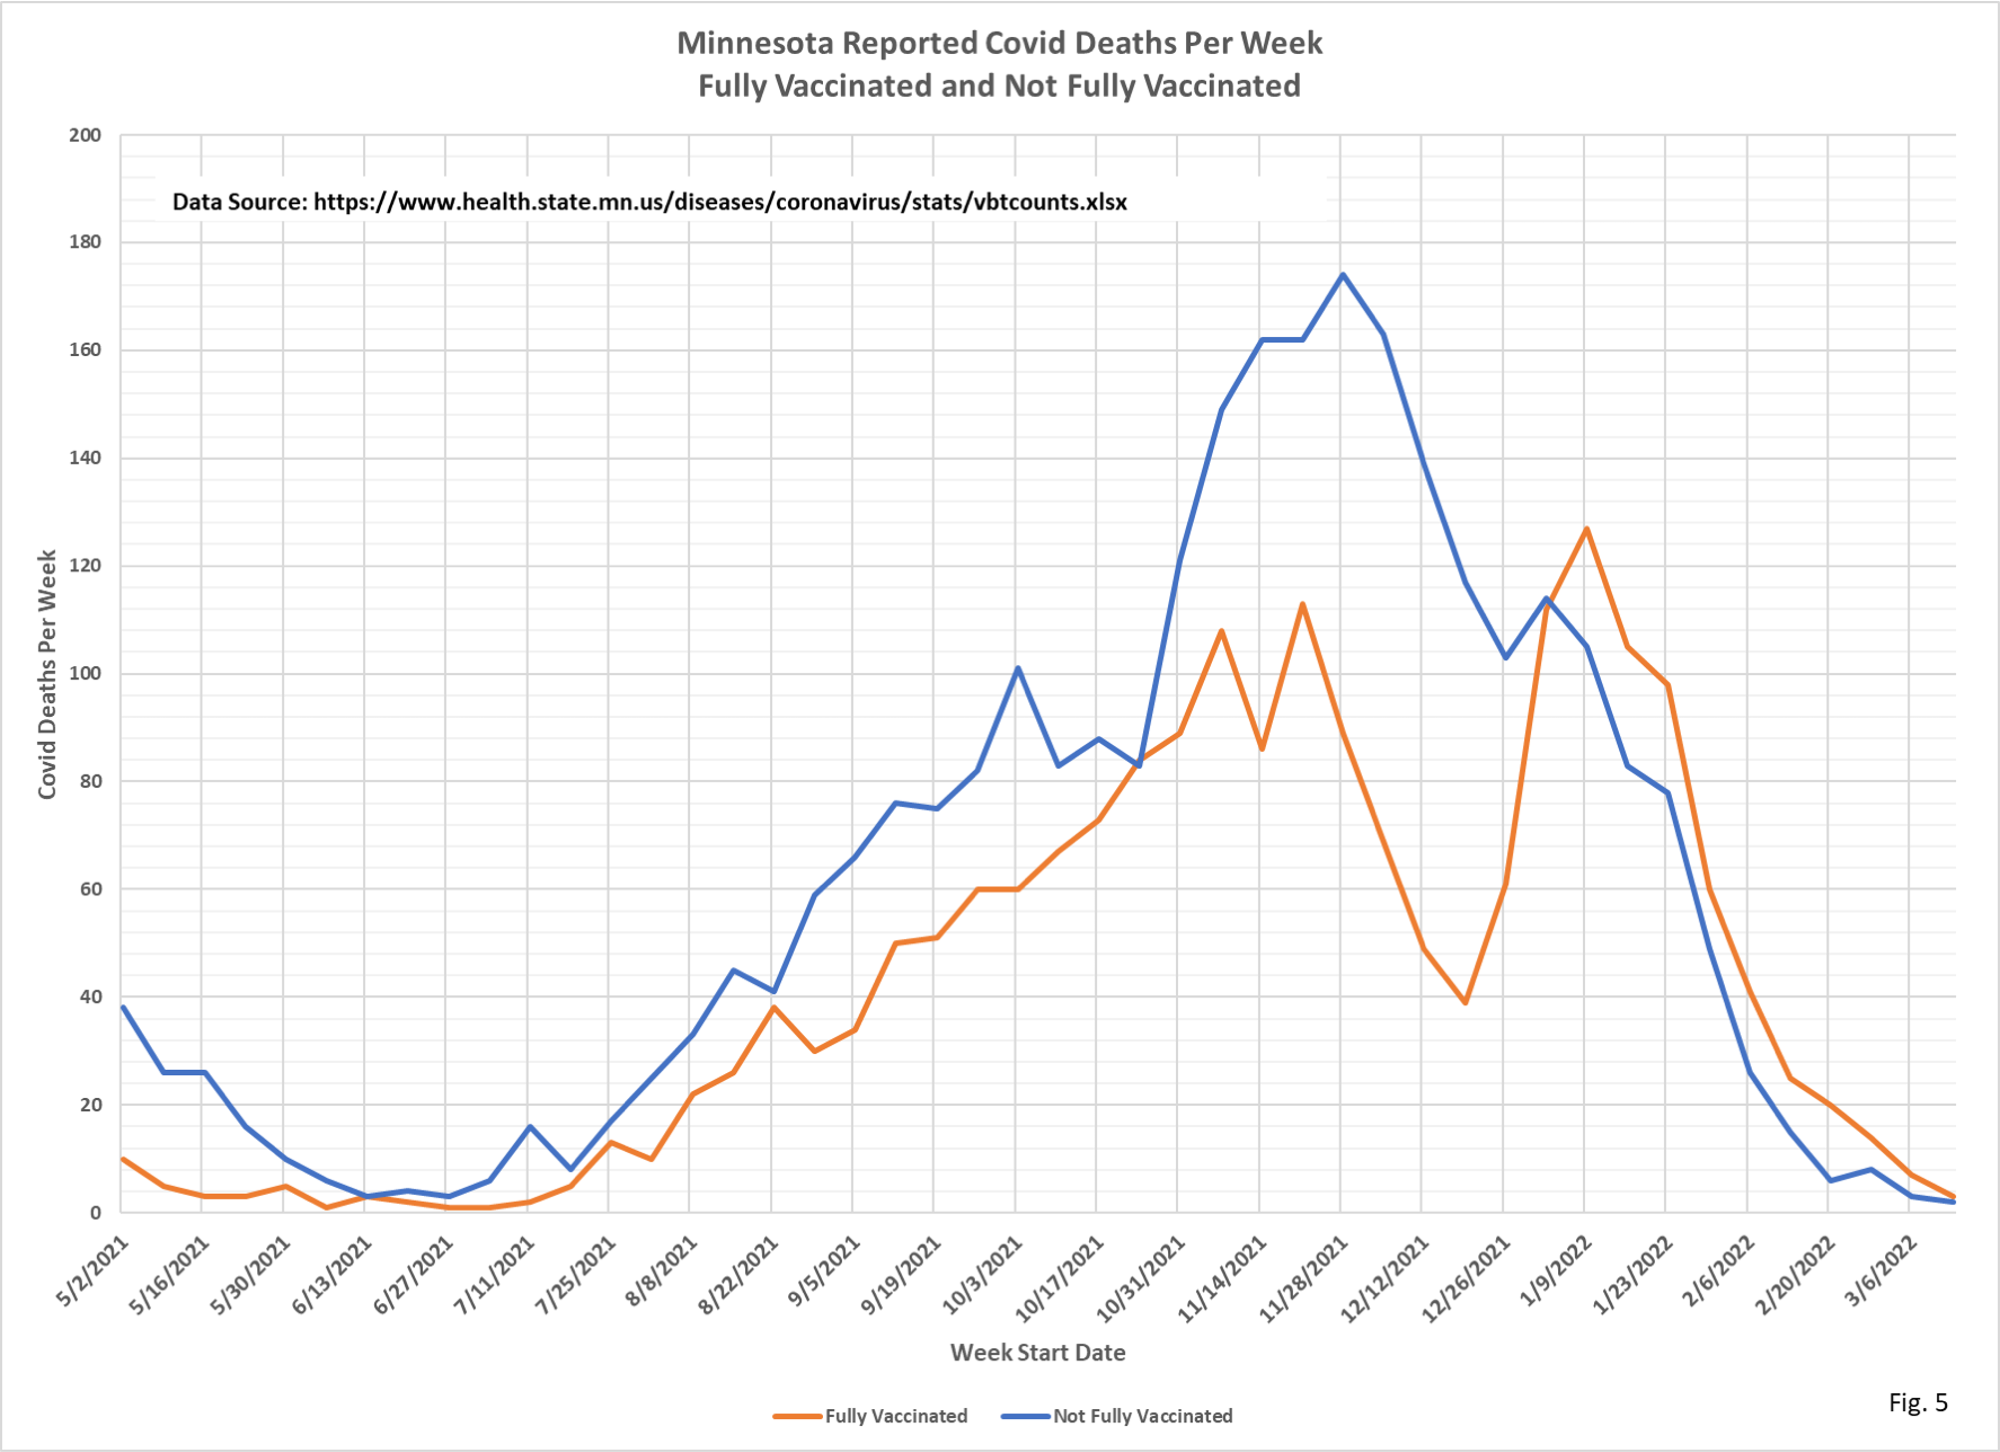
- Fig. 5: This chart displays the vaccinated and unvaccinated deaths each week from the data in Fig. 2.
- The tables and charts are updated for new data released by Minnesota Department of Health (MDH) on 4/18/2022, adding data for the week starting 3/13/2022 and ending 3/19/2022.
- The data source for the data on Fig. 1 is the cumulative breakthrough cases, hospitalizations, and deaths published on the MDH COVID-19 Vaccine Breakthrough Weekly Update https://www.health.state.mn.
us/diseases/coronavirus/stats/ vbt.html - The data source for Fig. 2 is the data file https://www.health.state.mn.
us/diseases/coronavirus/stats/ vbtcounts.xlsx found on MDH web page https://www.health.state.mn. us/diseases/coronavirus/stats/ vbt.html. The data provided in the data file vbtcounts.xlsx is used without modification, other than to sum the weekly events and compute the breakthrough proportion. Vbtcounts.xlsx provides breakthrough and non-breakthrough cases, hospital admissions, and deaths for each week listed. - The charts in Fig. 3 through Fig. 6 are plots of the data in Fig. 2.
- MDH defines a breakthrough event as a Covid case, hospital admission, or death that occurs 14 or more days after completing the vaccination series (not including boosters.
