Still no real sign of any movement in any age groups. I think it will hard to even see the next wave if there is one, due to a combination of very mild infections, which people appropriately treat as a cold, and far less testing.
 Dave’s notes:
- New for this week, the Minnesota Department of Health (MDH) stopped reporting the number of tests performed, as of 4/13/2022. The first two slides displaying tests per week per age group have been deleted from the usual chart series.
- Overall, Covid cases remain flat at low levels, with just the slightest uptick in cases this week. Reported ICU admissions were slightly higher this week as well. Reported Covid deaths are still declining.
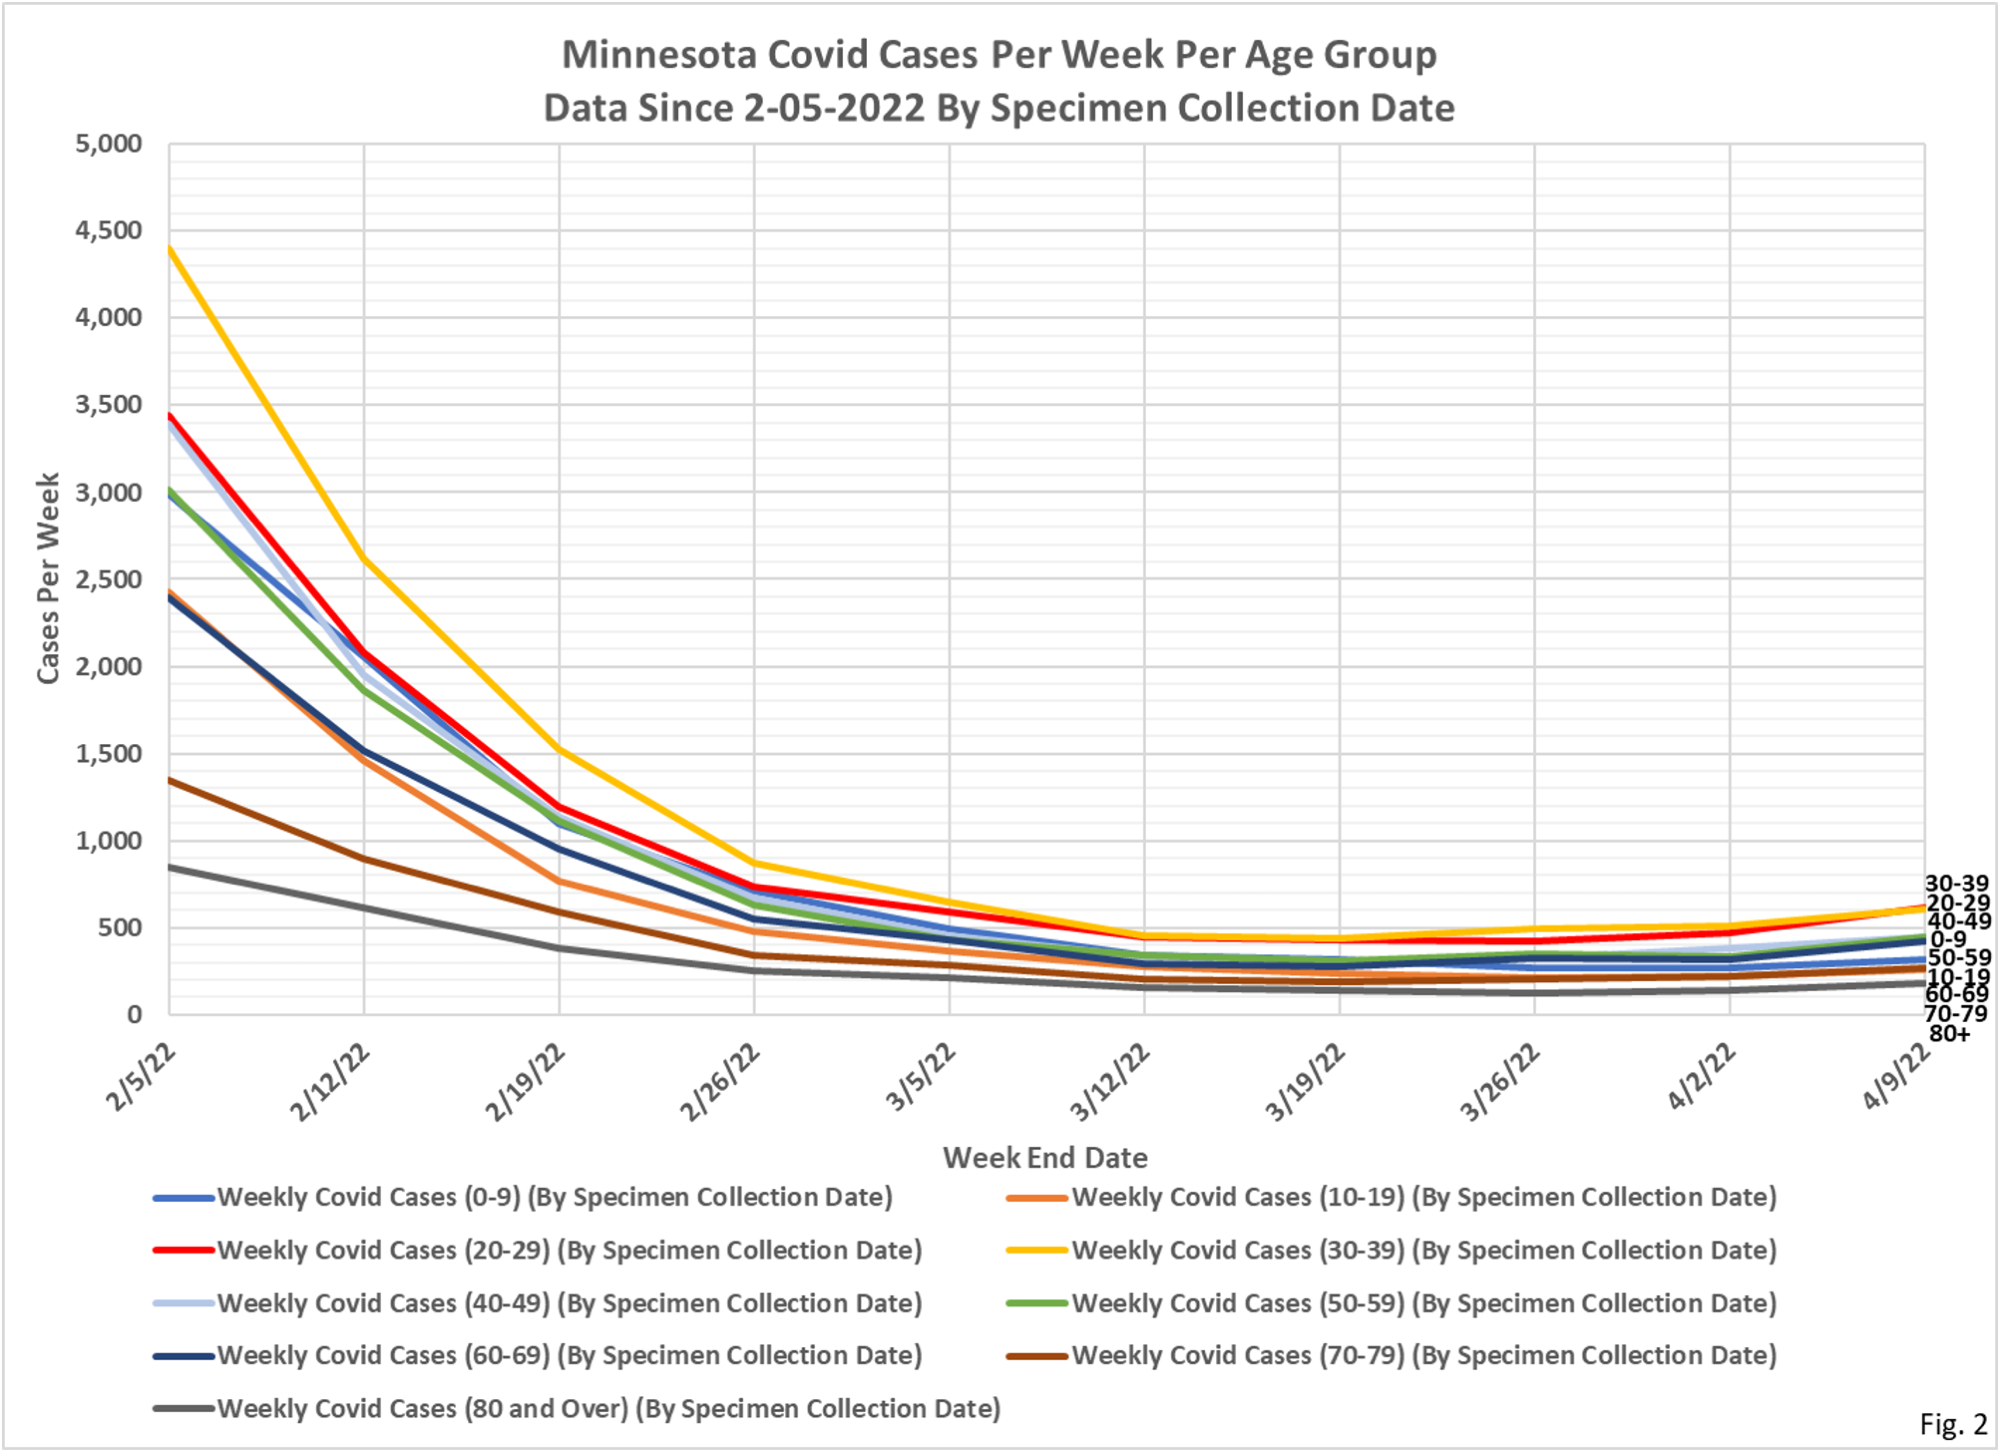
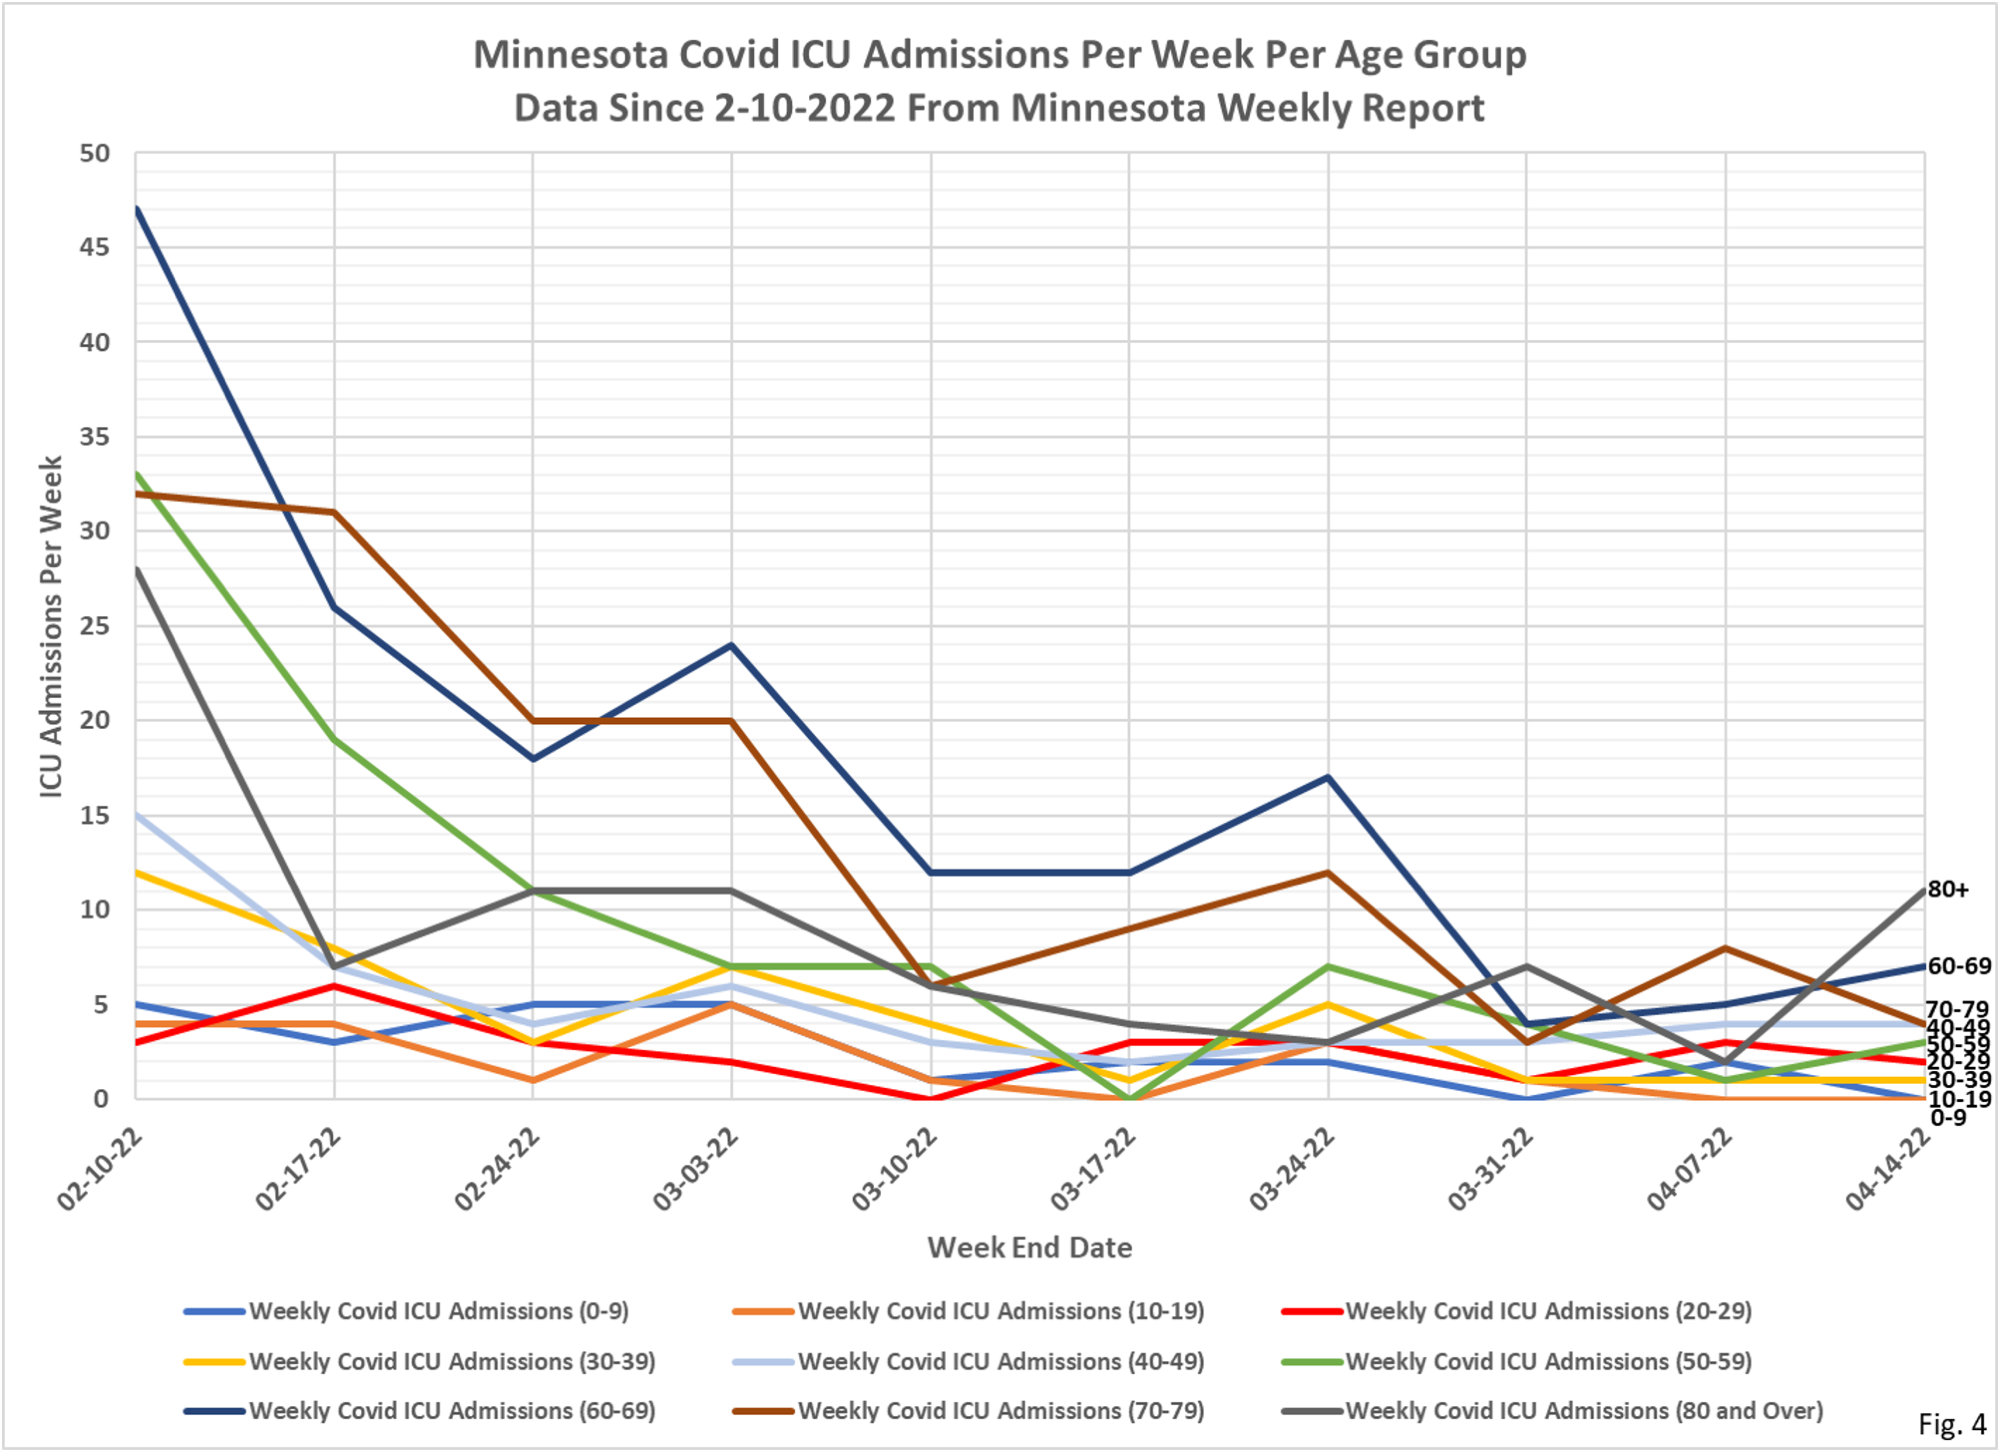
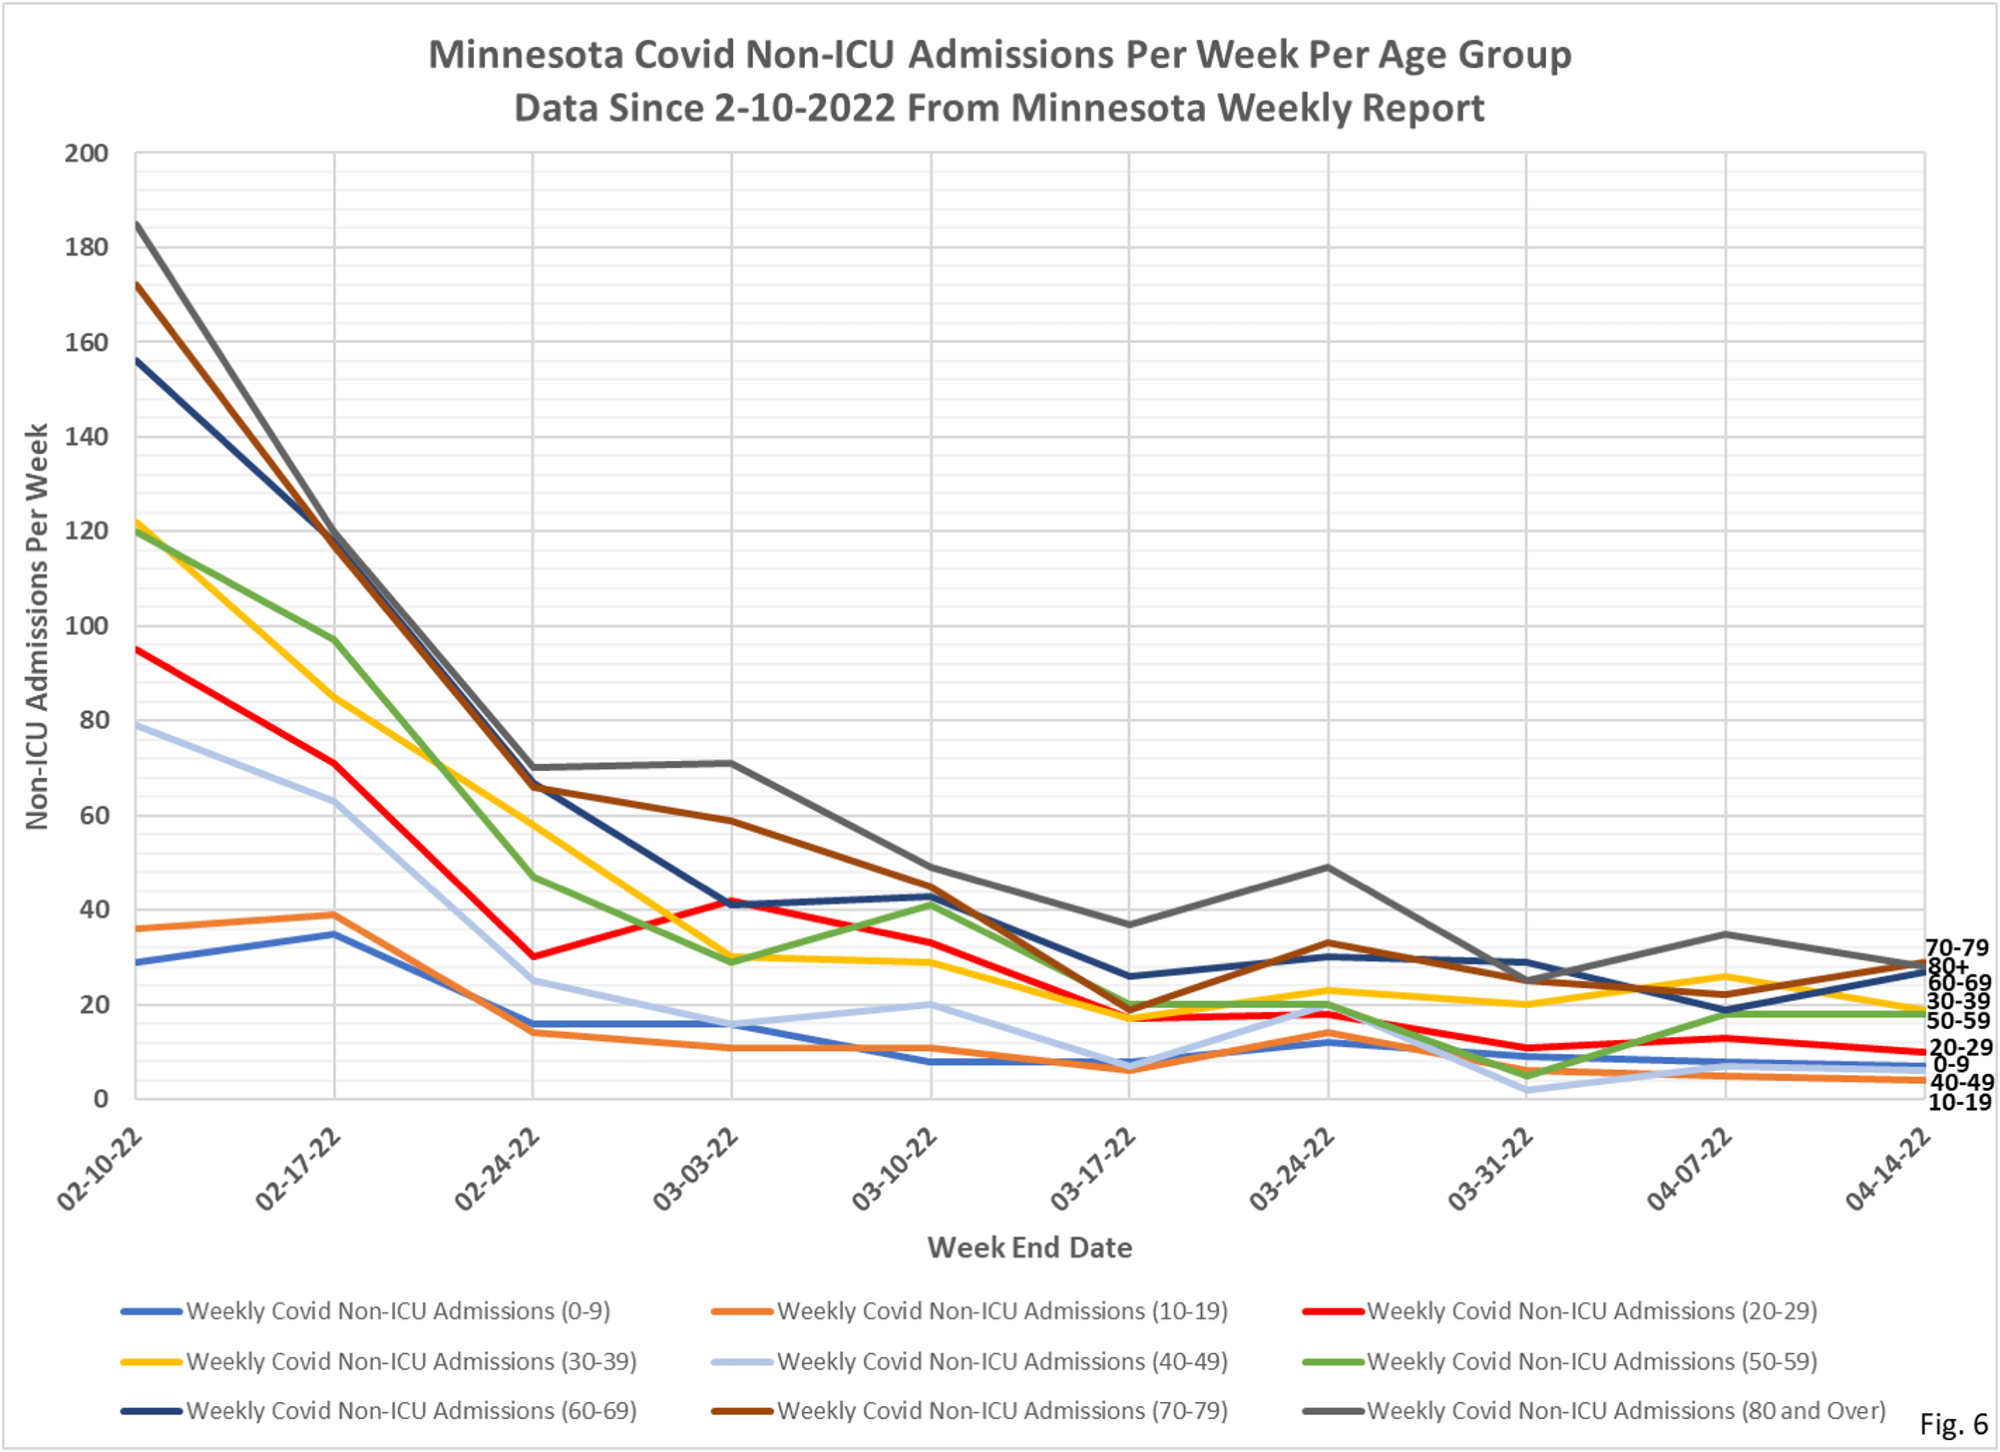
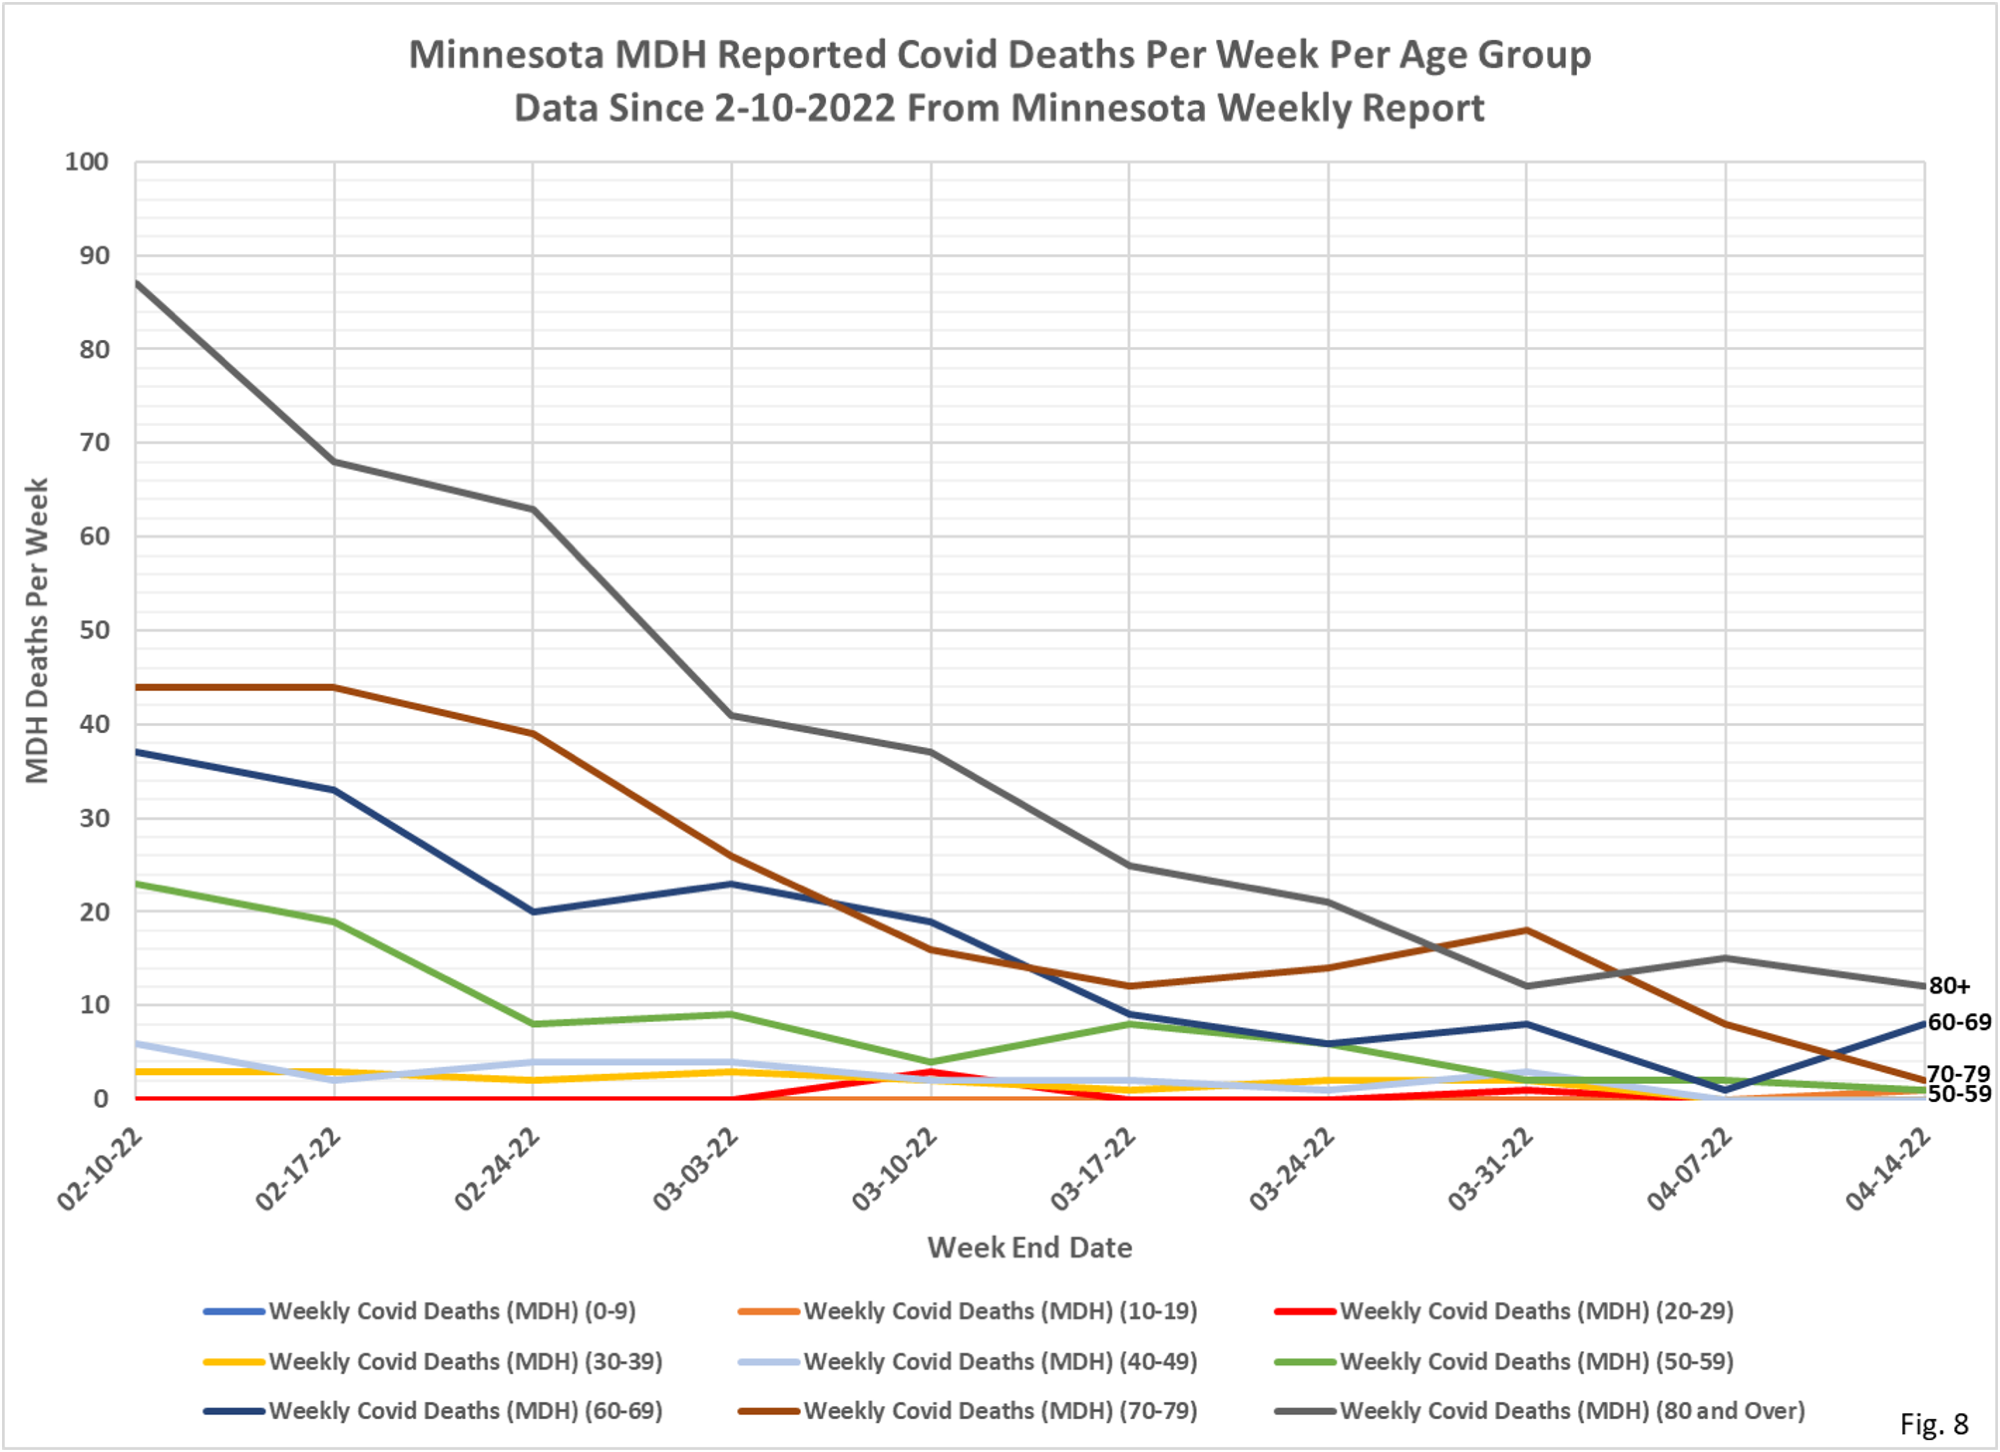
- As always there are 2 charts for each metric. New this week, the second chart for each metric starts on 2/10/2022 (2/05/2022 for the Cases chart, because the data source for cases uses different date definitions).
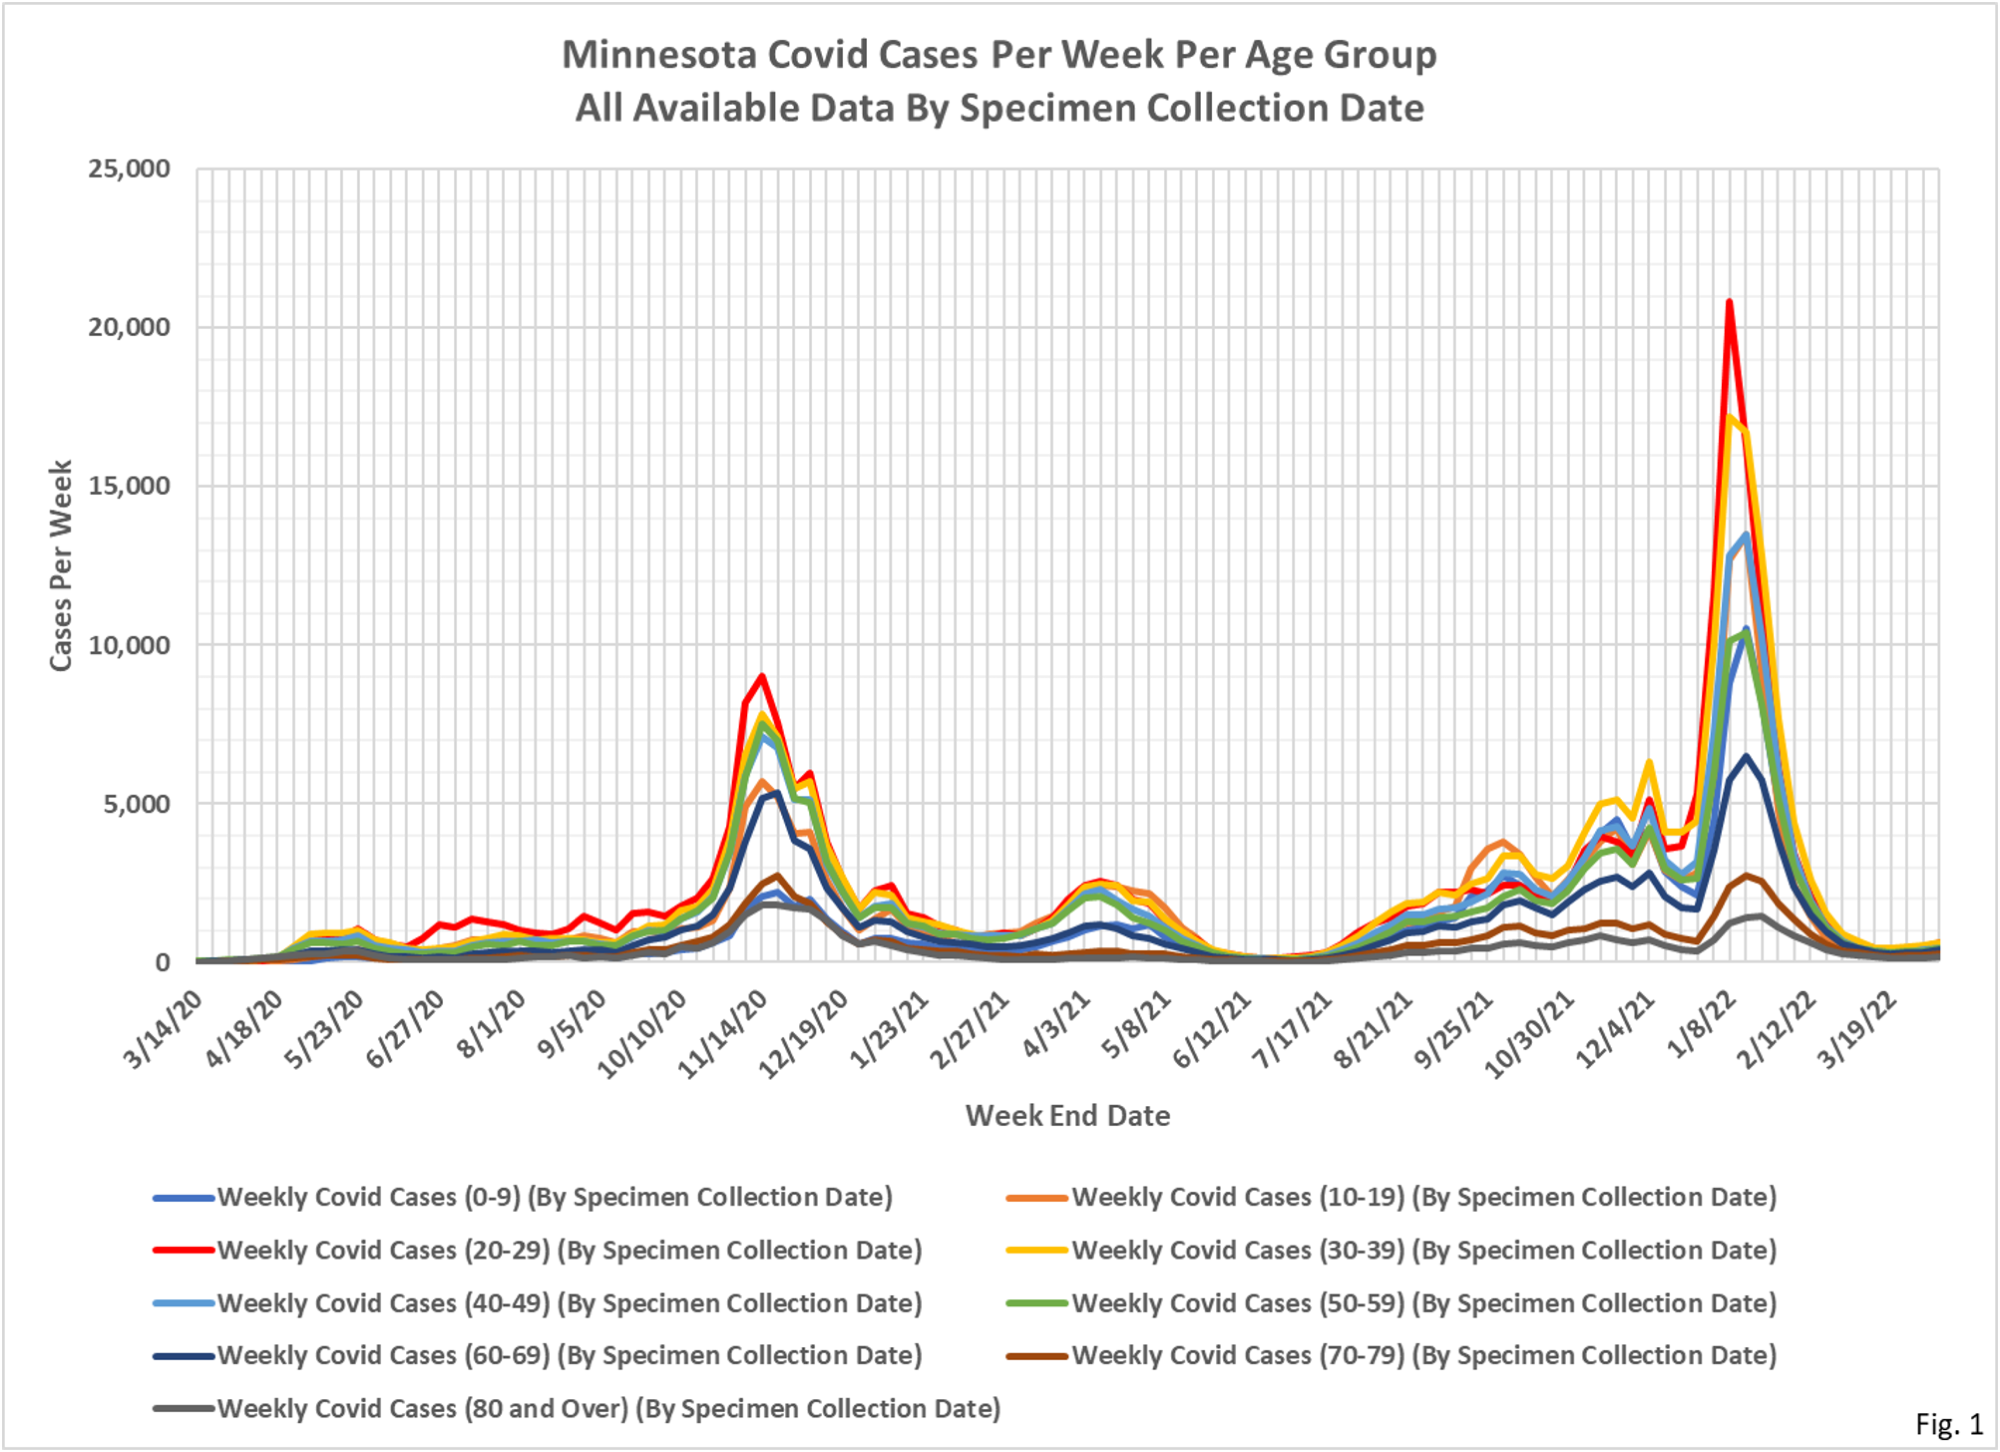
- Fig. 1 and 2: Covid Cases Per Week. The reported Covid cases this week are slightly higher than the totals reported the last 4 weeks. Total reported cases for the week were 4,149 total for all age groups, a modest increase from 3,067 cases reported last week.
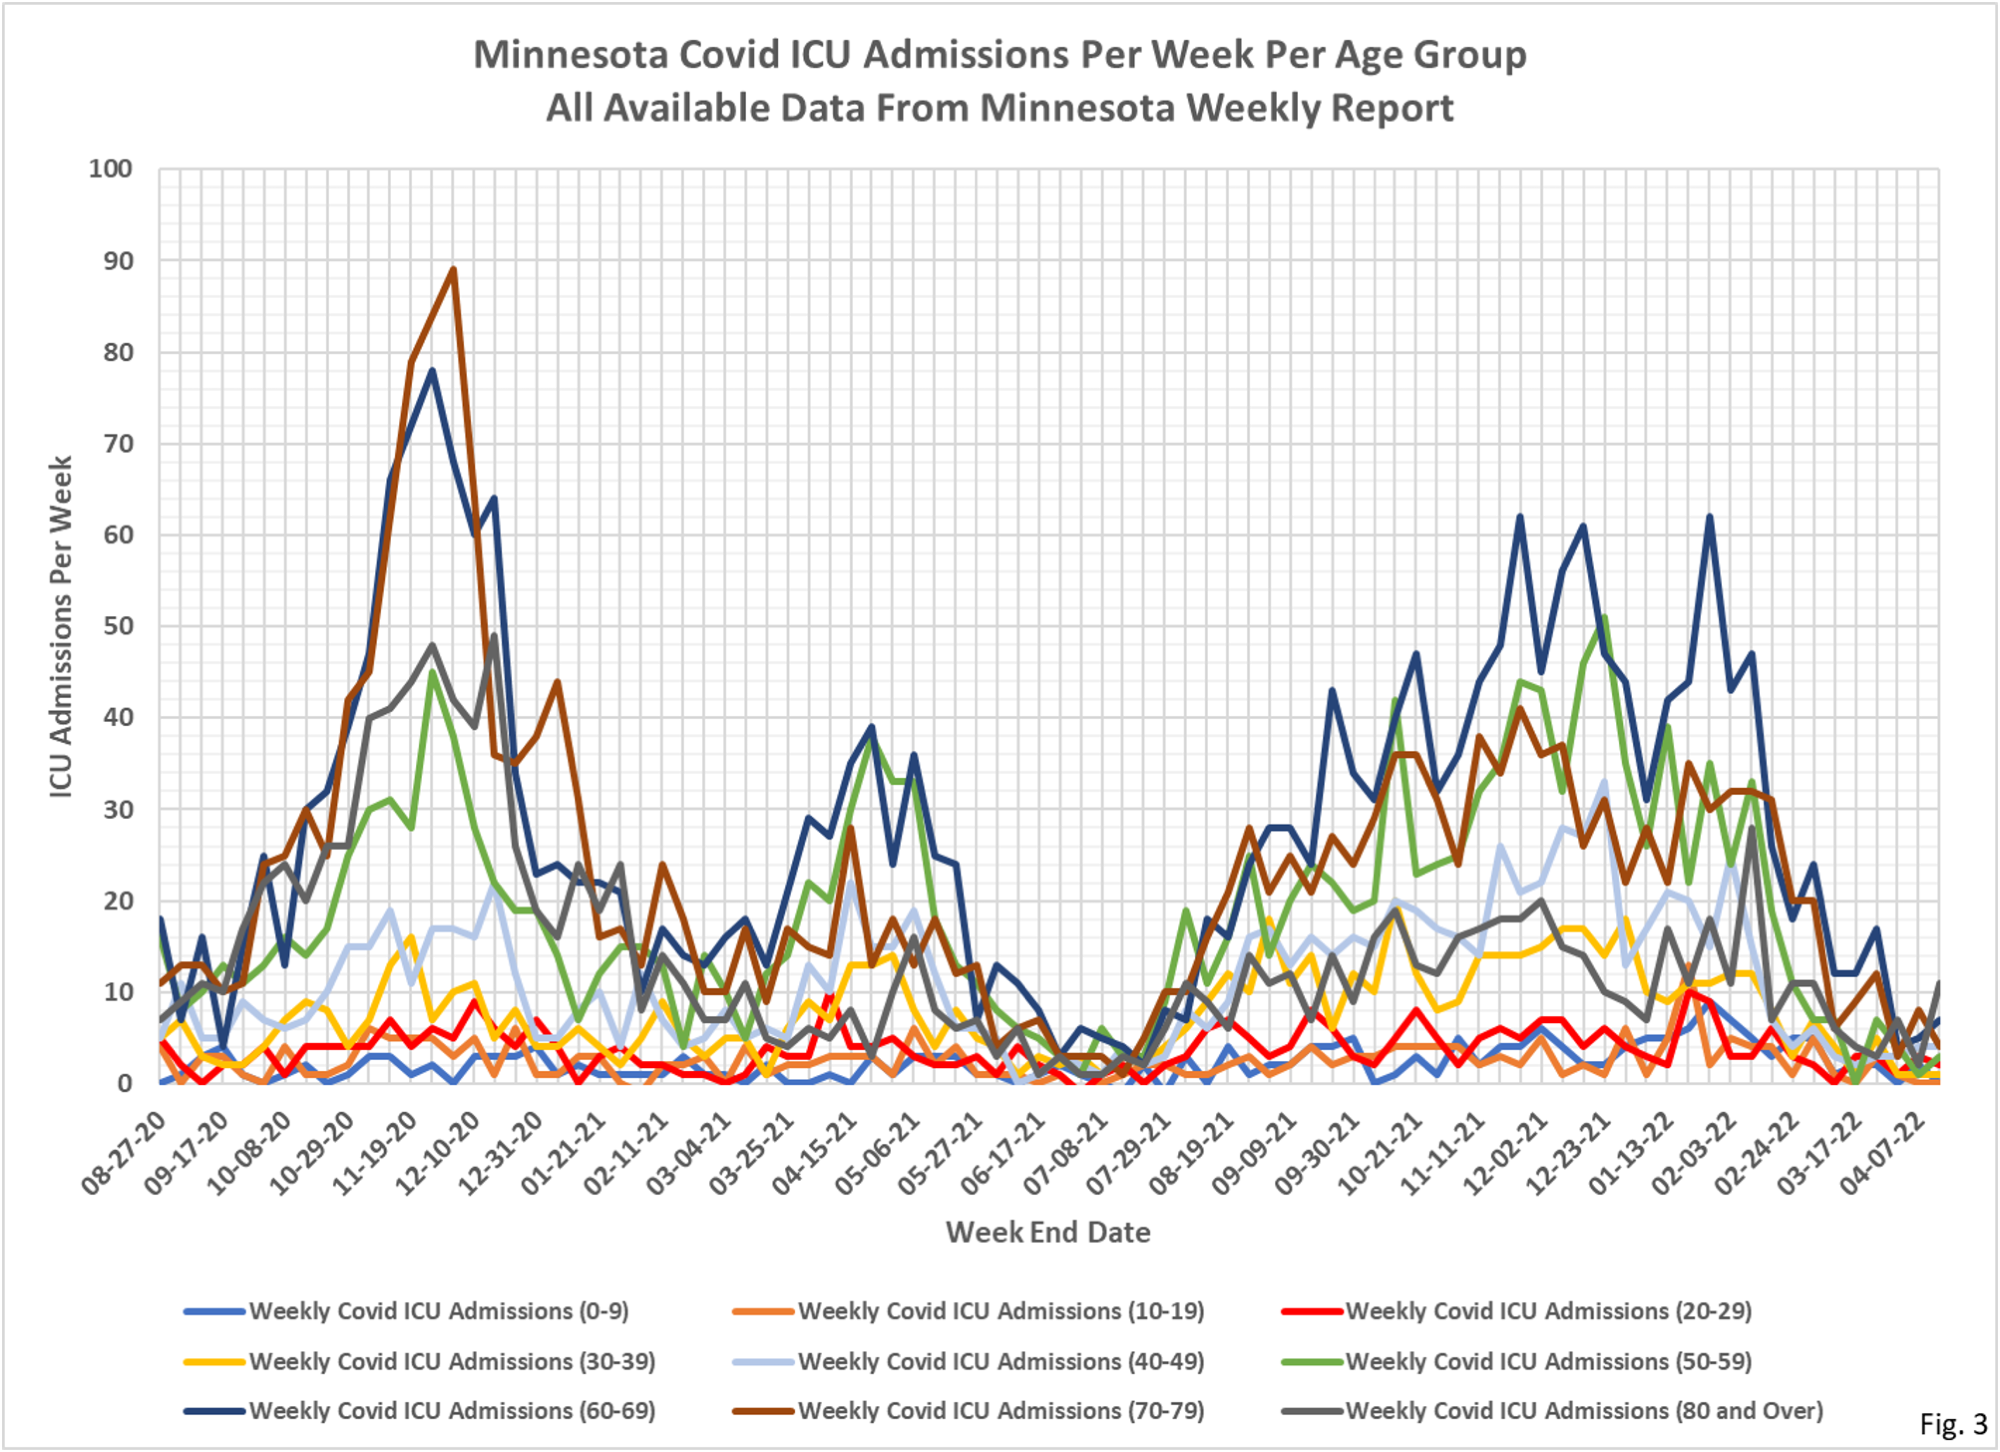
- Fig. 5 and 6: ICU Covid Admissions Per Week. Reported total ICU admissions for the week were 32, an increase of 6 over the total of 26 admissions reported last week.
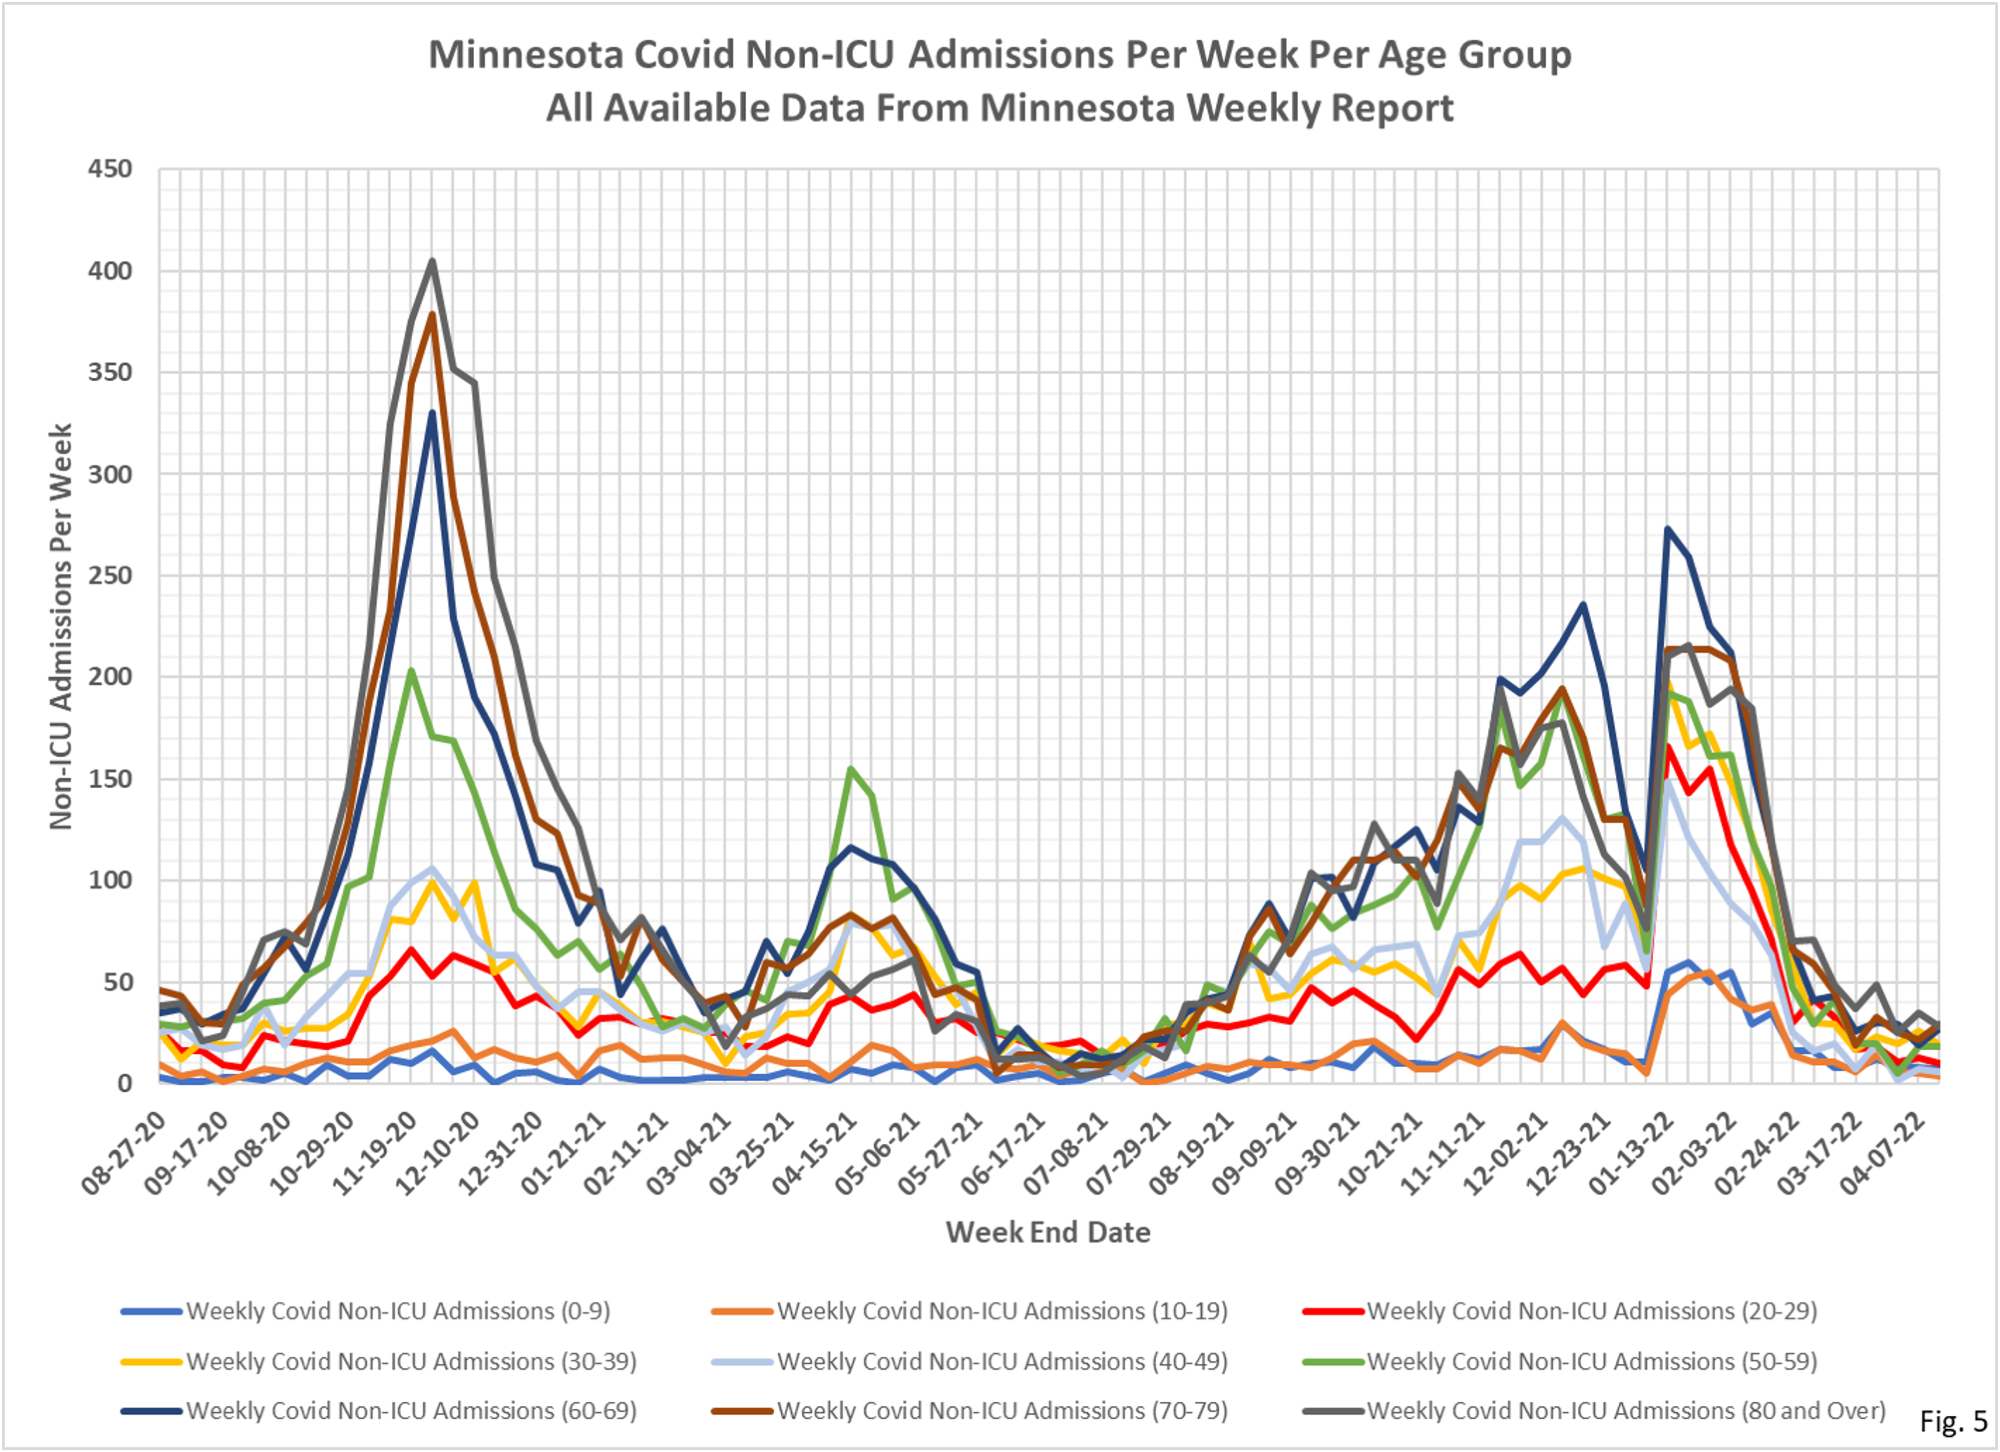
- Fig. 7 and 8: Non-ICU Covid Admissions Per Week. Reported Non-ICU Covid admissions were slightly lower this week, with a total of 148 admissions reported, down 5 admissions from last week’s total of 148.
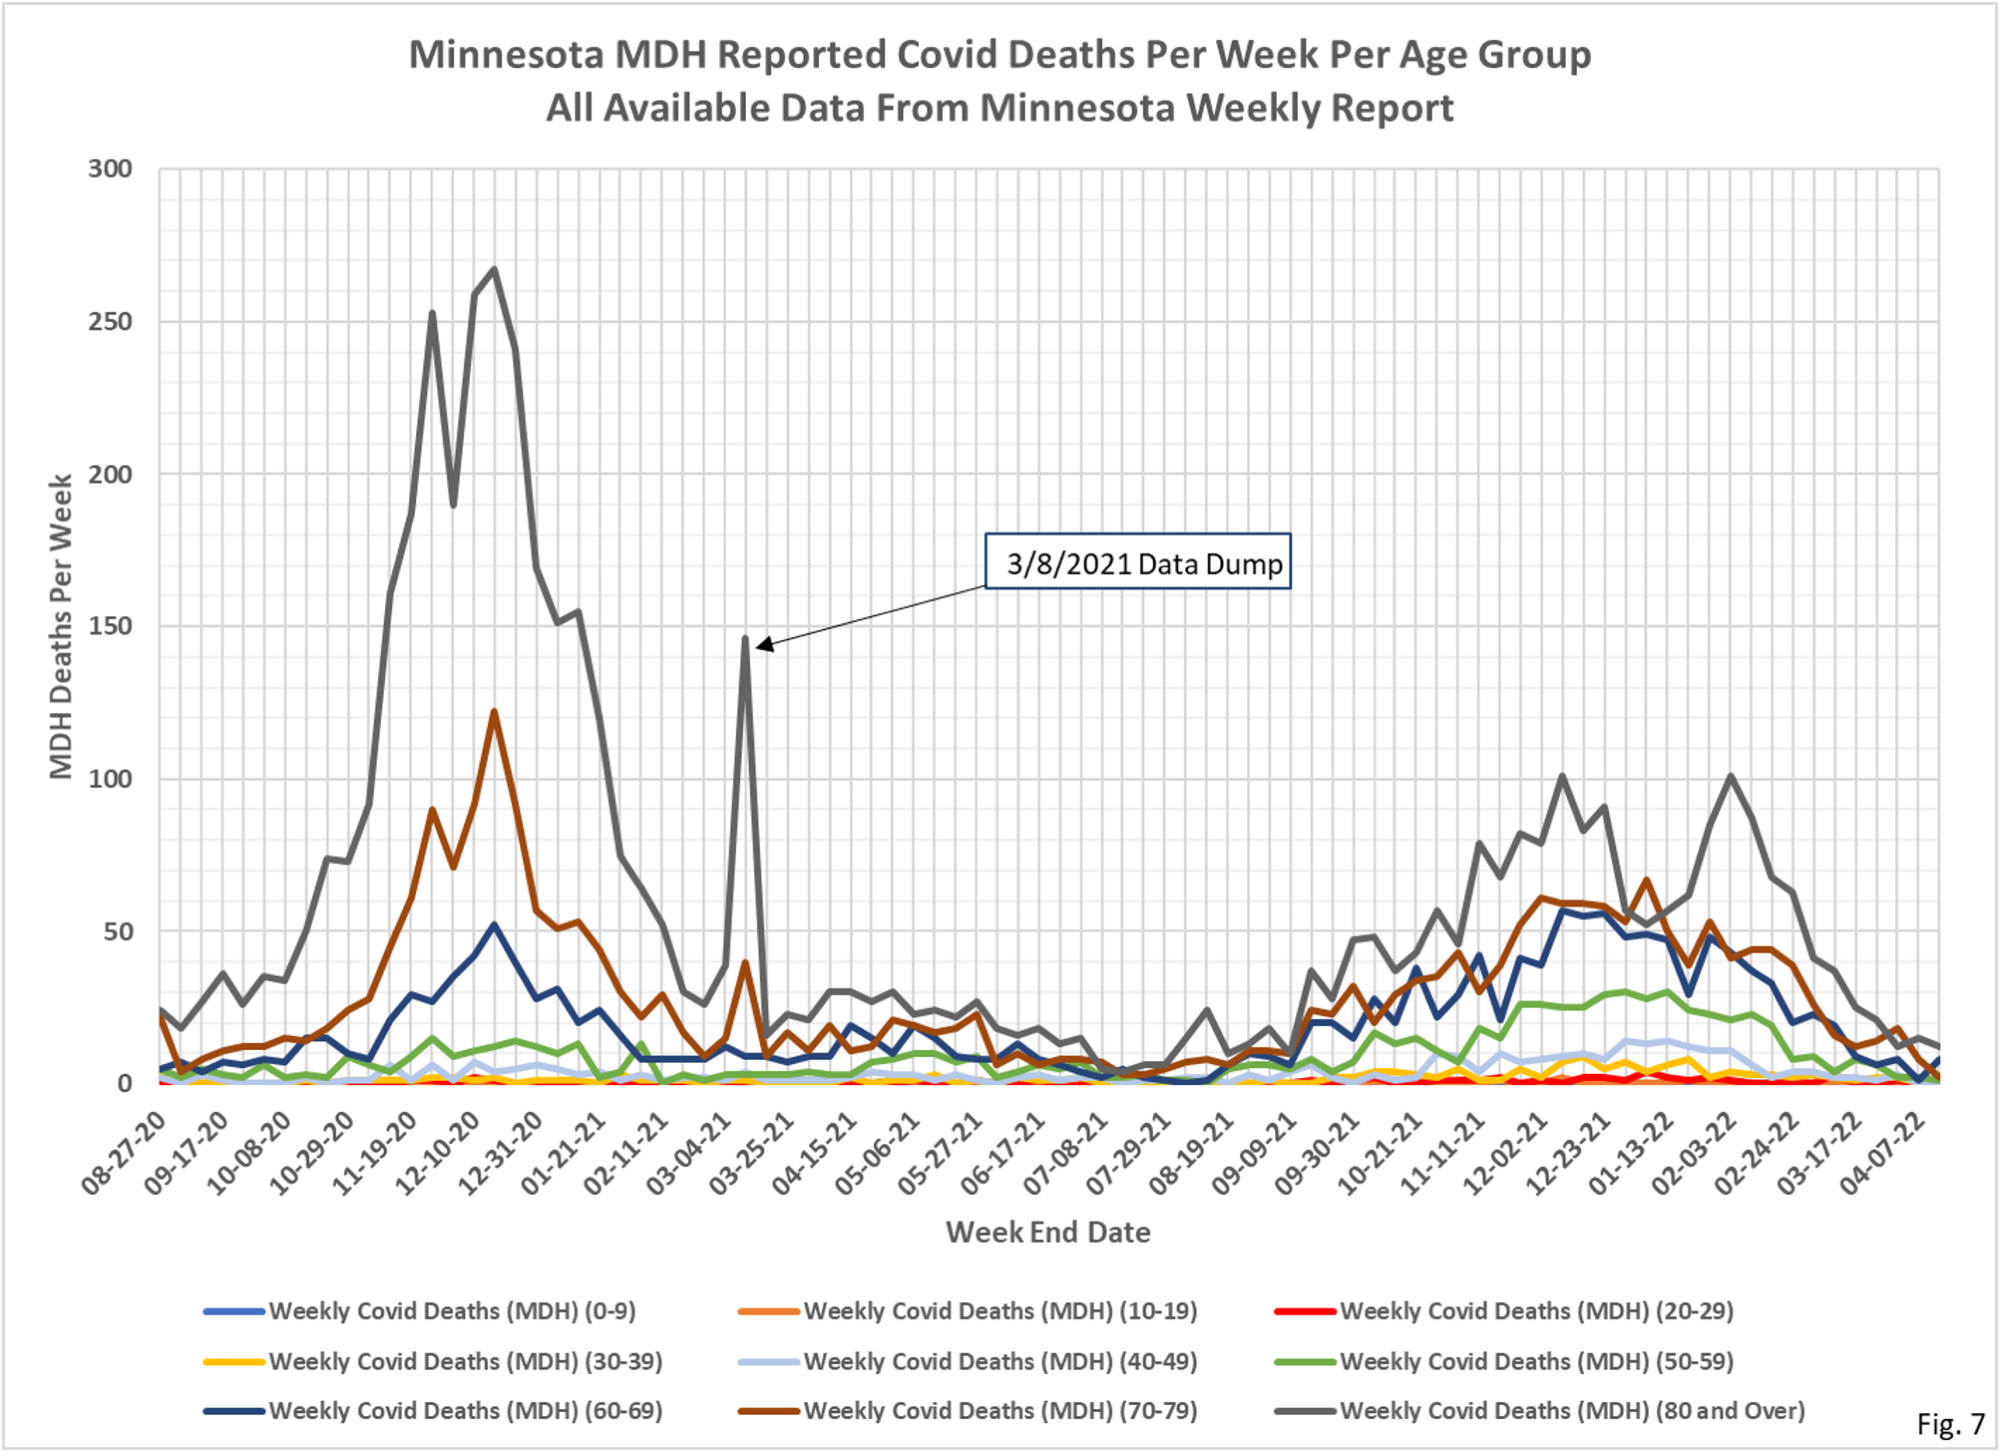
- Fig. 9 and 10: Covid Deaths Per Week. Total reported Covid deaths for the week were 24 a decrease of 2 from the 26 reported deaths last week.
- The data for the charts on testing, hospital admissions, and deaths comes from the Minnesota Weekly Report (available here: https://www.health.state.mn.us/diseases/coronavirus/stats/index.html). The data in the Weekly Report is presented as cumulative totals for each data type each week. I am taking weekly differences and assembling the data into charts. This data is by date of report, meaning the charts are documenting new events reported this week, even though the underlying event occurred sometime in the past. The data is provided for 5 year age groups, and I am assembling into 10 year age groups to make the charts more readable.
- The data for the Covid cases per week comes from a data file published along with the Minnesota Weekly Report, here: https://www.health.state.mn.us/diseases/coronavirus/stats/index.html#wagscd1 This data is published by date of specimen collection, rather than by date of report as the other data is. The data is provided as cases per week in 5 year age groups. I am compiling the data into 10 year age groups in order for the charts to be more readable. This data is updated by date of specimen collection, so it is possible that past week’s data will be updated.

 RSS - Posts
Thanks for the updated charts – especially the comparison of the hospitalizations and deaths since the start of the pandemic.
One observation is the number of hospitalizations in the Nov 2021 -Jan 2022 time frame is approximately 50-60% of the number of hospitalizations in the nov 2020- jan2021 time frame (both being the peaks of the 2nd and 3rd major wave). Since approximately 85% – 90% percent of the vunerable population has been vaxed, I would have expected the number of total hospitalizations to be much lower (30% range vs the 50-60% range). Granted there have been multiple studies ( and apparantly good quality studies and noted by Keven R) showing a significant reduction of covid illness in vaxed patients . If being vaxed reduced the severity of the covid illness, then the number of hospitalizations should have dropped by a much larger amount. That being said, the relatively small reduction in total hospitalizations seems to conflict with conclusions of those studies.
thanks